


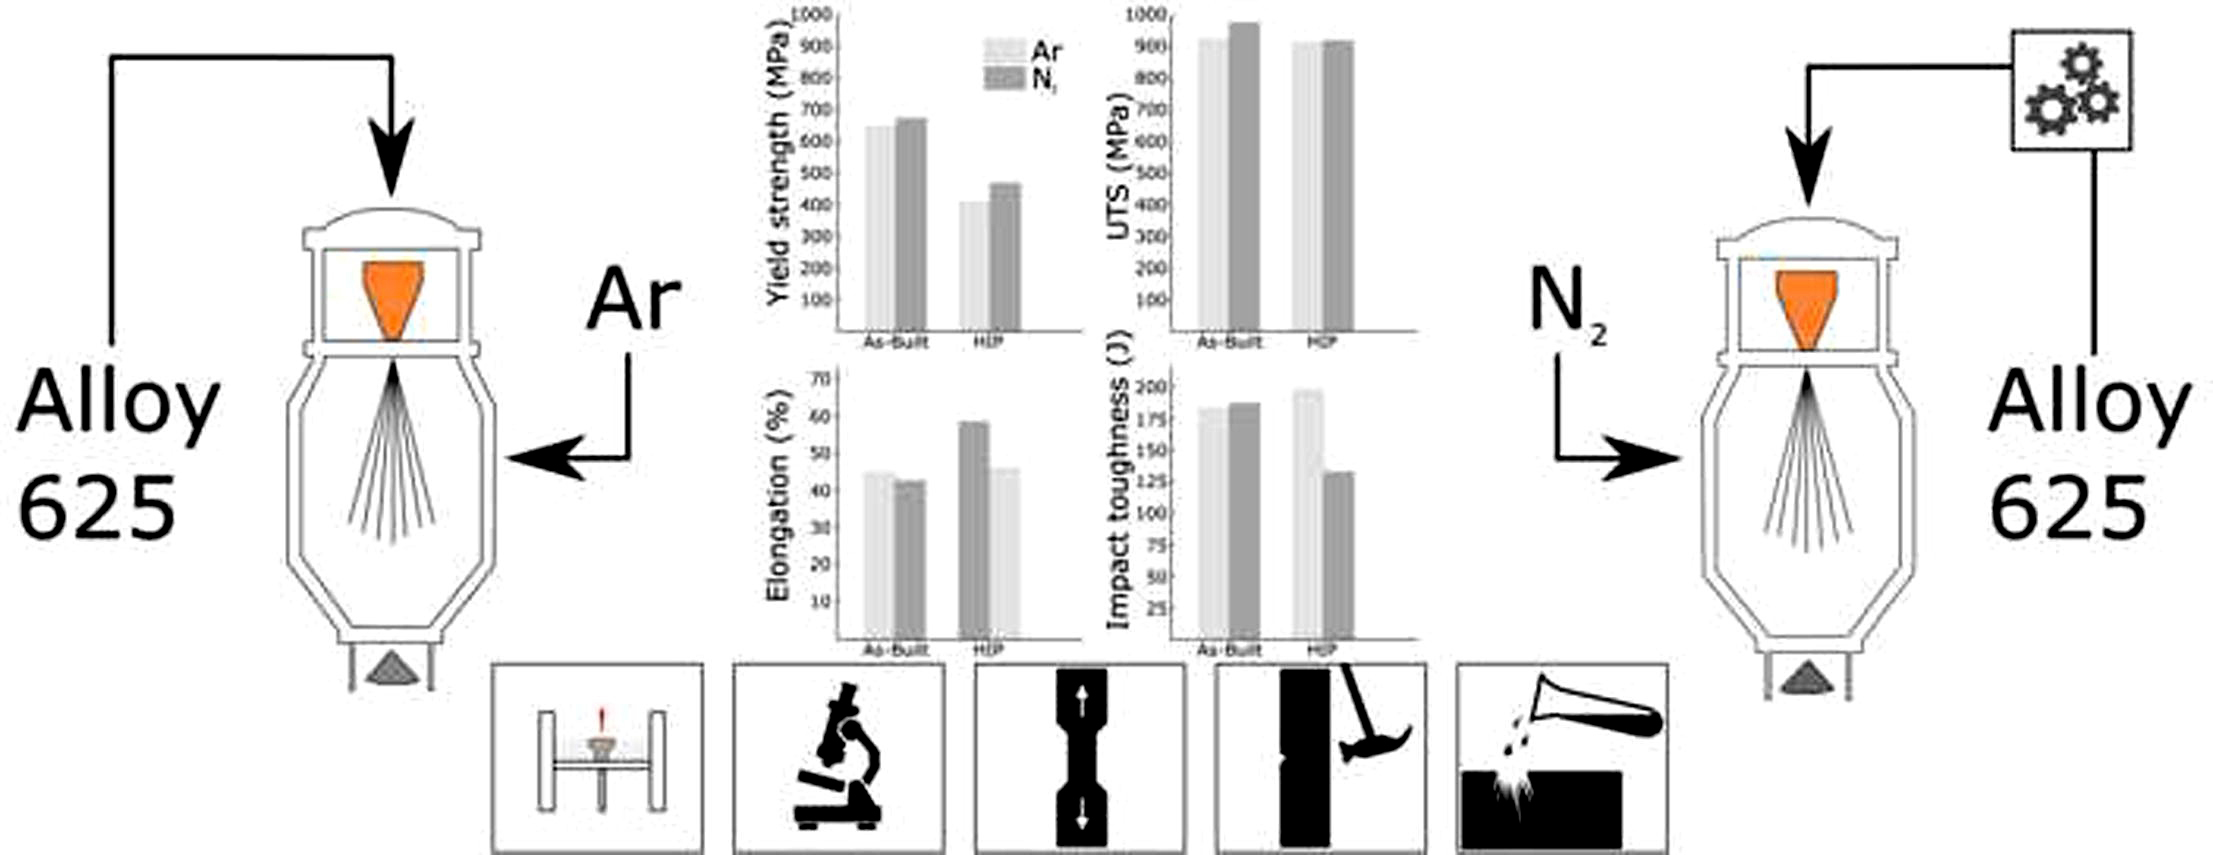
Powder-based metal additive manufacturing processes like powder bed fusion — laser beam use gas-atomized metal powders as feedstock material. Typically, for nickel-based alloys such as Alloy 625, argon gas is used during the atomization process. Considering the larger environmental impact of argon gas compared to nitrogen gas, and the increasing use of gas-atomized metal powders, the environmental impact of powder-based additive manufacturing techniques could be mitigated if gas atomization of alloys such as Alloy 625 using nitrogen was possible. This work investigates the feasibility of tailoring an alloy to allow atomization using nitrogen gas while remaining within the Alloy 625 specification. This is achieved by limiting the nitrogen pick-up during the atomization process, primarily by reducing the titanium content. The metallurgical implications of this tailored alloy and the subsequent atomization using nitrogen, as well as the attained microstructure from the powder bed fusion — laser beam process is investigated and compared to a more common 625 alloy composition, which was atomized using argon. Furthermore, the microstructural development of the alloys after heat treatments is evaluated. Lastly, corrosive properties, as well as tensile and impact properties, are evaluated both in the as-built and hot isostatic pressed condition.
1 Introduction
Alloy 625 is a Ni-based alloy, which, since its introduction in the 1960s, has found widespread application in marine, nuclear, and chemical processing industries [1]. This is because the alloy possesses high strength and excellent corrosion resistance in a variety of environments, also in cryogenic and high-temperature applications. The resistance to corrosion is derived from the formation of a passivating Cr-oxide layer, similar to that of other alloys such as stainless steels, for example 316L. The maintained strength at extreme temperatures is mainly derived from the solution strengthening of the γ-Ni phase by additions of Mo and Nb.
Traditionally, Alloy 625 components have been cast or wrought, but with the increased capabilities of metal powder production, near net shape hot isostatic pressing (NNS HIP) has become a common manufacturing route [2]. Lately, additive manufacturing (AM) has become an additional manufacturing alternative thanks to the alloy’s excellent weldability. Depending on the manufacturing technique, different microstructures will be achieved. Typically, casting produces coarser grains with larger grains located toward the core of the casting, while the NNS HIP process result in a much more isotropic material with small equiaxed grains throughout the component. Additive manufacturing, on the other hand, often results in a highly textured material with elongated grains oriented parallel to the build direction[3]. This texture is a consequence of the large thermal gradients present during the AM processes, resulting in an epitaxial growth. A consequence of this texture is anisotropic mechanical properties which are commonly evaluated in tensile testing [4], [5], [6].
In the AM process known as powder bed fusion — laser beam (PBF-LB), a component is produced in a layer-by-layer process. At first, a thin layer of pre-alloyed metal powder is spread on top of a build plate. This layer is then selectively molten by the means of a focused laser beam, which is scanned over the areas that correspond to a cross section of the intended component. The process continues iteratively with spreading and melting of additional layers until a complete component has been produced. The relatively small volume of molten material at any given moment results in large thermal gradients, which promote rapid cooling and hence the pronounced texture previously mentioned. Furthermore, when the focused laser beam is scanned over the region that is to be molten, not only is the powder of that specific layer molten, but also the material directly beneath it. This is known as back-melt. Further below the scanned area, the material will not be remolten, instead it will be affected by a temporary temperature increase, forming what is known as a heat-affected zone (HAZ)[7]. Consequently, materials produced via PBF-LB have been subjected to both cyclic melting and cyclic heating, which has a direct influence on the resulting material texture, precipitation, and the segregation of elements. For some alloys, this cyclic melting and heating result in severe segregation and the precipitation of large amounts of brittle and incoherent phases[8]. These attributes are common for alloys less suitable for welding and might be challenging for additive manufacturing using the PBF-LB process.
The material feedstock for the PBF-LB process is gas atomized powder. The atomization process of Alloy 625 is conventionally performed using argon gas. The production of argon gas by fractional cryogenic distillation of air results in several byproducts, one of these being nitrogen gas[9]. Since air typically consists of 0.9% argon and almost 80% nitrogen, it is considerably more challenging to extract argon gas than nitrogen gas. Hence, production of nitrogen gas has a smaller environmental footprint compared to that of argon gas[10]. Consequently, replacing argon gas with nitrogen gas would reduce the environmental footprint of the atomizing process.
However, one element included in Alloy 625, titanium, has a high affinity for nitrogen and forms primary nitrides such as TiN. Such precipitates may affect the mechanical properties and render the material brittle and less resistant to fatigue[11]. Fortunately, the alloying specification of Alloy 625 with UNS designation N00625 is quite wide, especially regarding the amounts of Mo, Nb and Ti[12]. This makes it possible to tune the alloy to allow for higher nitrogen content by reducing the amount of Ti, possibly avoiding precipitation of primary nitrides.
An earlier study on nitrogen gas atomized Alloy 625 has shown that nitrogen gas atomized powders can result in a larger amount of prior particle boundaries in NNS HIPed components[13]. Also, attempts on tailoring the 625-alloy composition to better suit atomization using nitrogen gas has been undertaken by Rizzo[14], where the titanium content was reduced to limit TiN precipitation during atomization and NNS HIP processes. In that study, it was found that the higher nitrogen content had an insignificant impact on thermal stability, while the ductility in the resulting material was impaired. There are few examples of use of nitrogen gas atomized 625 powders in the PBF-LB process[15], and to the authors’ knowledge, no comparison between argon and nitrogen gas atomized powers in said process.
This work investigates and compares two variants of pre-alloyed Alloy 625 powders atomized using argon and nitrogen, respectively, to determine if acceptable material performance can be attained while reducing the environmental footprint. The microstructure is characterized using SEM, and the mechanical properties are evaluated by tensile and impact testing as well as with indentation techniques. Lastly, the corrosive properties of the alloys are evaluated and compared. The alloys are investigated both in the as-built condition and after hot isostatic pressing (HIP). HIP was used both as a solution heat treatment and to reduce any porosity which might impact the mechanical properties.
2 Experimental
2.1 Alloying and atomization
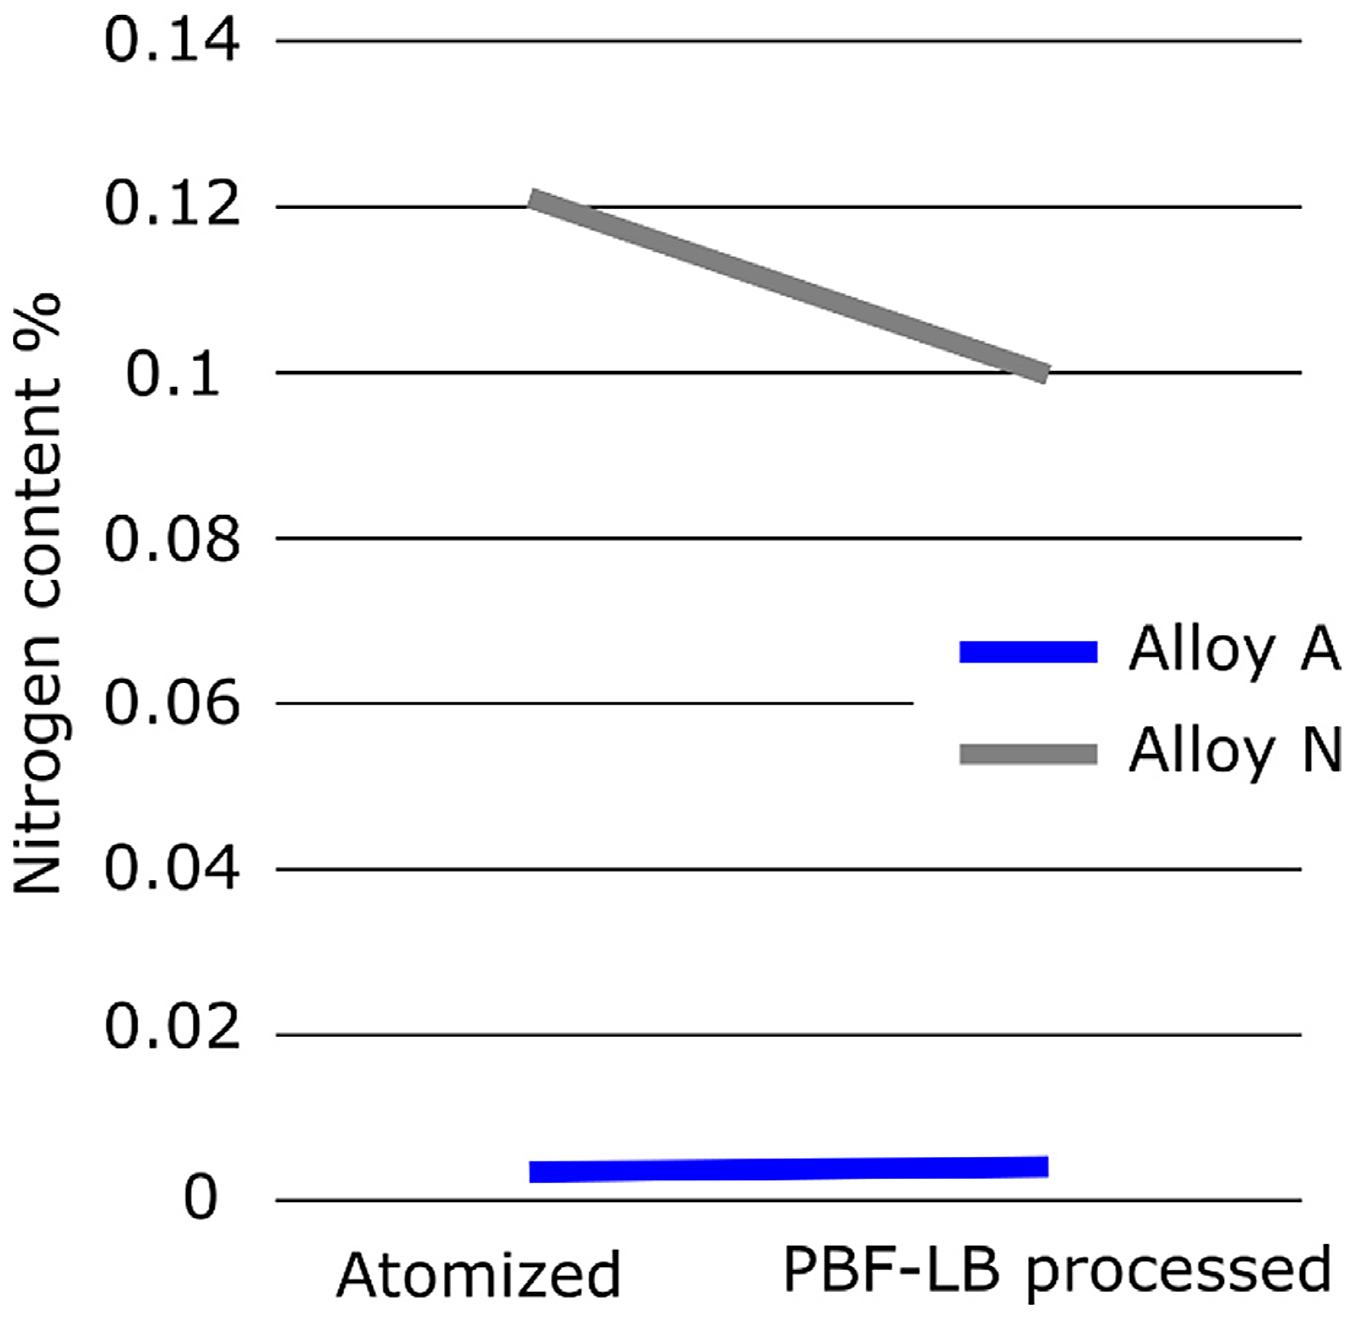
All samples in this study were produced using Sandvik’s Osprey® metal powders, which had been produced using vacuum induction melting with subsequent gas atomization with either argon or nitrogen gas. Impact, tensile, and corrosion test samples were manufactured using powders atomized from two different compositions of Alloy 625, henceforth denoted Alloy A (argon) and Alloy N (nitrogen). The alloying composition after gas atomization of alloy A and N is shown in Table 1. Also shown in Table 1 is the nitrogen content in the as-built material. Alloy A was atomized using argon gas and has a “typical” alloying composition with regards to titanium. Alloy N on the other hand was atomized using nitrogen gas and, therefore, has lower titanium content in order to avoid excessive precipitation of TiN during both the atomization and the PBF-LB processes. The produced powders A and N had the same particle size distribution (+15/-45 µm) and equally good processability, meaning that qualitatively, the powders behaved equally good when spreading the power layers. Consequently, the same process parameters for the PBF-LB process could be used for both alloys. The nitrogen content in the two alloys in the as-built material conditions was evaluated using melt extraction according to standard ASTM E1019.

2.2 PBF-LB
The investigated samples were produced in and EOS M100 PBF-LB system [16] equipped with a 200W Yb-fiber laser having a focus spot 45 µm in diameter. The build chamber was purged using high purity argon. The resulting protective atmosphere of argon was used throughout the entire PBF-LB process. All samples were produced using a layer thickness (d) of 20 µm and a 67-degree rotating scan strategy. This means that the scanning direction of each subsequent layer was rotated 67 degrees relative to the previous layer. A laser power (P) of 160 W and a scan speed (S) of 1,400 mm/s was used. In combination with a hatch distance (h) of 60 µm a resulting input energy density of 95 J/mm3 was calculated using Equation 1.
 By the means of optical microscopy and image analysis on polished cross-sections of the produced material a density above 99.9% could be determined for both alloys. Sample dimensions for tensile and impact samples were ∅10×60mm and 10×10×60mm, respectively. All samples were built with the longest axis of symmetry parallel to the build direction.
2.3 Sample preparation & mechanical testing
After the L-PBF process, half of the produced samples were heat treated using HIP where the samples were heated to 1,120°C at a pressure of 100 MPa for 2 hours. All tensile samples were then machined to ASTM E8M standard 4C20 rods and tested in an INSTRON 4505 using an initial strain rate of 2.5·10-4/s. A total of three samples per material condition was tested. To reduce the total test time for tensile testing, the strain rate was increased after material yield (at 1.7% elongation) to 5.0 ↔ 10-3/s until fracture occurred. Impact samples were machined to full sized 10 ↔ 10 mm Charpy V-notch specification and tested in a Zwick PSW 750 equipment in accordance with ISO-14556. The impact samples, built vertically, attained an impact plane with its normal parallel to the build direction. The mechanical properties of Alloy A and N were further investigated using 300 gf micro-Vickers indentation both in the as-built and HIP condition in order to evaluate hardness in the macro scale. In order to evaluate differences in hardness coupled to variations in microstructure, nanoindentations in a 10 ↔ 10 matrix were performed using a Berkovich tip and 100 mN loads.
2.4 Corrosion tests
Prior to the electrochemical experiments, samples produced using alloy A in the as-built and HIP condition, as well as samples produced using alloy N in the as-built and HIP condition, were polished to a 1 µm diamond suspension finish and subsequently ultrasonically cleaned in acetone, ethanol, and, lastly, deionized water. An in-house three electrode cell was used, using each sample as a working electrode, an Ag/AgCl (3 M NaCl) (0.205 V vs. SHE) as reference electrode and a Pt wire as counter electrode. The cell was connected to a Metrohm Instruments Autolab PGSTAT302N potentiostat/galvanostat. A circular surface area of 0.2 cm2 of the samples were exposed to the 0.5 M H2SO4 electrolyte, which had been degassed in N2 for 60 minutes to remove any dissolved oxygen. All samples were left under open circuit potential (OCP) for 60 minutes, after which electrochemical impedance spectroscopy (EIS) measurements were performed under OCP. The EIS plots were recorded using a sinusoidal AC perturbation of 10 mV and a frequency range from 100 kHz to 100 mHz. Following that, polarization curves were recorded to display the corrosion resistance. To evaluate the significance of native of oxides on the corrosion resistance, two different experimental approaches were selected when performing the polarization measurements, both using a scan rate of 1 mV/s. In the first approach, the starting potential was −0.2 V vs. OCP i.e., about −0.2 V vs Ag/AgCl, and the polarization curve was terminated at 1.1 V. For the second approach, the starting potential was −0.6 V vs. Ag/AgCl and scanned to 1.1 V. Also, for the second approach, the native oxide was first reduced by applying a stable potential of −0.9 V vs Ag/AgCl prior to the recording of the polarization curve. Corrosion potentials and corrosion current densities were determined by using graphical extrapolation involving anodic and cathodic currents close to the corrosion potential i.e., Tafel plots.
2.5 Material characterization
Microstructural and fractographic studies were conducted in a Zeiss Merlin Field Emission SEM equipped with EDS. WAXS diffraction using synchrotron light was performed at DESY P.21 using a wavelength of 0.1239 Å awhile the beam had a 0.6 ↔ 0.6 mm2 cross sectional area. A VAREX XRD4343CT detector was used, placed 1.75 meters behind the sample. The attained data was analyzed using the FullProf Suite.
3 Results
3.1 Microstructural characteristics
3.1.1 As-built condition
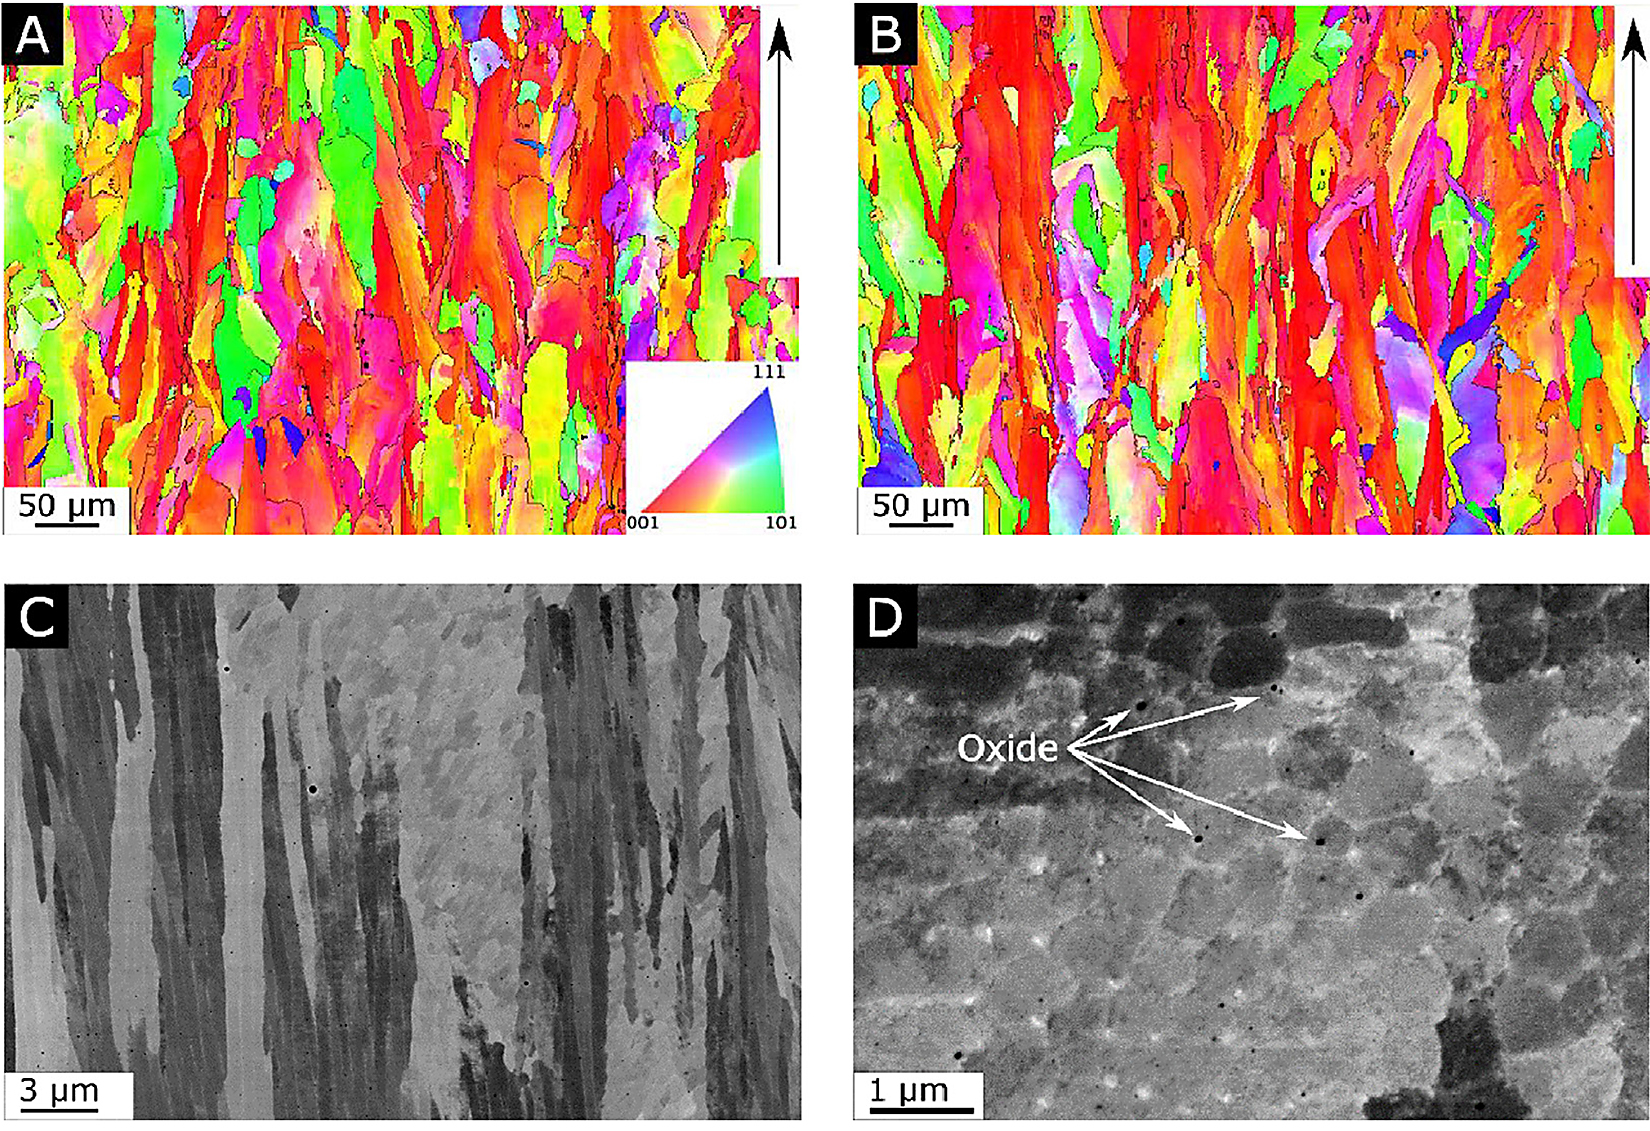
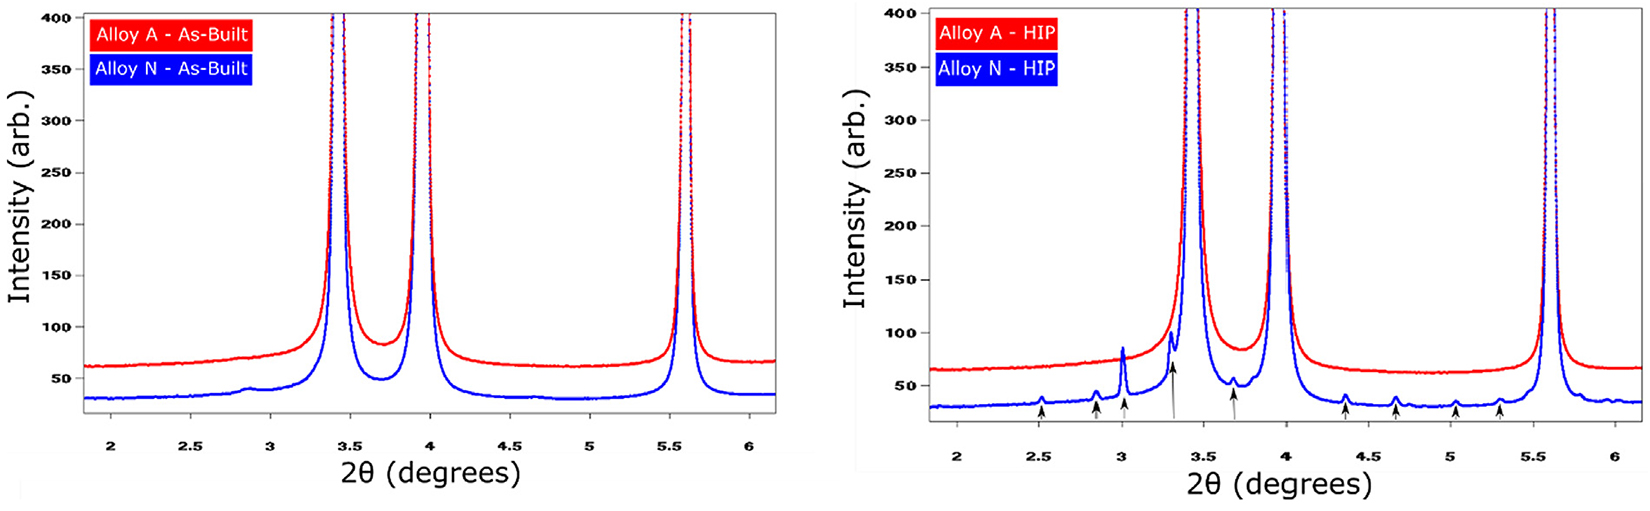
The general microstructures in the as-built condition, shown in Figure 1a and 1b, exhibit elongated grains oriented parallel to the build direction, having an overall (1 0 0) texture-oriented parallel to the build direction. At the same time, grains with an apparent random orientation could be seen. Grains analysis, see Figure S1 in the supplementary material, shows the grains in the two alloys had a similar size distribution and were limited in length to a maximum of a few 100 µm. For both alloys, the grains were comprised of a sub-structure revealing the dendritic growth of the γ-Ni phase, see Figure 1c. Depending on the orientation of the grains, this substructure can appear either cellular or columnar for grains oriented either perpendicular to or parallel to the prepared sample surface. Segregation of larger elements towards the interdendritic regions, as well as evenly distributed oxide inclusions can clearly be seen in high resolution SEM-BSD image shown in Figure 1d. WAXS measurements on materials in the as-built condition showed no evidence for Laves phase for either of the two alloys, only peaks corresponding to the γ phase could be found, see Figure 2. In summary, no distinguishable differences could be found when comparing alloy A and N with regards to texture, segregation, or precipitates in the as-built condition. This is quite remarkable as chemical analysis using melt extraction reveal, as expected, that there was a considerably larger amount of nitrogen in alloy N compared with alloy A.
3.1.2 HIP condition
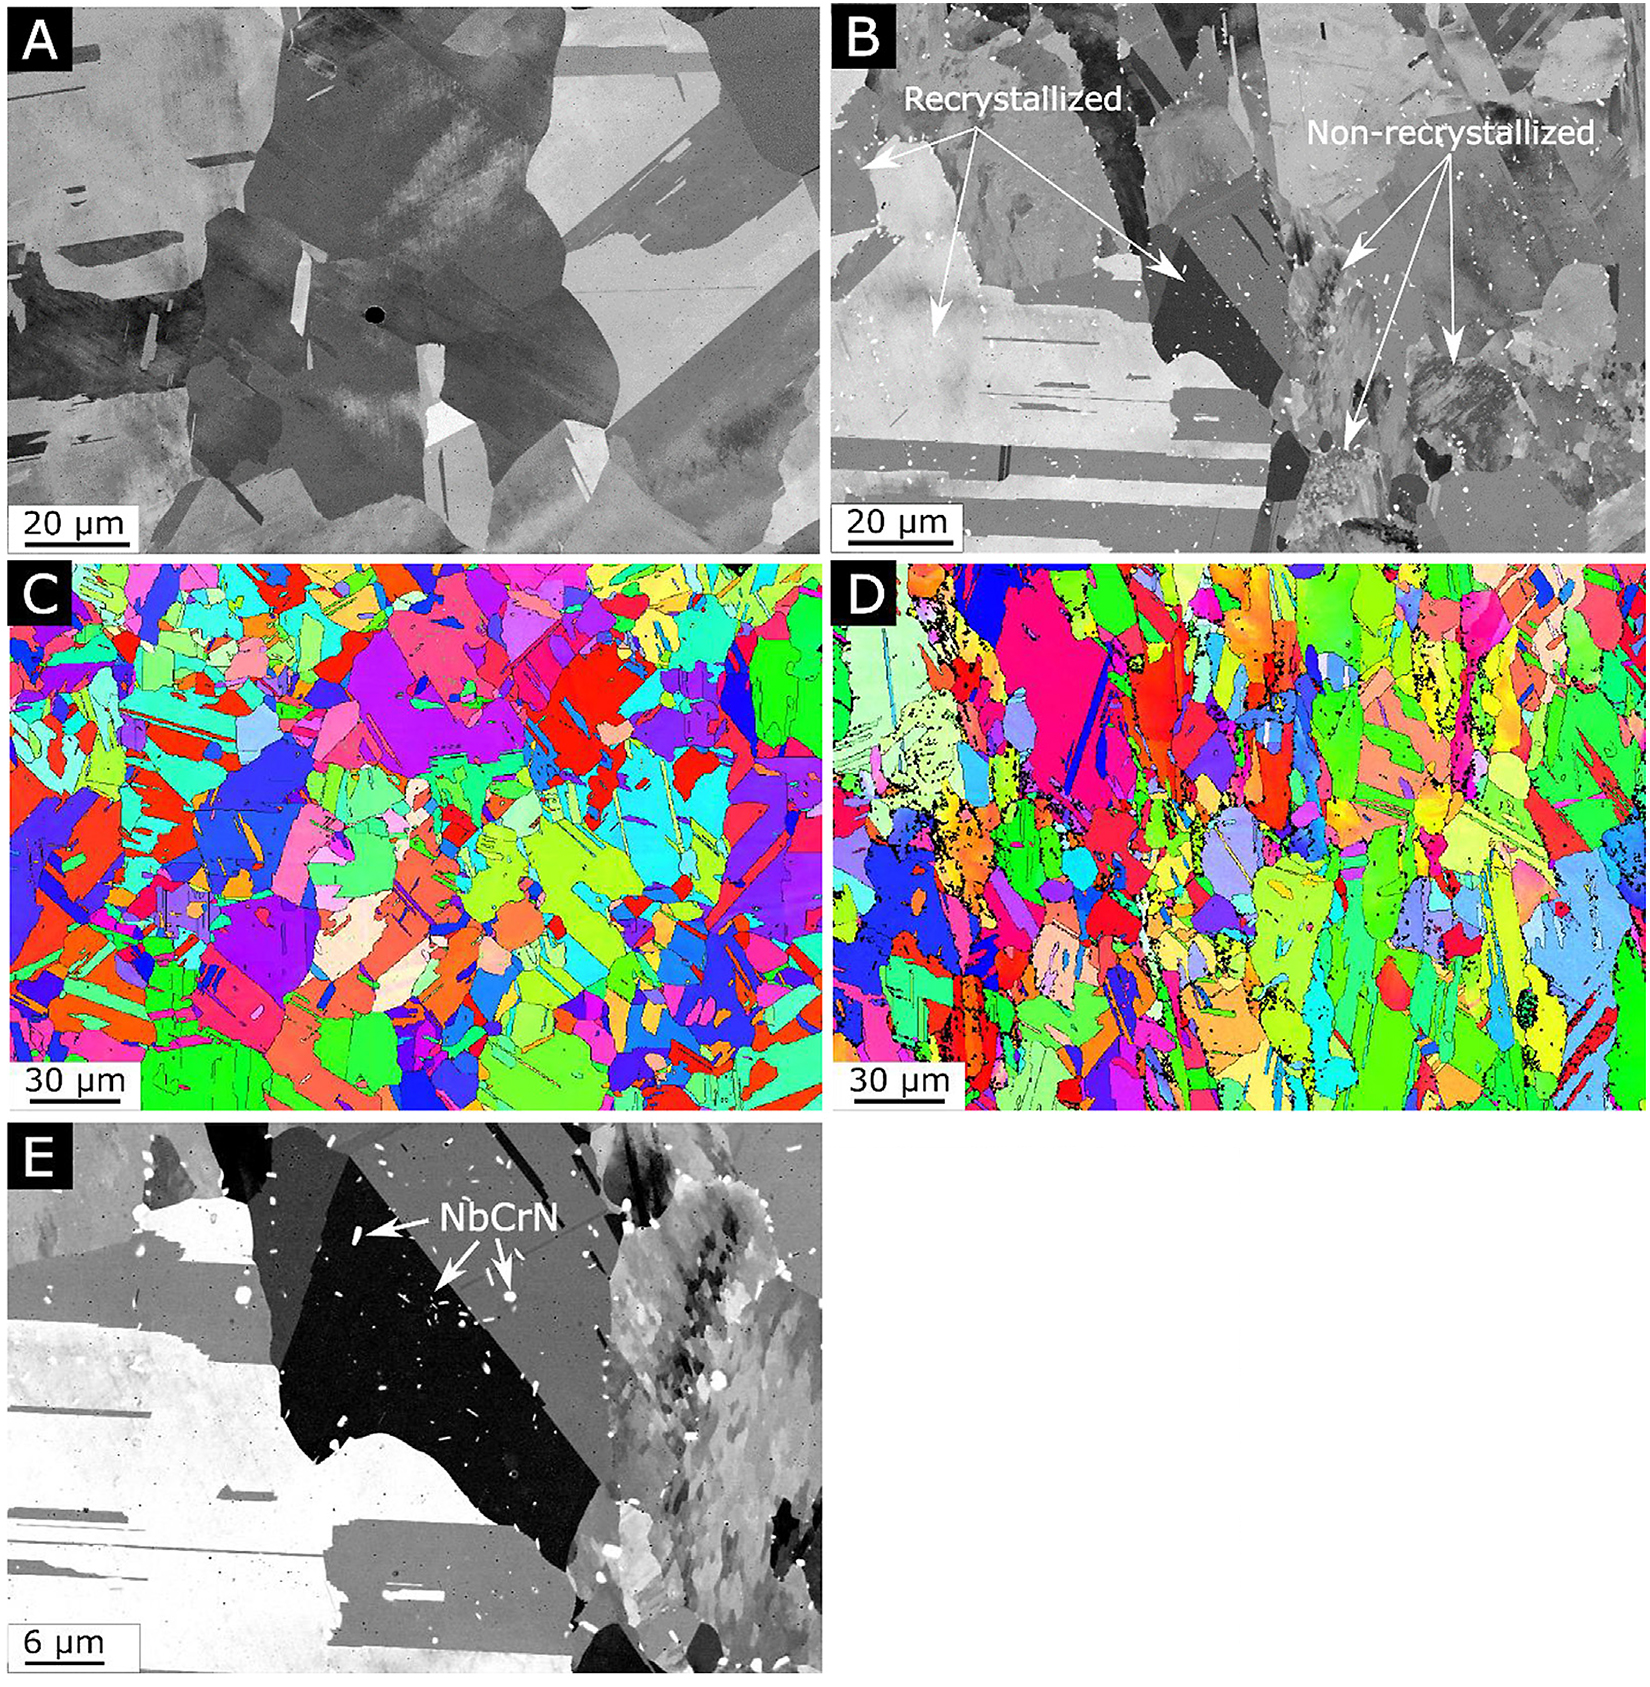
As can be seen in Figure 3, after the HIP heat treatment, a dramatic change in the microstructure can be seen. For alloy A shown in Figure 3a and c, the columnar grains seen in the as-built condition have undergone recrystallization, resulting in a microstructure with larger and more equiaxed grains and a substantial amount of twinning, and there are no precipitates present apart from the oxide inclusions previously observed in the as-built condition which are still in the sub-micron range and uniformly distributed within the grains. Furthermore, the recrystallized grains no longer exhibit the same cellular substructure as seen in grains in the as-built condition. When comparing alloy A with N in the HIP condition, again, a similar grain size distribution can be seen, see Figure S2 in
the supplementary material. However, while all grains in alloy A have undergone complete recrystallization, some of the grain in alloy N appears to not have undergone such recrystallization pro-cess. As can be seen in Figure 3b and 3d, there are grains that appear to still display an elongated appearance with clear signs of a cellular substructure. Although, the morphology of these non-recrystallized grains is similar to grains seen in the as-built condition, they too appear to have been affected by the heat treatment to some extent. Also present in alloy N are unevenly distributed precipitates, clearly seen in Figure 3e. These precipitates are found in the grain boundaries of grains that have not undergone recrystallization or within grains that have undergone recrystallization. The distribution of precipitates within the recrystallized grains seems to indicate previous grain boundaries, i.e. grain boundaries that were present in the as-built condition prior to recrystallization. The precipitates were identified as NbCrN using WAXS and EDS data, see Figure 2, Figure 3.
3.2 Mechanical properties
3.2.1 Tensile and impact testing
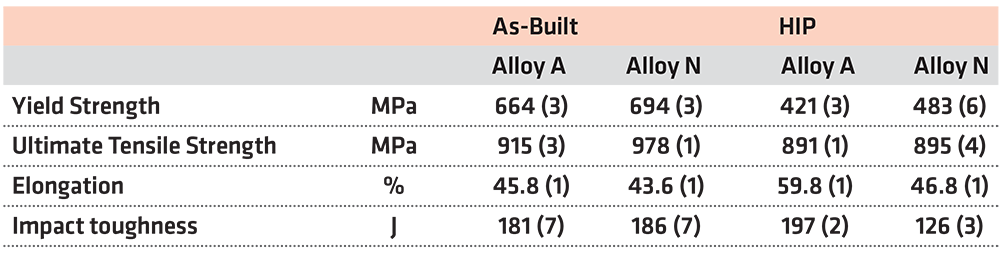
Results from tensile tests shown in Figure 4 and Table 2 reveal there is a noticeable reduction of the yield stress after HIP heat treatment for both alloys. When comparing samples produced using alloy A and N with respect to material condition, a significant difference in yield stress can be seen. Both in the as-built and in the HIP condition, a higher yield stress was noted for alloy N samples. For both alloys, the HIP heat treatment had limited effect on the ultimate tensile strength. While the ultimate tensile strength was higher for alloy N in the as-built condition compared to that of alloy A, no difference in ultimate tensile strength could be noted between A and N after the HIP heat treatment. The elongation to failure was almost indistinguishable between alloy A and N in the as-built condition. However, after HIP, the elongation to failure increased considerably for alloy A while alloy N remained unaffected.
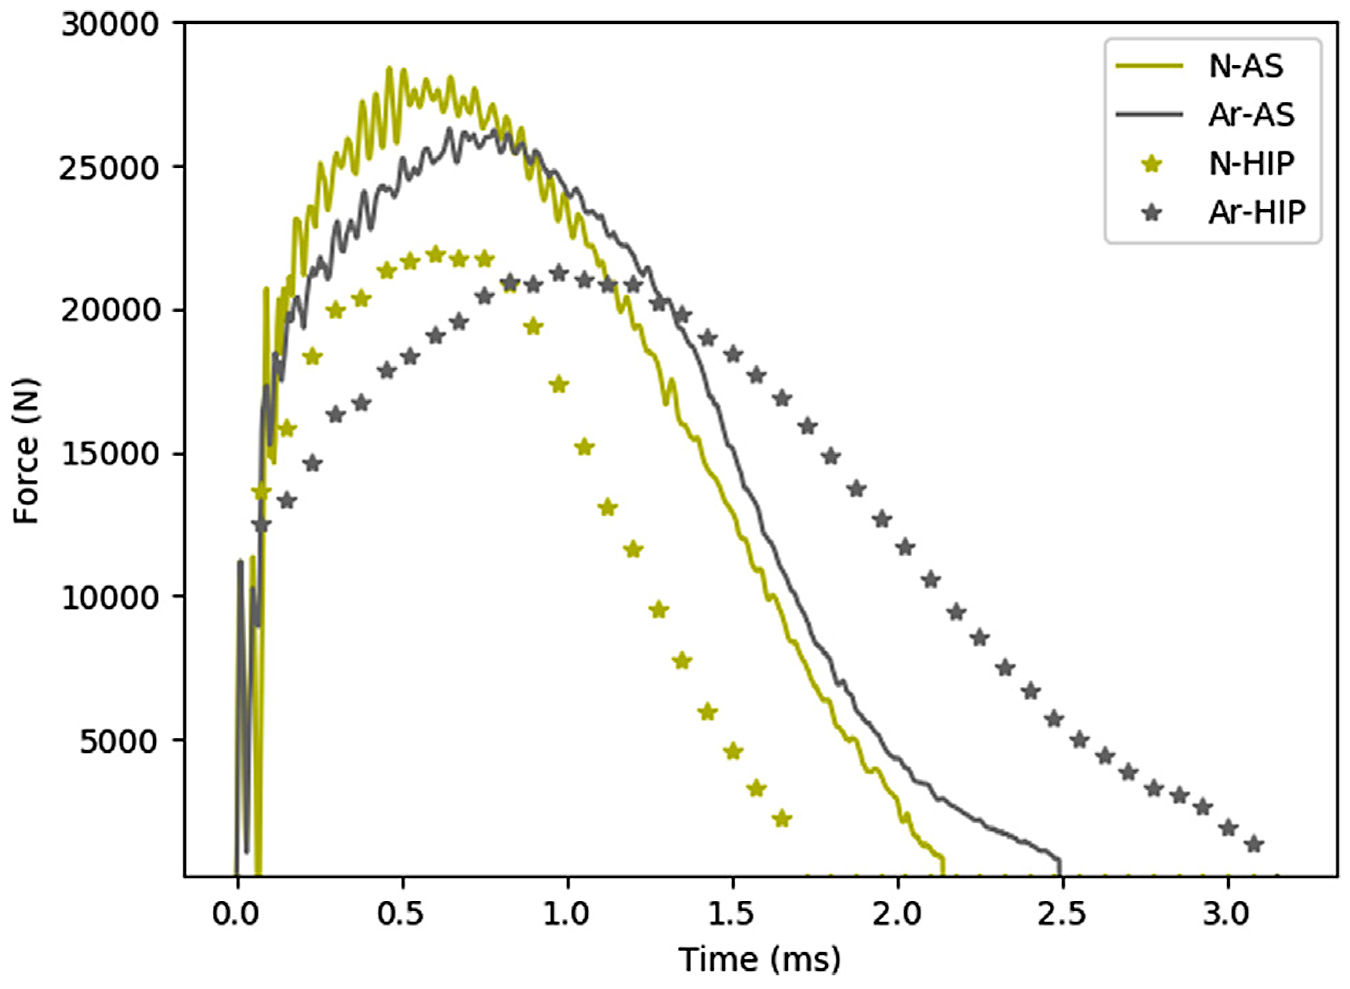
When analyzing the impact results, no significant differences between the alloys in the as-built condition could be observed, see Figure 4d. To evaluate impact results more extensively, the force-time curves for the respective samples were compared with one another, see Figure 5. When analyzing the impact-toughness results in this way, the similarities between alloy A and N in the as-built condition were evident. However, after HIP heat treatment, a significantly larger amount of absorbed energy could be noted for alloy A when compared with alloy N.

3.2.2 Micro-Vickers and nanoindentation
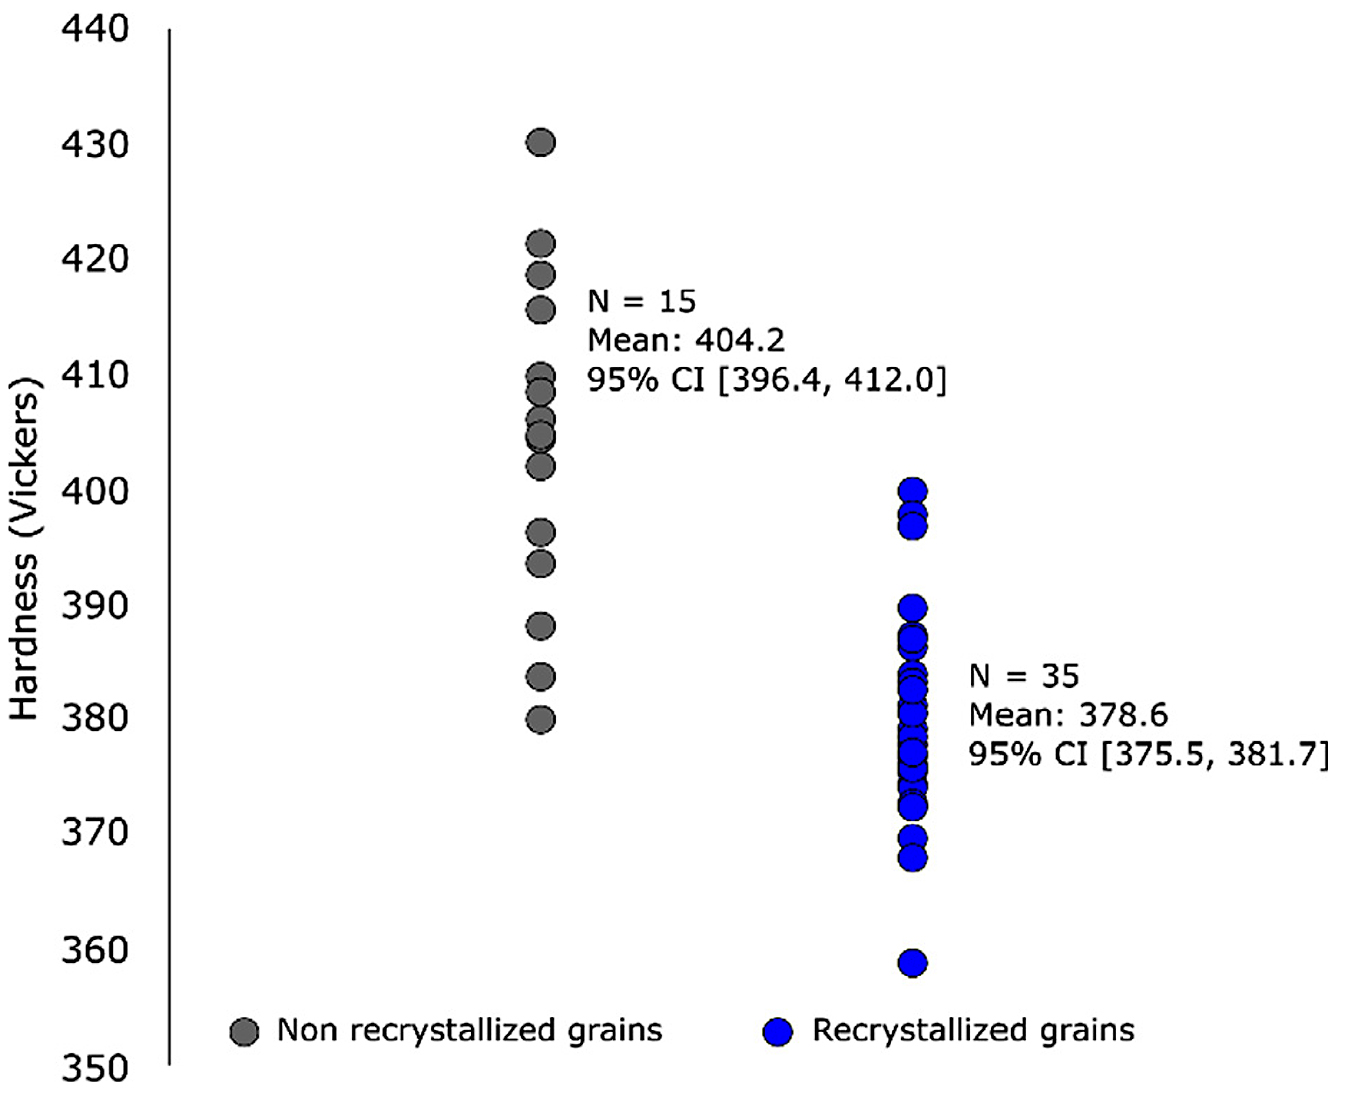
The micro-Vickers hardness values were very similar for Alloy A and N in the as-built condition, and both alloys exhibited a reduced hardness after HIP heat treatment. However, in the HIP condition, a higher hardness could be observed for alloy N than for alloy A. When performing nanoindentation on the samples, see Table 3, the reduction in hardness post HIP was evident for both alloys, while a larger standard deviation was noted for alloy N. When differentiating between indents located within recrystallized and non-recrystallized grains for alloy N, and excluding indents located on, or in the direct vicinity of, precipitates or grain boundaries, a higher hardness was measured for non-recrystallized grains in alloy N, see Figure 6.
3.2.3 Fractographic study
SEM micrographs on fractured surfaces from impact tests display transgranular ductile fractures both in the as-built and HIP condition for both alloys A and N. The appearances of the fractured surfaces are overall similar when comparing alloy A with alloy N in the as-built condition. In the HIP condition, there is no significant difference in appearance of the fractured surface of alloy A. For alloy N, however, there are a significant number of unevenly distributed craters, at the bottom of which precipitates with high Nb content could be found, see Figure 7 and Figure S3 in the supplementary material for EDS map. These precipitates are likely the previously identified NbCrN, as this must be the most frequent precipitate found in alloy N in the HIP condition given the diffraction results shown in Figure 2. Several of the precipitates found in these craters are fractured, and the crater walls are typically covered with dislocation slip lines, indicating a high ductility of the surrounding matrix.

3.3 Corrosion
After immersion of the samples in the 0.5 M H2SO4 electrolyte for 60 minutes, the OCP values for all samples showed similar trends. At first, the OCP dropped after about 100 seconds, after which they tended to remain relatively stable without significant fluctuations. Only the sample produced using Alloy N in the as-built condition showed some fluctuations during the OCP measurements. During the last 1,000 seconds of the process, however, the OCP value became stable also for the Alloy N samples in the as-built condition, indicating a re-passivation of the surface. The OCP plots are included in the supplementary material, see Figure S4, while the attained OCP values after 60 minutes are presented in Table 4. The EIS data, measured under OCP, including Nyquist plots, see Figure S5a, feature straight lines close to the imaginary axis, while in the Bode phase plot, see Figure S5b, the phase angle was between 79.6 degrees to 80.5 degrees at the lowest frequency value (100 mHz).

The polarization curves, see Figure 8, differed between the two experimental approaches but showed no significant difference between samples tested using the same experimental conditions. For the first approach shown in Figure 8a, where any native oxides were still present, all samples displayed a corrosion current of about 4.5·10-8 A/cm2 at a corrosion potential of −0.03 V vs. Ag/AgCl, after which a current increase was observed when the potential became more positive than that. For the second approach, where native oxides were first reduced, the current value was about three orders of magnitude higher for all samples while the corrosion potential was about −0.2 V vs. Ag/AgCl, see Figure 8b.
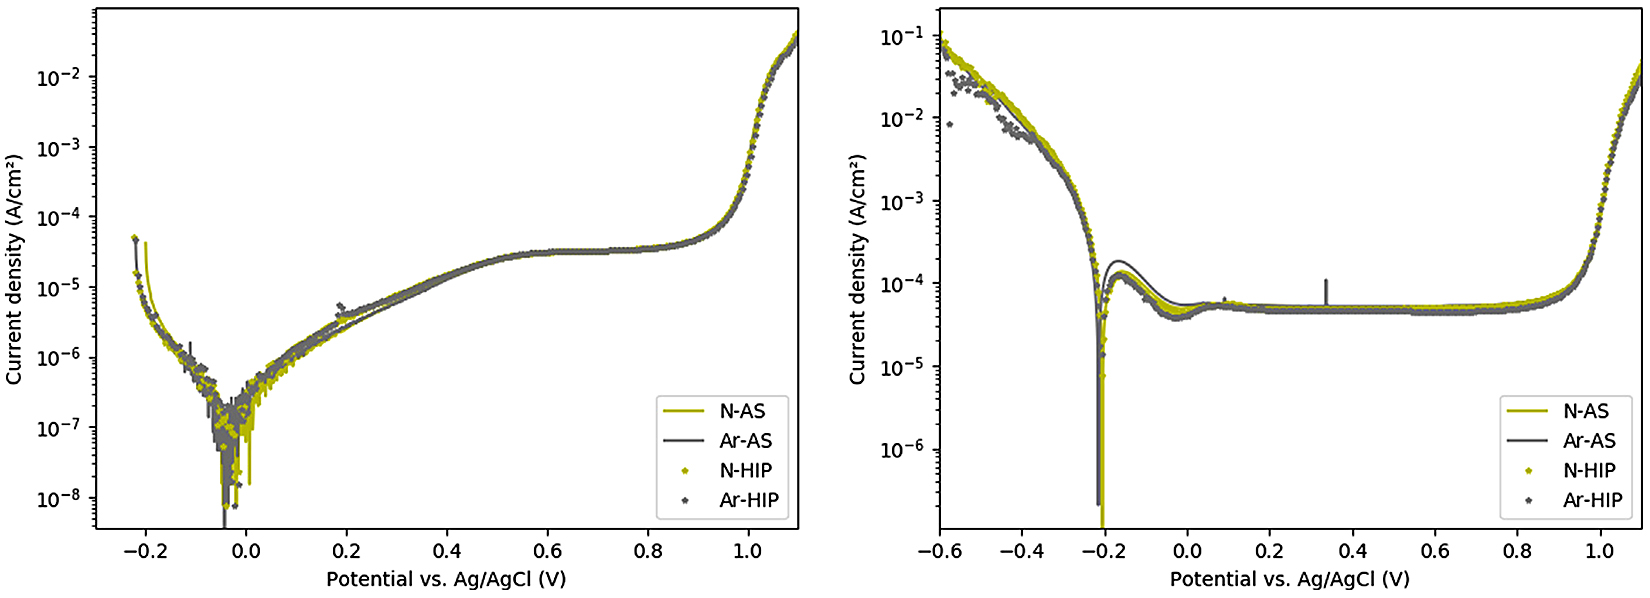
For the first approach, a passive region with a stable plateau ranging from 0.55 V to 0.9 V vs. Ag/AgCl was observed for all samples, having a current of 1·10-5 A/cm2, see Figure 8a. For the second approach, a similar plateau with currents at about 1·10-5 A/cm2 was observed for all samples, ranging from −0.16 V to 0.9 V vs. Ag/AgCl, see in Figure 8b. Both experimental conditions resulted in a shift from the passive to the transpassive region at about 0.9 V vs. Ag/AgCl.
SEM investigations of the corroded surfaces, representative images are shown in Figure 9, revealed for both alloy A and N, the typical cellular substructure of PBF-LB produced material in the as-built condition. The interdendritic regions, which are rich in Nb, see EDS mapping in Figure S6, appear bright and are indicated by an arrow in Figure 9a. For alloy N in the HIP condition, Nb-rich precipitates are visible on the corroded surface, very likely in the same areas were the NbCrN precipitates were seen. These too appear bright in contrast as indicated by arrows. Both Nb-rich precipitates and interdendritic regions in samples in the as-built condition protrude above other areas of the surface where corrosion had been more pronounced.

4 Discussion
4.1 Microstructure
4.1.1 Nitrogen
Even though the PBF-LB process is conducted in a protective argon atmosphere, there are still some presence of atmospheric gases i.e., oxygen and nitrogen, during the process. In the EOS M100 system, the process starts once the oxygen level is below 0.12%, and the value then quickly falls below 0.05% once the process starts. Although there is no nitrogen sensor in the system, given the fact that there is roughly 3.7 times more nitrogen than oxygen in air, one can predict the level of nitrogen in the build chamber is close to 0.5% at the beginning of the process. In other words, nitrogen pick up is plausible during the printing process. When comparing the nitrogen content of the powders after atomization with the nitrogen content after printing in the as-built condition, see Figure 10 and Table 1, an increase of nitrogen can indeed be seen for alloy A. For alloy N however, a reduction of nitrogen was noted. This is most likely the result of nitrogen release during the melting of the powder. This would imply alloy N was supersaturated in nitrogen after the atomization process. Nevertheless, the reduction of nitrogen in alloy N is small compared to the overall difference in nitrogen content when comparing alloy A with N.
4.1.2 As-built microstructure
Both in the as-built and in the HIP conditions, oxide inclusions can clearly be seen uniformly distributed throughout the material for both alloys, see Figure 1d. The size and distribution of these inclusions are seemingly unaffected by the heat treatment. Furthermore, as these precipitates are in the same size range as those known to be present in the pre-alloyed powders[17], [18], [19], it is concluded that the PBF-LB process had no direct effect on these oxide inclusion. Given this, no drastic effect on other types of primary precipitates, having a similarly high melting point is expected. One such type of primary precipitates is nitrides. In Alloy 625, titanium nitride (TiN) is of particular concern. Precipitation of TiN most likely occurs in both alloys in this study, but it is limited by the amount of titanium and nitrogen available in the two alloys. For alloy A, precipitation of TiN is limited by the low availability of nitrogen, while in alloy N, it is limited by the low availability of titanium. In this work, no presence of TiN could be confirmed when using SEM and WAXS for any material condition. This implies the amount of TiN present in either alloy is well below the detection limit for the utilized techniques, hence the tailoring of alloy N, as described earlier, was successful in limiting precipitation of primary nitrides.
Given the discussion above, only alloy A is expected to have free titanium present during the final stages of solidification in the PBF-LB process. Generally, for Alloy 625, titanium is added for its ability to participate in carbide formation and hence limit the amount of free carbon. If instead the titanium is allowed to form TiN precipitates, early onset of grain boundary precipitation of secondary M23C6 carbides during operating temperatures has been reported [20]. This is because as TiN precipitates, the available titanium in the alloy is reduced and limits the formation of titanium carbide. From this follows that more carbon will be left free in the material that may react with other elements such as Nb to form less stable carbides. In alloy N, the lack of free titanium could result in an excessive amount of secondary carbide formation, possibly also during use at high operational temperatures. Although not within the scope of the current work, the possible effect of the latter is addressed in the last section of this work.
Another important result is the excess of nitrogen that must be present in alloy N in the as-built condition i.e., nitrogen, which has not participated in the formation of primary nitrides. As there are no obvious primary nitride formers apart from titanium in the alloy, much of the remaining nitrogen must be dissolved into the solidified material. This excess nitrogen, given the solubility of nitrogen in Ni-based alloys, must be concentrated to grain boundaries [21].
4.1.3 Effects of the HIP heat treatment
After the HIP cycle used in this work, the microstructure changed dramatically compared to the as-built condition. For alloy A, complete recrystallization can be seen with a total absence of the cellular substructure seen in the as-built condition. For alloy N however, recrystallization has occurred, but there are still many grains present that exhibit the cellular substructure. Such grains are hence denoted as non-recrystallized grains, although they, too, have been affected by the heat treatment. This is evident since the interdendritic regions are much less defined than in the as-built condition as can be seen when comparing Figure 1c with Figure 3e. Also, a significantly lower hardness was measured for these grains compared to their as-built equivalents, see Figure 6 and Table 3.
Another major differentiating feature is that only alloy N in the HIP condition has the presence of 0.5–1.0 µm NbCrN precipitates; these are known as z-phase. Presence of z-phase is commonly observed in high Cr martensitic steels but scarcely reported for Alloy 625. As these z-phase precipitates are observed in either grain boundaries or within recrystallized grains, they must have been formed in grain boundaries already present in the as-built condition before any substantial recrystallization had taken place. This corresponds well with the increased amount of nitrogen in the grain boundaries described in the previous section. Most likely, the presence of these precipitates obstructed the recrystallization process, hindering a complete recrystallization of alloy N.
The purpose of the HIP cycle used in this work was to close any remaining porosity in the PBF-LB produced samples while at the same time homogenizing the material. However, it should be noted other heat treatments, with or without pressure assistance, could be used to affect the microstructure in different ways, but this is left open for future studies.
4.2 Influence of microstructure on mechanical properties
The microstructural similarities and differences reported above are reflected in the mechanical properties of the alloys. In the as-built condition, the microstructures of the two alloys are virtually impossible to distinguish from one another. Consequently, no significant differences were found in tensile, impact, hardness, or corrosion measurements.
The HIP heat treatment strongly affects the microstructures of both alloys, and differences in mechanical properties emerged. More specifically, a reduction in yield stress and hardness was found for both alloys after HIP heat treatment, shown in Figure 4 and Table 3 respectively. These results, combined with the microstructural investigation, make it possible to conclude the decrease in hardness and yield stress is attributed to the recrystallization and grain growth in alloy A and a combination of recrystallization, grain growth, and recovery via dislocation annihilation processes in alloy N.
The grains in alloy N in the HIP condition, which have only undergone recovery, display a higher hardness compared to fully recrystallized grains, see Figure 6. The maintained hardness of these non-recrystallized grains likely contributes to the larger yield stresses measured for alloy N in the HIP condition while also the presence of z-phase precipitates contributed.
The difference in the amount of recrystallization in alloy A and N, and the presence of z-phase precipitates in alloy N is also the reason for the much lower increase in elongation to failure observed for alloy N post HIP compared to alloy A. A similar increase in elongation to failure is not observed for alloy N for two reasons. Firstly, unlike alloy A, alloy N has not achieved complete recrystallization, which results in a less ductile material. Secondly, the presence of z-phase precipitates inhibits plastic deformation, i.e. limits dislocation motion, resulting in an elongation to failure like that seen in the as-built condition. Surprisingly, despite the significant differences in microstructure before and after HIP heat treatment, no significant impact on the ultimate tensile strength was noted for the alloys. Hence the precipitation of z-phase in alloy N could not be correlated to any major change in the overall strength of the material.
However, results indicate that the z-phase precipitates significantly affected impact-toughness test results. While both alloys displayed an overall ductile fracture in both material conditions, the presence of z-phase precipitates in the HIP condition for alloy N allowed the formation of voids in the material. The formation of these voids reduced the ductility of the material, caused a decreased impact toughness and distinct craters on the fractured surfaces, see Figure 7b.
4.3 Corrosion
The results from the OCP measurements showed both alloys A and N in as-built and HIP conditions were able to reach similar OCP values after 60 minutes of immersion in the electrolyte. In general, the OCP is considered as a mixed potential, resulting from anodic and cathodic reactions, which are affected by any passive layer present on a sample surface. Hence, the stable OCP values measured indicate that surface passivation was possible for all samples. Also, the EIS results, see Figure S5a and S5b, indicate the corrosion resistances were very similar for all samples under OCP conditions. The passive layers formed on the sample surfaces resulted in an almost straight line in the Nyquist plots, indicating a “capacitance’’-like behavior, which is typically seen for corrosion-resistant materials. Moreover, the phase angle values in the Bode phase diagram range between 79.6 degrees to 80.5 degrees for the tested samples. These values are close to the 90 degrees seen for an ideal capacitive behavior, which confirms that the occurrence of corrosion reactions in the studied corrosive environment are limited.
The results from the polarization curves clearly show the used experimental approaches, i.e. different starting potentials, affect the shape of the polarization curves. However, no significant difference was seen among samples tested using the same starting potential. The distinctly different polarization curves attained for the two experimental approaches can be explained by the fact the native passive layer was not completely reduced in the first approach, as the starting potential was not sufficiently negative. According to thermodynamic data presented in the supplementary information, starting a polarization curve from −0.2 V vs. OCP, i.e. about −0.2 V vs Ag/AgCl, means the native oxide layer should not have been fully reduced prior to recording of the polarization curve. However, when applying a sufficiently negative potential on the samples, as in the second experimental approach, a large portion of the native oxides should have been removed. As the corrosion potential represents the potential where the rate of the anodic and cathodic reactions become equal, its value depends on how fast a passive layer can be reformed during a potential scan.
By employing the two different experimental approaches and the fact the corrosion current density was very similar for all samples tested with the same experimental conditions, it has been shown, using the first approach, that the native oxide layers on the sample’s surfaces perform equally well, indicating corrosion resistant materials. Regarding the second approach, the similar corrosion behavior seen for all samples testify for a similar ability for all samples to reform the passivating layers on their surfaces.
5 Conclusions and future outlooks
This study investigates the possibility of using nitrogen instead of argon during atomization of Alloy 625 powders intended for the PBF-LB process. This would be environmentally beneficial. But for this, the 625 alloy must be tailored (alloy N) to limit deleterious effects stemming from the use of nitrogen gas. The resulting material properties attained after the PBF-LB when using nitrogen gas atomized powders were compared to those of a more common alloy composition atomized using argon gas (alloy A).
The two alloys Alloy A and N were virtually indistinguishable from one another both in terms of microstructure and corrosive properties when evaluated in the as-built condition. Also, their mechanical properties were similar, with Alloy A having only marginally higher elongation to failure than Alloy N. This makes alloy N a promising candidate for manufacturing using PBF-LB.
After HIP heat treatment, complete recrystallization was seen for alloy A. Alloy N showed only partial recrystallization and presence of z-phase precipitates. As z-phase precipitates were found in grain boundaries of non-recrystallized grains, and within fully recrystallized grains, it is concluded they precipitate early during the HIP cycle in the grain boundaries of the as-built material where nitrogen content is high. Their presence then hinders the complete recrystallization of the Alloy N.
Both alloys exhibited a decrease in hardness and yield stress after the HIP cycle. This is attributed to the recrystallization and grain growth in alloy A and a combination of recrystallization, grain growth and recovery in alloy N.
After HIP, the elongation to failure was increased for alloy A thanks to complete recrystallization of the material. For Alloy N, where recrystallization was limited due to z-phase precipitates, no change was seen.
In impact testing, z-phase precipitates in Alloy N contributed to a lower impact toughness.
Irrespectively of material condition, no difference between the two alloys could be noted in their corrosion resistance in 0.5 M H2SO4. Hence, the passivating performance of the native oxides is equally good for alloy both A and N and there is no difference in their ability to passivate their surfaces.
6 Final remarks
Although Alloy A outperformed Alloy N with regards to ductility after HIP, it should be noted the performance of Alloy N is still within specification. Furthermore, by adjusting the nitrogen content and by optimizing the heat treatment after the PBF-LB process, the presence and amount of z-phase should be possible to control. Such further development is motivated by environmental benefits that can be achieved.
It should also be noted the presence of z-phase precipitates also can affect other material properties. Although outside the scope of the current work, it is plausible the presence of z-phase in the grain boundaries of alloy N could limit grain-boundary sliding at elevated temperatures, which would imply an increased creep resistance. Yet another plausible effect from the presence of z-phase precipitates is reduced resistance to fatigue, due to their incoherency to the surrounding matrix and its brittle nature. Lastly, the impact of free carbon in Alloy N and the possibility of secondary carbide formation during use at high operating temperature should be addressed.
Declaration of Competing Interest
The authors declare that they have no known competing financial interests or personal relationships that could have appeared to influence the work reported in this article.
Acknowledgment
The authors acknowledge the Swedish Foundation for Strategic Research (SSF) project GMT14-048 (Additive Manufacturing – Development of Process and Materials). Funding from the Swedish Research Council, grant 2016-05460, is also gratefully acknowledged. Sandvik Additive Manufacturing are also recognized for commitment and supply of powder material.
Data availability
The raw data required to reproduce these findings cannot be shared at this time due to technical or time limitations. The processed data required to reproduce these findings cannot be shared at this time due to technical or time limitations.
Appendix A. Supplementary data
Supplementary data to this article can be found online at https://doi.org/10.1016/j.matdes.2022.110928.
References
- R.C. Reed, “The physical metallurgy of nickel and its alloys,” The Superalloys 33–120 (2017), https://doi.org/10.1063/1.1745806.
- C. Broeckmann, “Hot isostatic pressing of near net shape components – Process fundamentals and future challenges,” Powder Metall. 55 (3) (2012) 176–179.
- J. Nguejio, F. Szmytka, S. Hallais, A. Tanguy, S. Nardone, M. Godino Martinez, “Comparison of microstructure features and mechanical properties for additive manufactured and wrought nickel alloys 625,” Mater. Sci. Eng. A 764 (2019) 138214.
- M.R. Condruz, G. Matache, A. Paraschiv, T.F. Frigioescu, T. Badea, “Microstructural and tensile properties anisotropy of selective laser melting manufactured in 625,” Materials (Basel). 13 (2020) 1–22.
- K. Kunze, T. Etter, J. Grässlin, V. Shklover, “Texture, anisotropy in microstructure and mechanical properties of IN738LC alloy processed by selective laser melting (SLM),” Mater. Sci. Eng. A 620 (2015) 213–222.
- V.A. Popovich et al., “Functionally graded Inconel 718 processed by additive manufacturing: Crystallographic texture, anisotropy of microstructure and mechanical properties,” Mater. Des. 114 (2017) 441–449.
- B. Farhang, B.B. Ravichander, F. Venturi, A. Amerinatanzi, N. Shayesteh Moghaddam, “Study on variations of microstructure and metallurgical properties in various heat-affected zones of SLM fabricated Nickel-Titanium alloy,” Mater. Sci. Eng. A 774 (2020) 138919.
- R. Kiesslin, Encyclopedia of Materials – Science and Technology, (Elsevier Ltd (2011), https://doi.org/10.1016/B0-08-043152-6/01114-1.
- J. Emsley, “Nature´ s building blocks: AN A-Z guide to the elements,” Oxford University Press, 2001.
- M. Dopler, C. Weiß, “Energy Consumption in Metal Powder Production Energieverbrauch bei der Metallpulverherstellung Energieverbrauch bei der Metallpulverherstellung,“ BHM Berg- und Hüttenm.nnische Monatshefte 166 (1) (2021) 2–8.
- Chen, Z. “Surface Integrity and Fatigue Performance of Nickel-based Superalloys,” Zhe Chen. (2017).
- S. Floreen, G.E. Fuchs, W. Yang, J. “The Metallurgy of Alloy 625” (1994) 13–37.
- A. Sergi, R.H.U. Khan, M.M. Attallah, “The role of powder atomisation route on the microstructure and mechanical properties of hot isostatically pressed Inconel 625,” Mater. Sci. Eng. A 808 (2021) 140950.
- F.J. Rizzo, “Nitrogen-Atomized, Nickle-Based, Corrosion-resistant Alloys.” JOM 48 (1996) 24–27.
- F. Schmeiser, “In situ microstructure analysis of Inconel 625 during laser powder bed fusion,” J. Mater. Sci. 57 (2022) 9663–9677.
- EOS GmbH. EOS M100 Metal 3D Printer. https://www.eos.info/en/additivemanufacturing/3d-printing-metal/eos-metal-systems/eos-m-100.
- F. Yan, W. Xiong, E. Faierson, G.B. Olson, “Characterization of nano-scale oxides in austenitic stainless steel processed by powder bed fusion,” Scr. Mater. 155 (2018) 104–108.
- T. Debroy et al., “Progress in Materials Science Additive manufacturing of metallic components – Process, structure and properties.” 92 (2018) 112–224.
- S. Irukuvarghula, H. Hassanin, C. Cayron, M. Aristizabal, M.M. Attallah, “Effect of powder characteristics and oxygen content on modifications to the microstructural topology during hot isostatic pressing of an austenitic steel,” Acta Mater. 172 (2019) 6–17.
- J.B. Singh, A. Verma, B. Paul, J.K. Chakravartty, “Failure of Alloy 625 tube stub ends – Effect of primary nitrides,” Eng. Fail. Anal. 32 (2013) 236–247.
- M.J. Cieslak, Weld J. 70 (1991) 49.
About the authors
C.J. Hassila and U. Wiklund are with Applied Material Science, Department Material Sciences, Uppsala University, Sweden. M. Paschalidou is with Inorganic Chemistry, Department of Chemistry, Uppsala University, Sweden. P. Harlin is with Sandvik Additive Manufacturing, Sandviken, Sweden.
© 2022 The Authors. Published by Elsevier Ltd. This is an open access article (https://doi.org/10.1016/j.matdes.2022.110928) distributed under the terms of the Creative Commons Attribution License 4.0 (http://creativecommons.org/licenses/by/4.0/). It has been edited to conform to the style of Thermal Processing magazine.


 general practice for CQI-9 and AMS2750E")


