


Modern quenching oils offer a wide range of capability and performance. The selection of the proper quench oil is critical for proper heat-treating operations. The quenchant selected must provide consistent quenching the first time, as well as over the life of the quenchant. Improper selection of quench oil can result in short oil life, or soft parts. Improper maintenance of the quench oil can result in stained parts. This paper will illustrate the selection factors in choosing a quench oil to ensure proper quality parts.
Introduction
It is not known how long oils have been used in the hardening of ferrous alloys. Many types of oils have been used, including vegetable, fish, and animal oils, and, in particular, sperm whale oil have been used for quenching operations [1]. The first petroleum-based quenching oils were developed around 1880 by E.F. Houghton in Philadelphia. Since thatt time, many advancements have been made in the development of quenching oils to provide highly specialized products for specific applications.
A wide range of quenching characteristics can be obtained through careful formulation and blending. High quality quenching oils are formulated from refined base stocks of high thermal stability. Selected wetting agents and accelerators are added to achieve specific quenching characteristics. The addition of complex anti-oxidant packages is included to maintain performance for long periods of continued use — particularly at elevated temperatures. Emulsifiers may be added to enable easy cleaning after quenching.
Methods of Quench Oil Selection
The steel composition, component section thickness, and the type of quenchant all have a major influence on the properties obtained in the heat-treated condition. The selection of quench oil is dependent on the part, type of furnace, and cost.
The part requirements are critical. The alloy must be considered to achieve the proper hardness and required mechanical properties. Geometry and section size are influenced by the hardenability of the alloy. This limits the section size for through hardening. The geometry of the part also influences the residual stress state and distortion. Non-uniform section sizes, sharp radii, and complex shapes can contribute to distortion and potential part cracking. The oil must be chosen, as well as the method of fixturing, to minimize the potential of distortion and quench cracking.
The furnace also influences the choice of quenchant. If the agitation in the quench tank is poor, then fast oil must be chosen. If the part is prone to distortion, then the furnace and quench tank must be capable of heating the oil to the proper temperature for mar-tempering.
If the part is press-quenched, then an oil must be chosen that is tolerant of the presence of the inevitable infiltration of hydraulic fluid. It also should provide some lubricity to prevent excessive wear to the quench die fixtures. It also should have an excellent anti-oxidant package to provide repeatable quenching of high surface volumes with limited quenchant volumes.
The cost of the quenchant is also important. Unfortunately, this is often the only variable considered. The initial cost and in-use costs, as well as the final end-of-life costs of disposal and environmental cost must be considered.
The initial costs are influenced by the quality of the base oil stock chosen and the quality and robustness of the additive package. The additive package consists of speed improvers and anti-oxidants. The quality of the anti-oxidant package also influences the in-use cost.
The in-use cost is influenced by the maintenance costs associated with the quench oil. The cost of testing to ensure repeatable testing must be considered. Other maintenance costs such as filtering should be included in the calculation. The cost of additive packages (usually not required by quality quench oils) added to the quench tank as the quench oil ages is not usually added to the cost calculations because this usually falls under the maintenance budget. However, it should be added to understand the total cost of the quench oil selected.
One additional factor not usually included is the cost of cleaning the parts. Finally, the oxidative stability of the oil should be considered. If the oil tends to oxidize rapidly, this will increase the cost of cleaning and require replacing the oil more often. This is especially true of oil used in martempering applications.
Consumption of the oil by drag-out should also be considered in the quench-oil calculations. Higher viscosity oil will tend to drag out more, as will high surface area parts. The method of racking parts can cause the retention of higher-than-normal quantities of oil. Attention to racking and proper drain times can reduce consumption.
In general, there are three different situations for the selection of quench oil:
Existing operation wanting a different quench oil because the life of the existing oil has been depleted; dissatisfaction with current supplier; or cost of existing quench oil.
New operation similar to existing process, such as the addition of a new line for increased capacity, or a new facility at a different location processing similar parts.
New operation or new process with new or different configuration parts or parts of a different alloy.
The selection of quench oil can be accomplished by one or more methods: Comparative Cooling Curves; Hardening Power, or by the Grossman H-Value of the quenchant. In each case, not only must the quenching characteristics be considered, but the thermal stability of the oil should be considered.
Comparative Cooling Curves
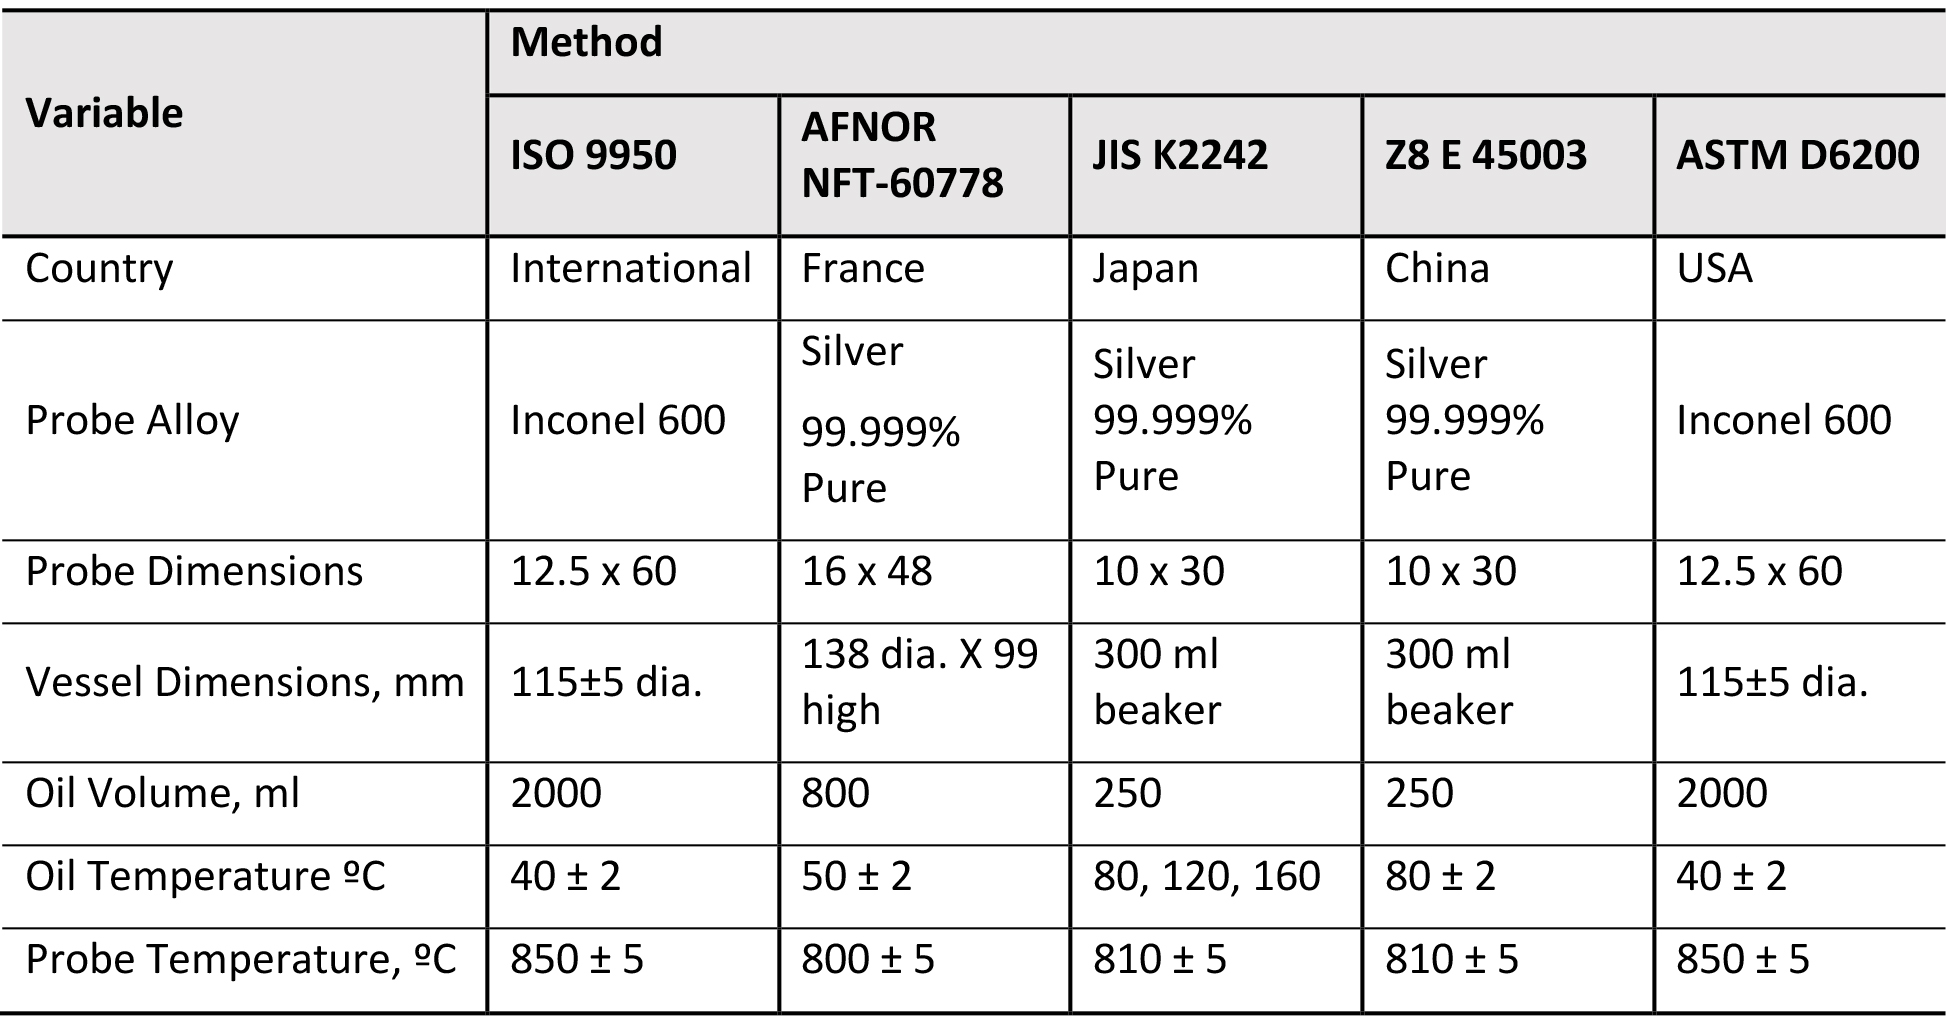
When an existing process requires new oil, the new quenchant must be metallurgically equivalent. This means the cooling curves or the quenching path should be similar. The cooling curve is measured by several different methods described in Table 1 [2]. It should be mentioned that it is very important the same cooling curve methodology be used. Different methods of cooling curve measurements are not directly comparable [3].
When testing oil for comparison purposes, only new oils should be chosen. This is because old oil will show oxidation and appear faster than the new oil. Further, the oil must be tested by the same method and preferably at the same time by the same testing laboratory to eliminate inter-laboratory testing variation.
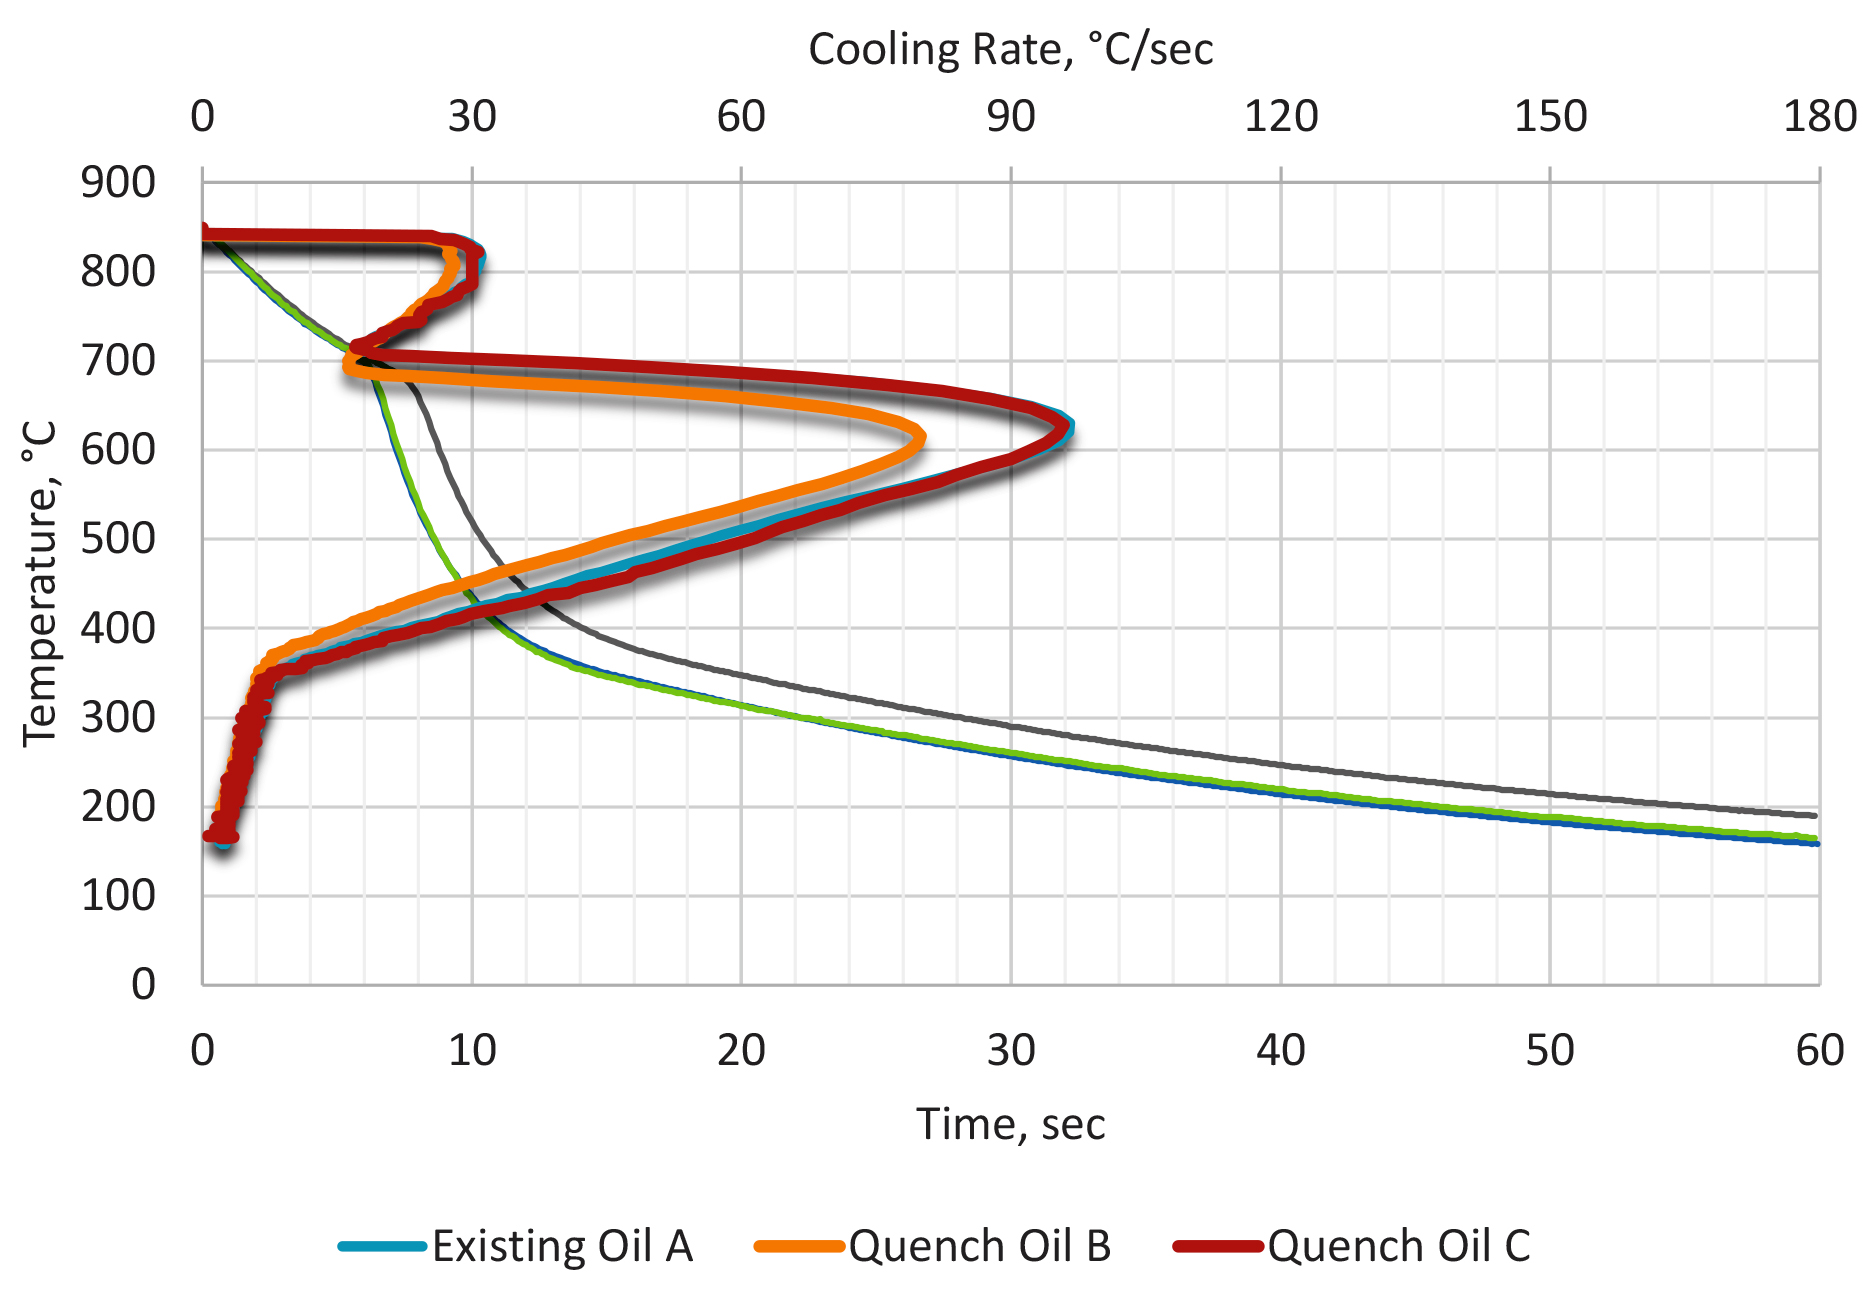
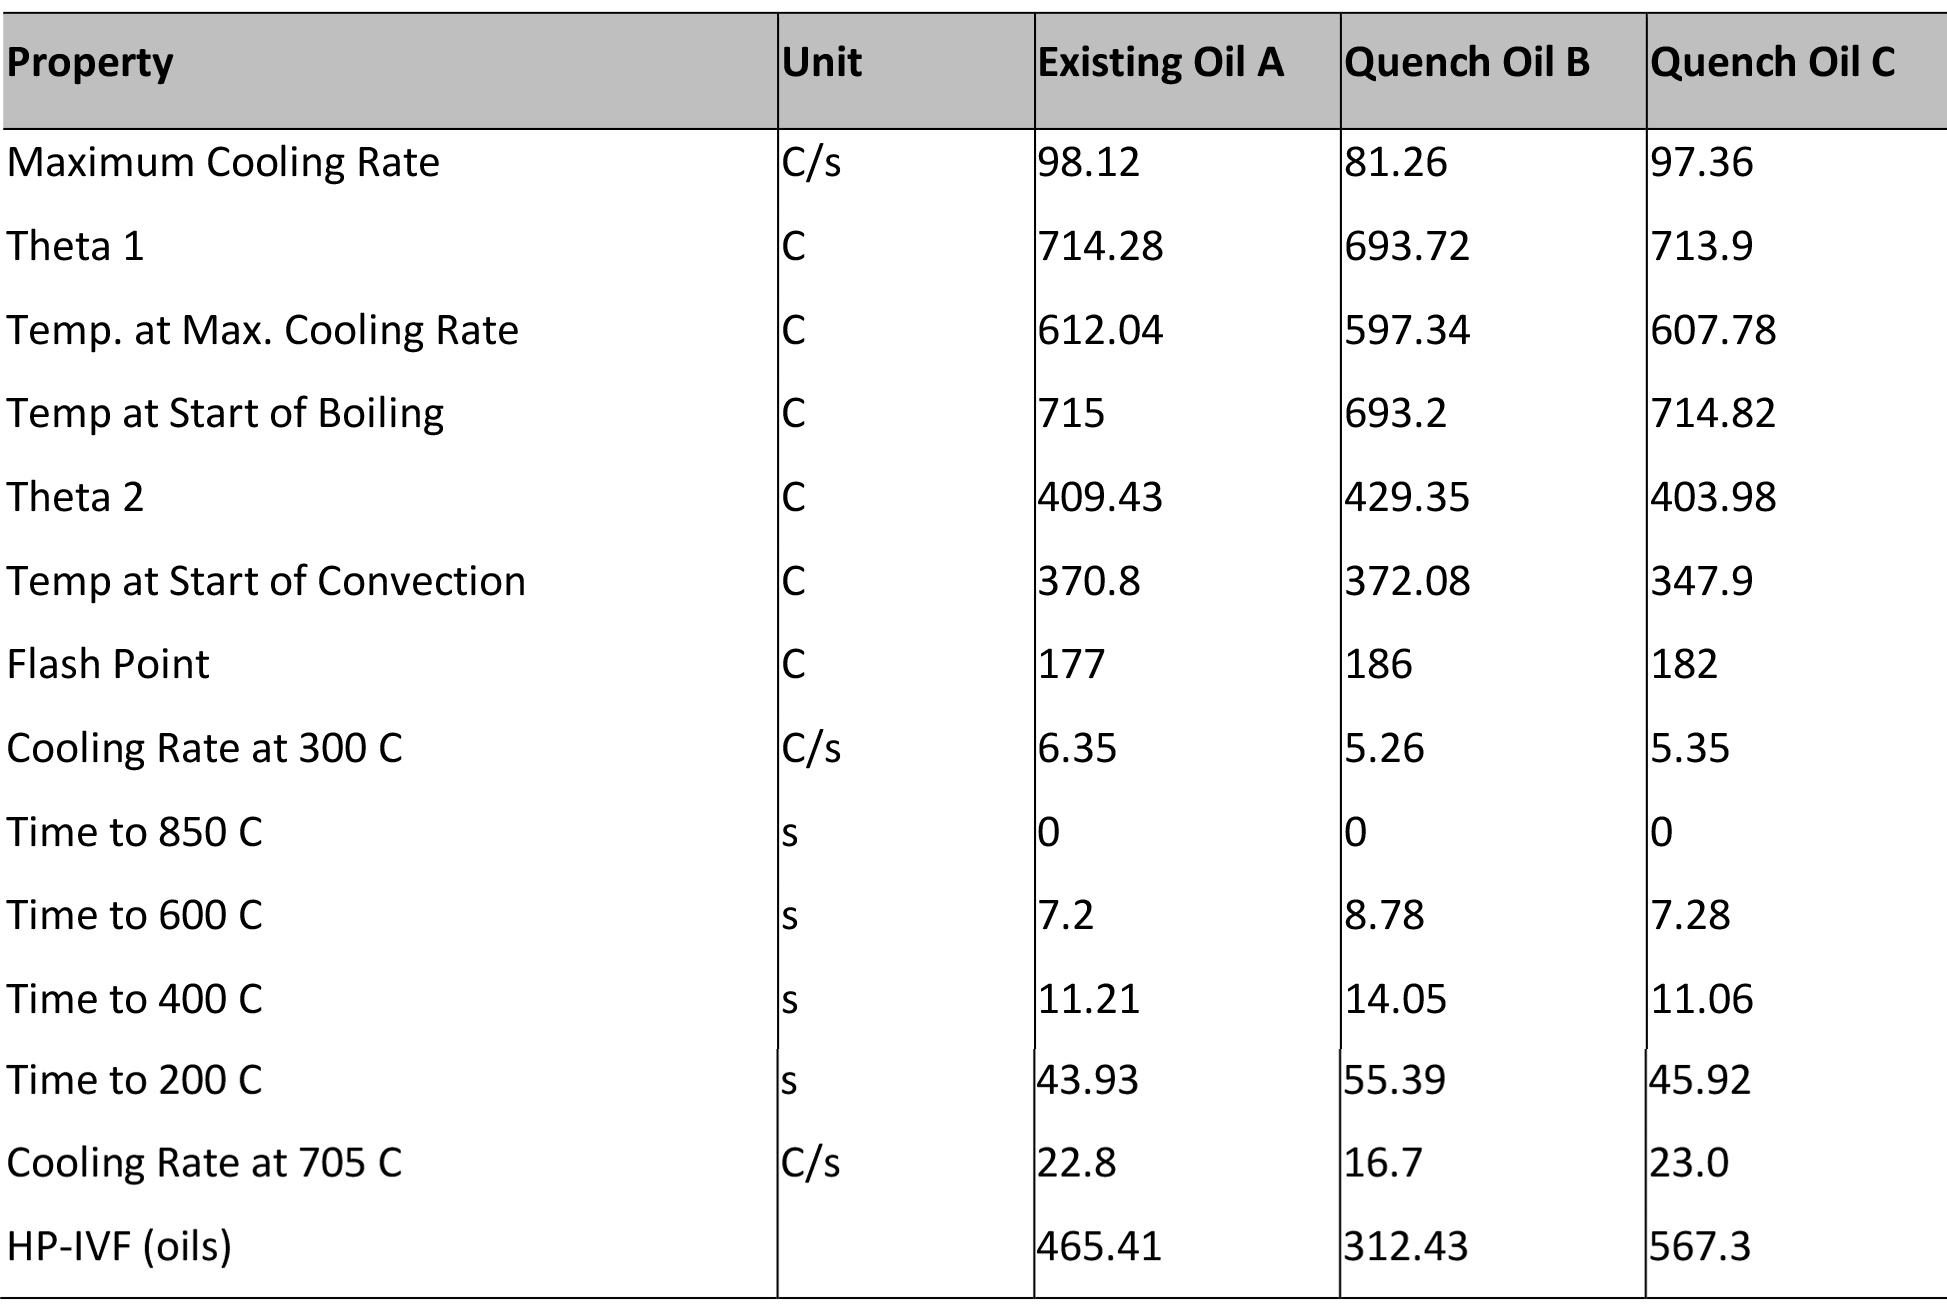
As a general rule, oils are considered to be metallurgically equivalent if the Maximum Cooling Rate is ± 14°C/second; the temperature at the Maximum Cooling Rate is ± 14°C, with similar viscosities and flash point. This is illustrated in Figure 1. Tabular data from the cooling curves are listed in Table 2. As a general rule, if the oils meet these criteria, similar metallurgical results will be obtained.
This is by far the most common method of comparing and selecting quench oils. However, many other factors besides the cooling curve behavior are important to select the proper quench oil.
Hardening Power
Alternatively, quenchants can be compared using cooling curve analysis by using the Hardening Power of the quenchant [4]. In this method, three characteristic points of the cooling curve, measured by the method described in ISO 9950, are used in a formula derived by regression analysis to describe the hardening power of oil quenchants. This hardening power for unalloyed steels, HP, is expressed as a single value in Equation 1:

where TVP is the transition temperature between the vapor phase and the boiling phase (in °C); CR is the cooling rate at 550°C; and TCP is the transition temperature between the boiling phase and the convection phase.
This method allows oils to be selected by comparing the relative hardening power of each of the oils. However, for new installations, it is necessary to know the necessary cooling rate required to achieve part properties.
This method was further developed for the hardening of carburizing steels in hot oils [6] [7]. Using the methodology described in ISO 9950, it was determined that only two critical points from the time-temperature and cooling rate curves had any significance for the measured hardness. The addition of the hardness of the Jominy End Quench at 6.5 mm increased the accuracy of the hardness prediction. In this experiment, the core hardness when martempering yielded Equation 2:

where CR500 is the cooling rate at 500°C; T20 is the temperature (°C) after 20 seconds; and HRCJ=6.5 is the hardness at a Jominy distance 6.5 mm from the quenched end. It was shown that this method accurately predicted the core hardness.
It is important to realize that different steels have different cooling requirements, and that the Hardening Power equation was based on unalloyed carbon steels. Different alloys will require different regression constants [8]. However, this method has been shown to be effective in determining the relative ranking of oils for quenching. However, the Hardening Power equation should be used with caution when comparing different steels or for general hardness predictions. Alternative equations for making hardness predictions and ranking of oil quenchants have been made by Chen and Zhou [9].
If the Hardening Power of the quenchants considered is within approximately 25 percent, then the quenchants are generally considered to be equivalent.
Grossman H-Value
The classic method related to the ability of a quenchant to harden steel is to determine the Grossman H-Value [10] [11] or Severity of Quench. The H-Value is defined in Equation 3 [12]:
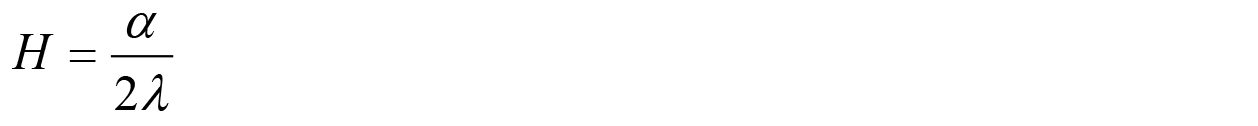
where α is the average heat-transfer coefficient at the surface of the part, and λ is the thermal conductivity of the steel. For most steels, the thermal conductivity does not change appreciably over temperature or from alloy grade to grade, so it is directly approximate to the average heat transfer of the quenchant. A summary of the Severity of Quench for different media is shown in Table 3.
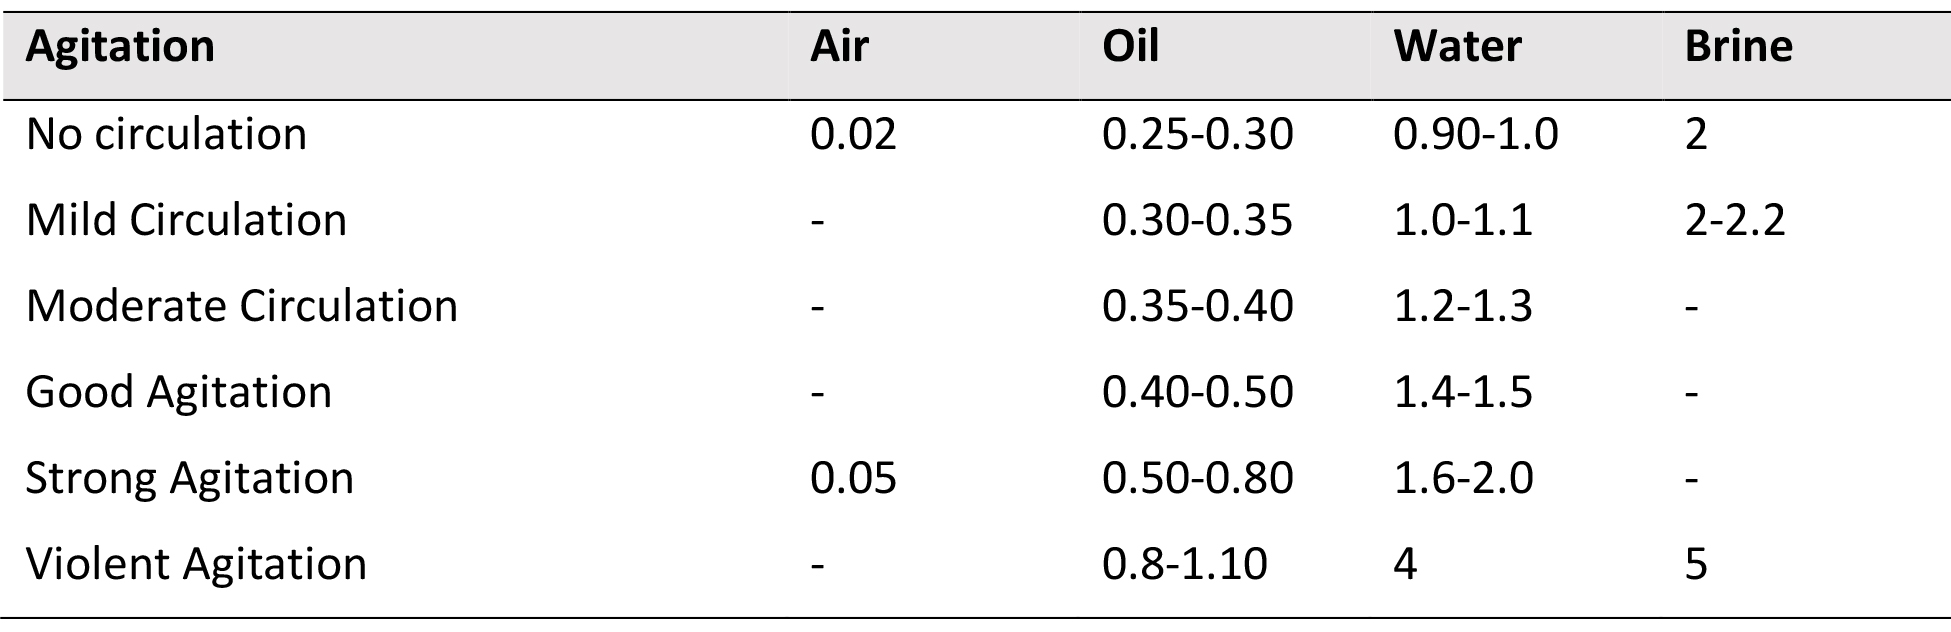
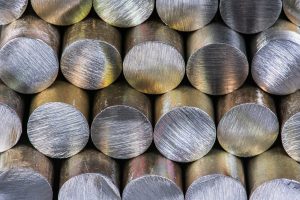
The Grossman H-Value is determined experimentally by quenching a series of round bars. After quenching, the bars are sectioned, polished, and etched. The 50 percent martensite region is determined. This is readily achieved because the transition in etching between dark and light etching corresponds to 50 percent martensite.
Although, this method has been used in the industry for many years, it is not without problems. The biggest issue with the application of the Grossmann H-Value is the difficulty in quantifying agitation rates. There is really no understanding of what is meant by “mild” or “violent” agitation. Further, the different methods of quenching such as spray quenching have no equivalent to the Grossman H-Value. This method is only focused on the ability of the quenchant to harden steel and gives no indication regarding distortion.
However, the terms describing the agitation are not quantifiable and can result in errors. Since most oils are tested without agitation, this results in a very narrow range of possible oil values. Further, when the original testing was done, the oils used in the original paper were straight oils, devoid of speed improvers. Modern oils achieve much higher quench rates (nearly double) than those tested in the original paper. Previously, there has been no way to correlate cooling curve data to Severity of Quench (H).
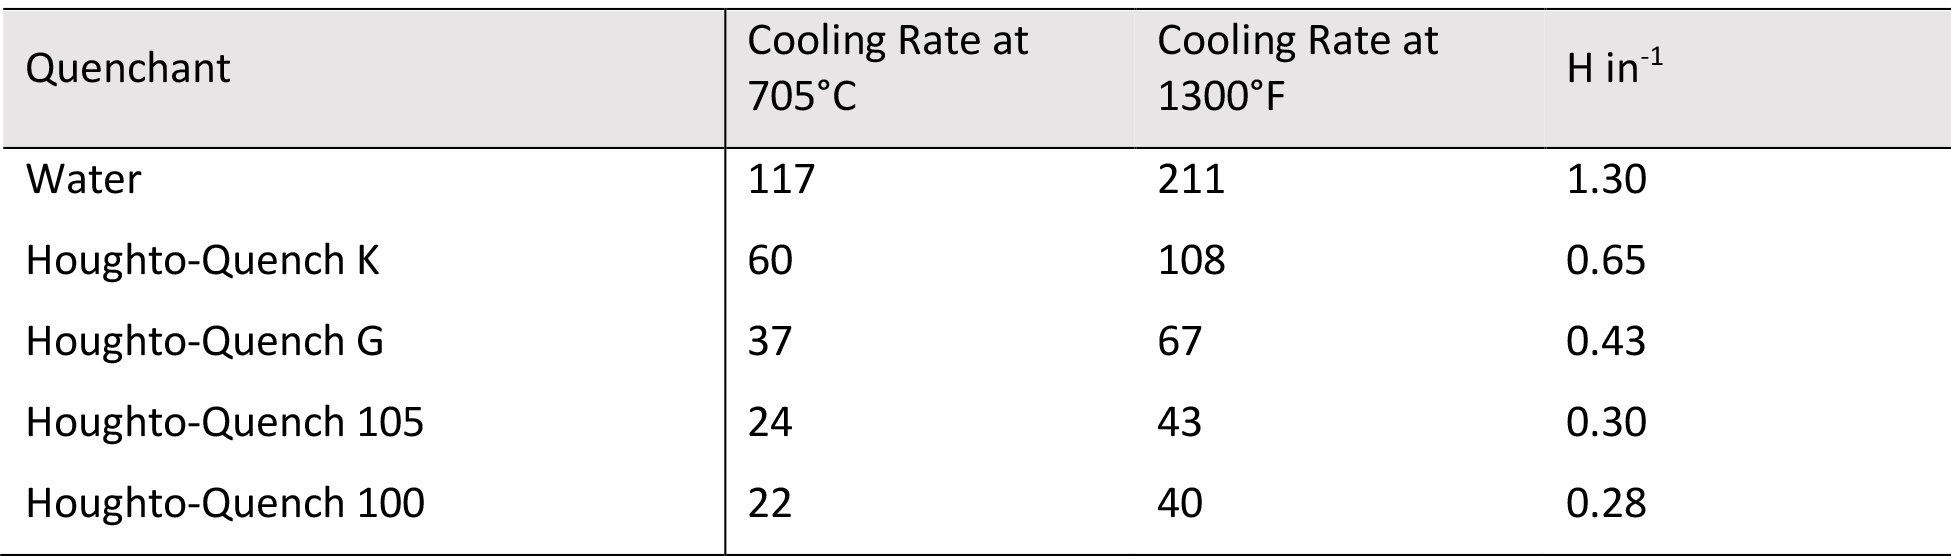
However, Otero [13] determined the Grossman H-Value from the cooling rate at 1,300°F (705°C) by use of the Kondratjev [14] dimensionless number. Correlation of the Grossman H-Value as a function of the cooling rate at 1,300°F (705°C) is shown in Figure 2. Typical values for several common quenchants are shown in Table 4.
The calculations show a good similarity to the classical H-values of Grossman. Further testing is needed to verify that the calculated results correspond to Jominy data and predicted hardness distributions in quenched bars [15].
To achieve equivalence to the data presented in Jominy End Quench testing, the H-Value only refers to the quench rate at a very narrow temperature range of 705°C (1,300°F). To ensure the proper cooling rate and microstructure is achieved, it is necessary to refer to Continuous Cooling Diagrams (CCT) for the steel of interest.
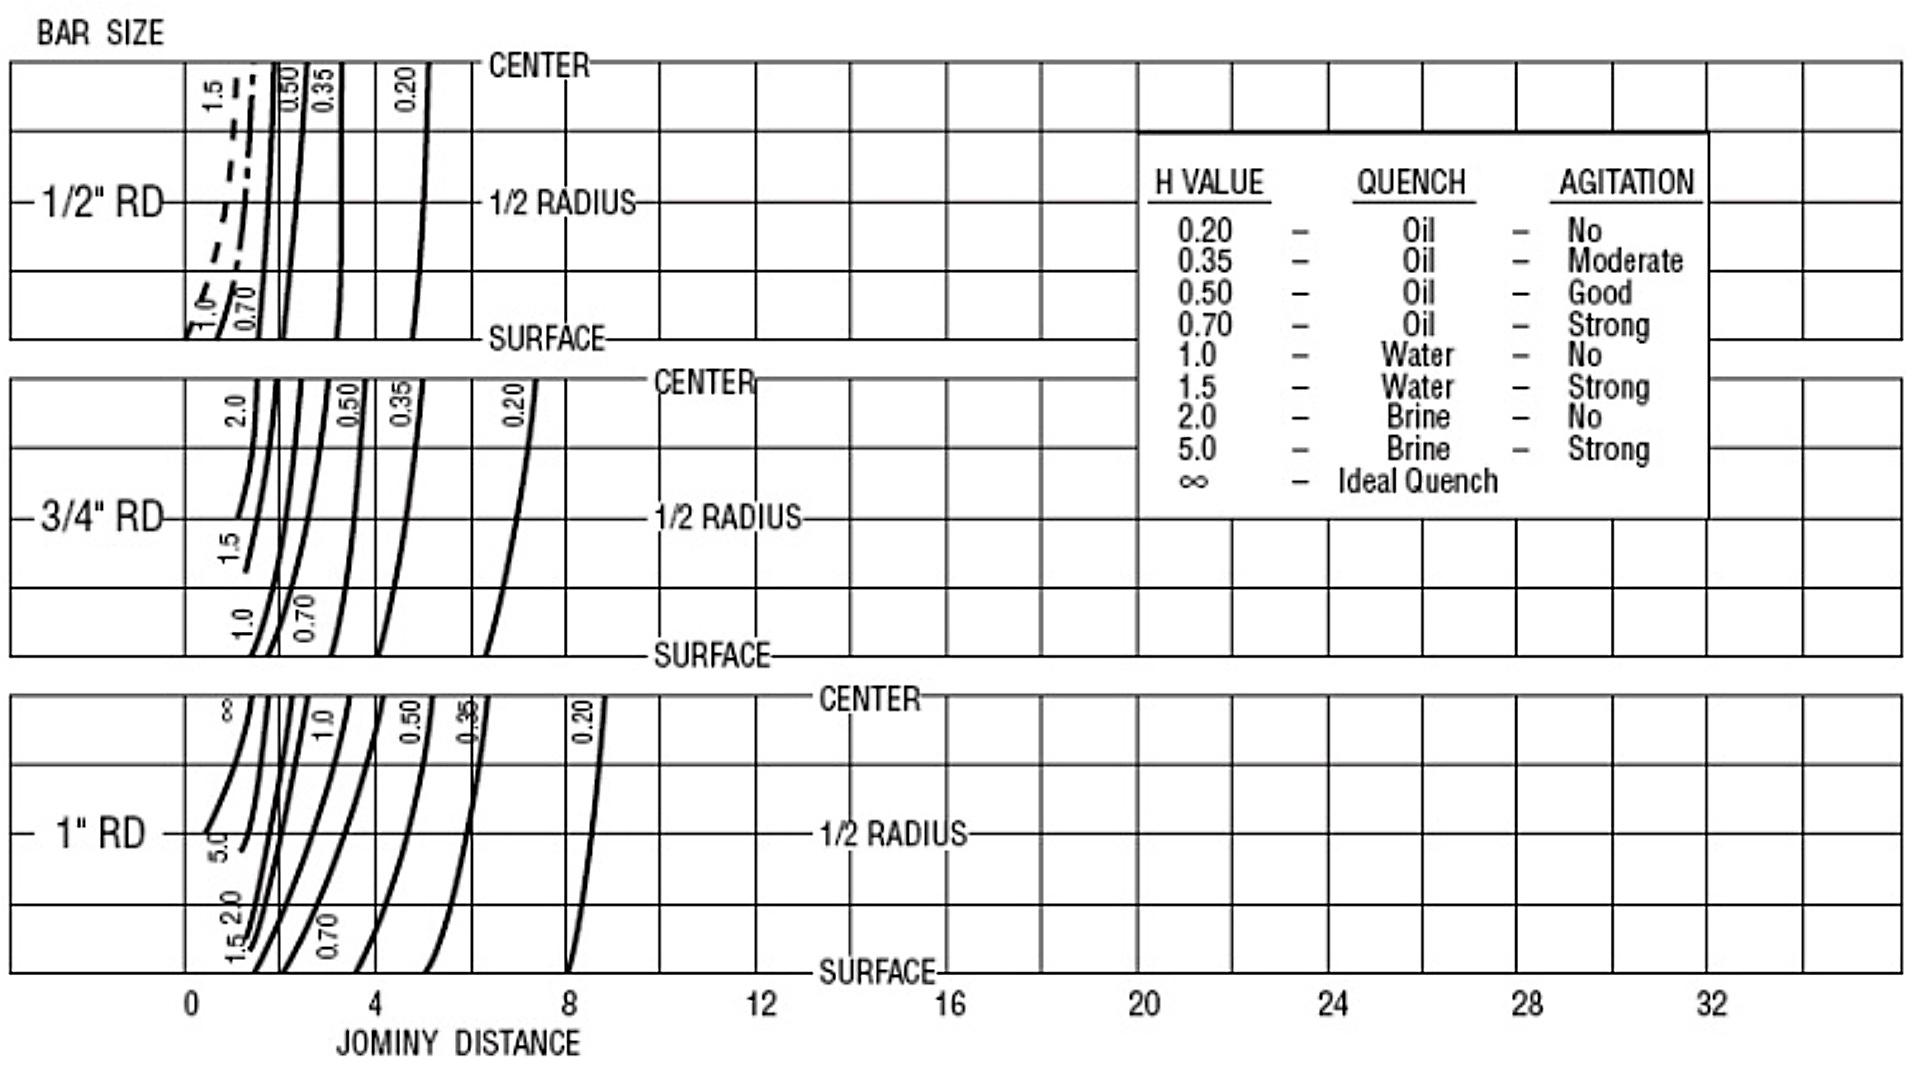
This method makes possible the calculation of the critical size in terms of a standardized quench and calculation of the critical size from a single test. Using charts, it is possible to predict how a known steel with a specific Jominy curve would behave and predict the hardness distribution within the bar. Using the concept of equivalent rounds, the hardness distribution can be predicted. An example of charts to predict hardness distribution based on hardness correlation to round bars is shown in Figure 3. Using this method, the hardness was predicted for SAE 4130 at the minimum and maximum hardenability for different size rounds for the cooling curves. The results are shown in Figure 4.
Heat-Transfer Calculation
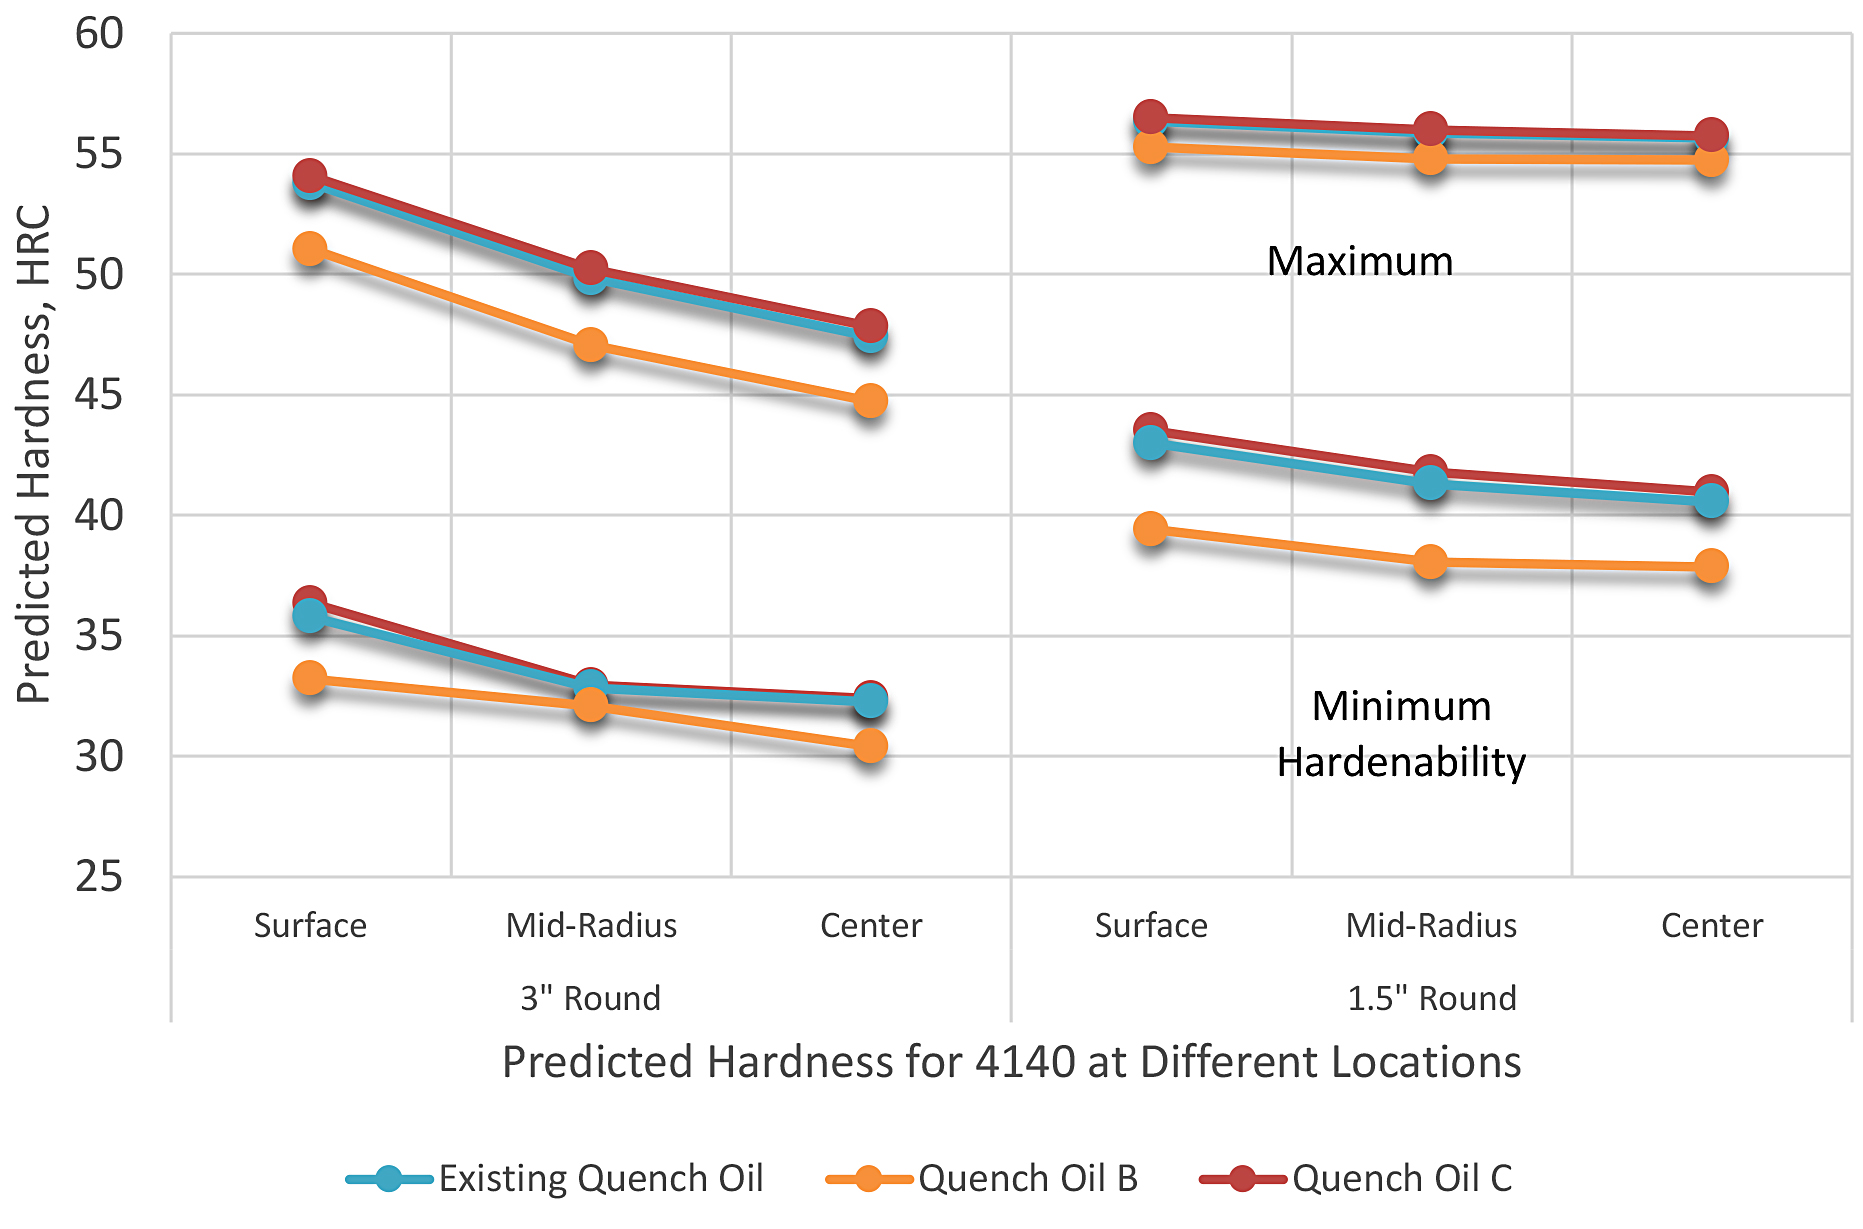
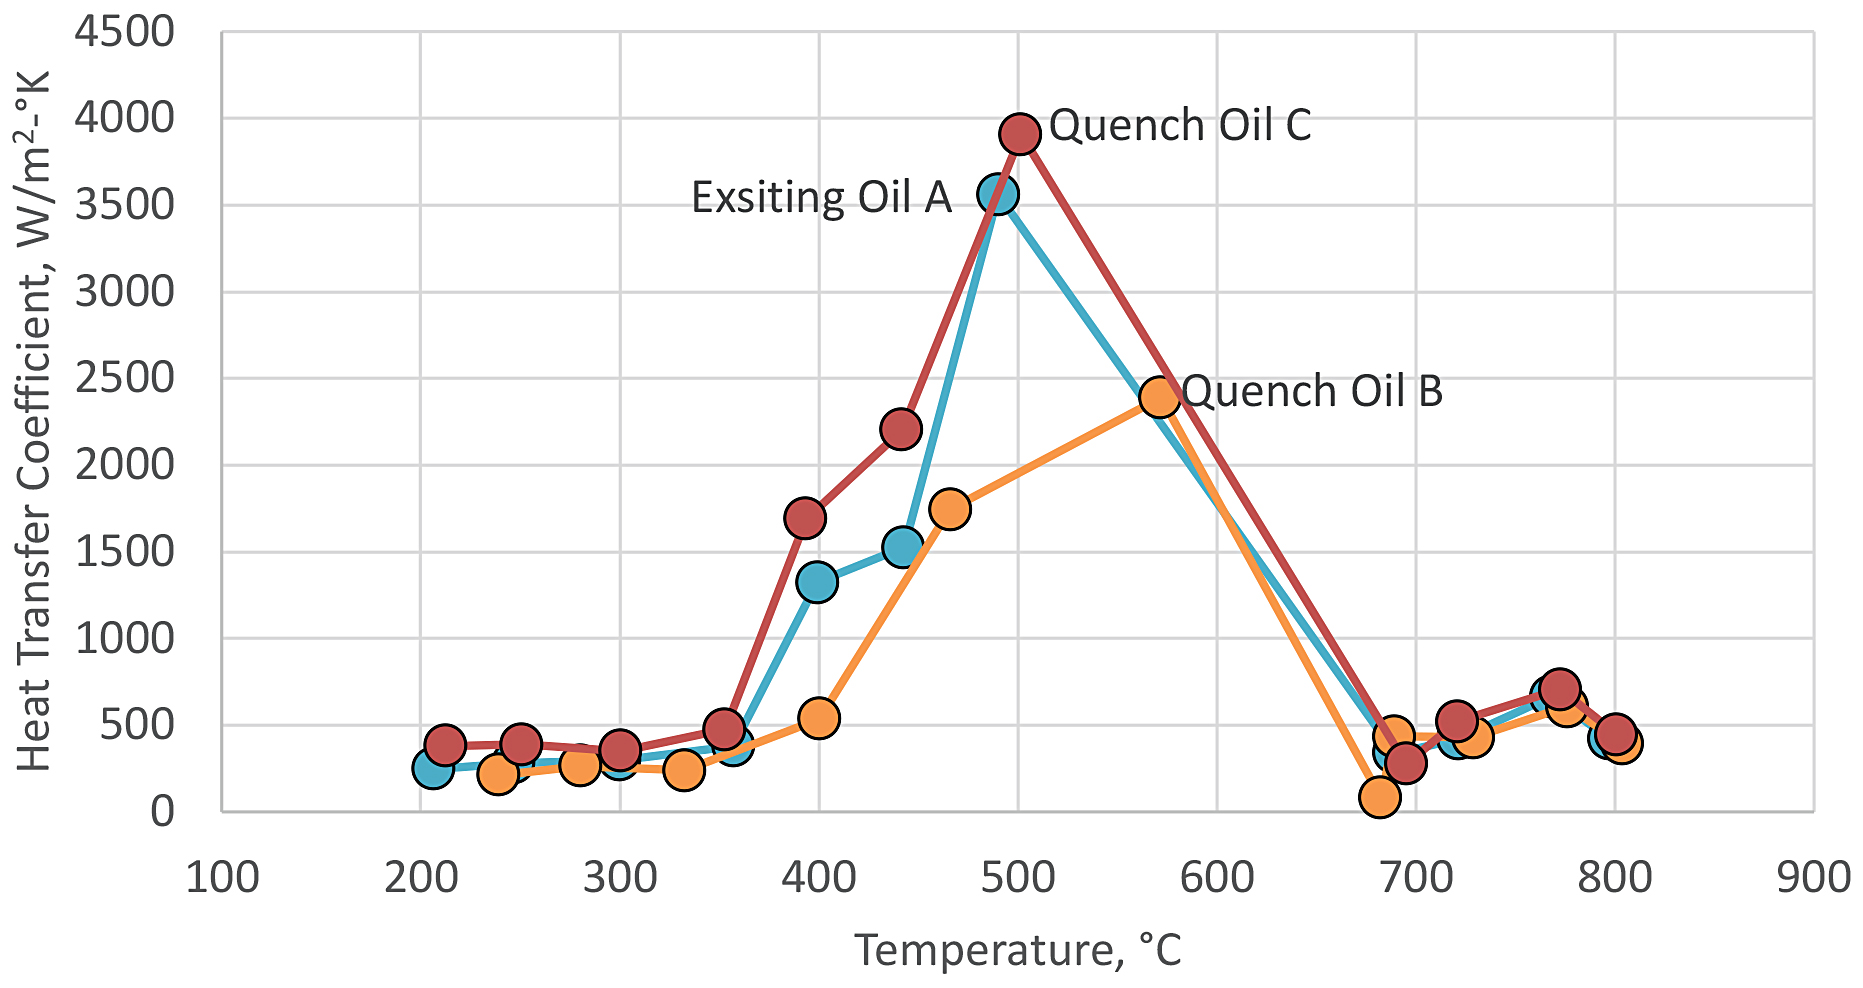
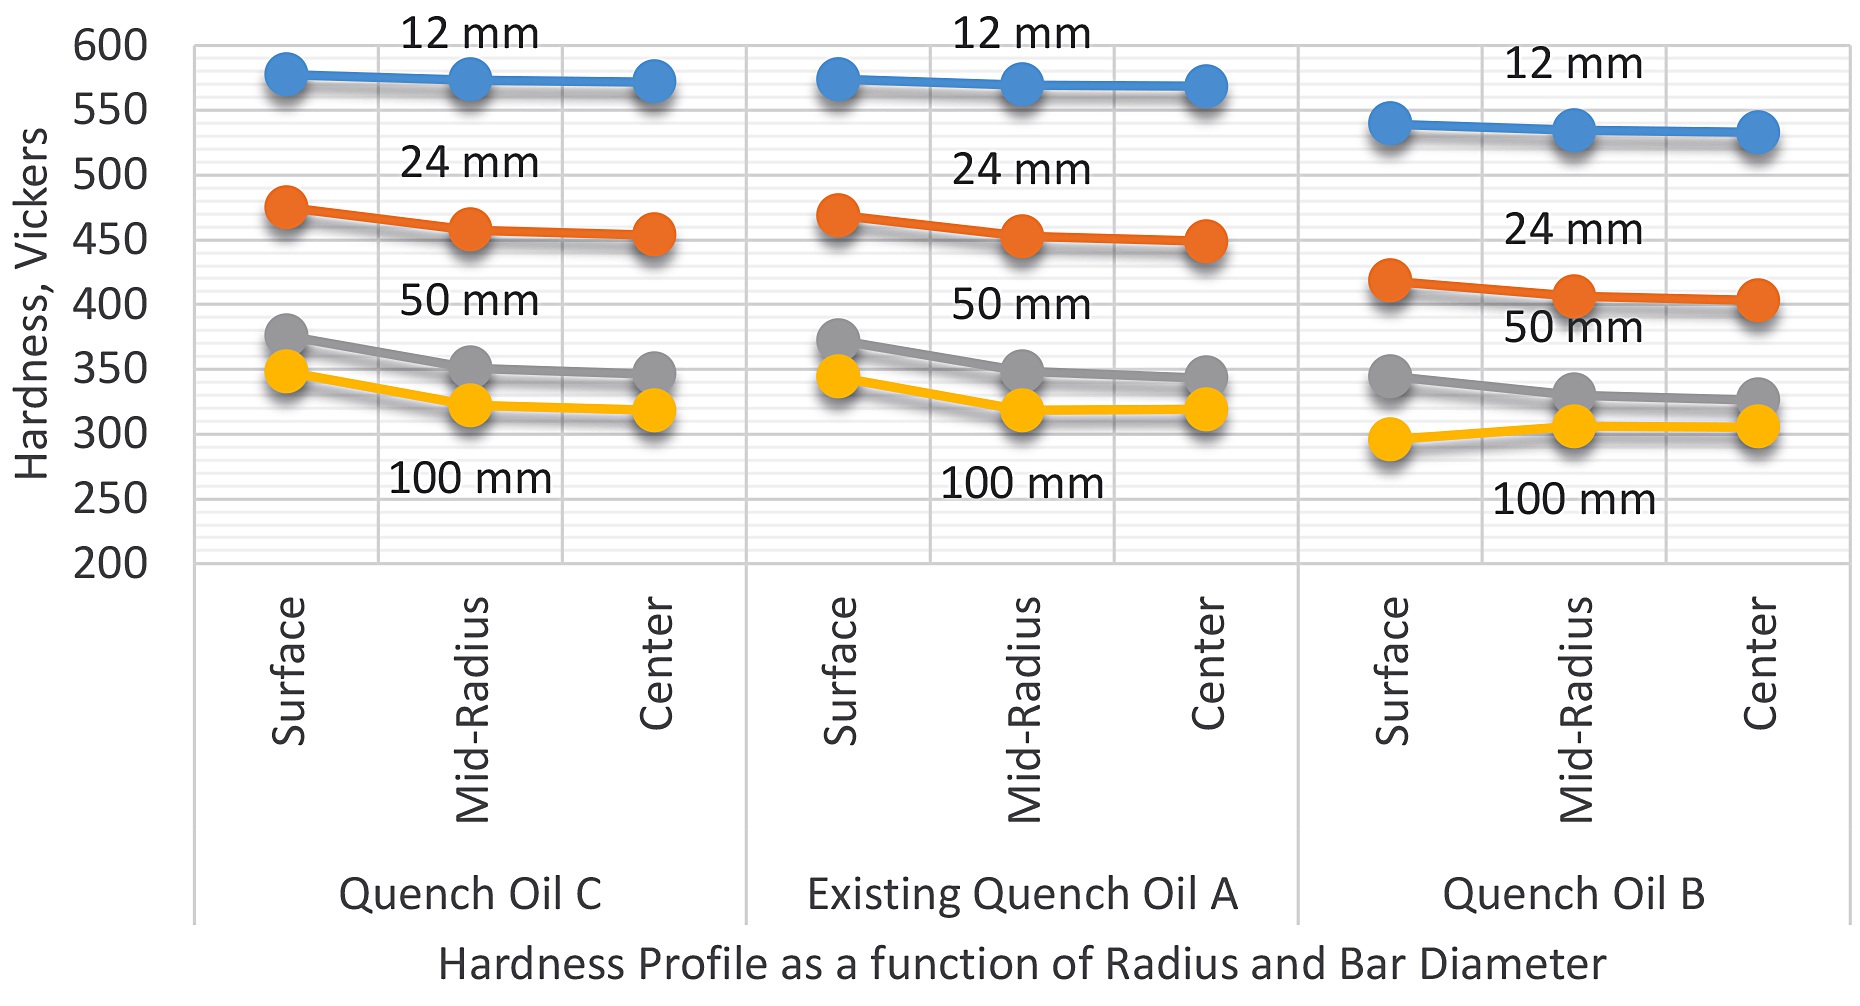
Lastly, a relatively newer method to predict hardness and microstructure has been developed by IVF Swerea in Sweden using the IVF SmartQuench Integra [17]. In this method, the heat-transfer coefficients as a function of surface temperature are calculated using the inverse-method [18]. After entering the TTT diagram of the desired material (or using the database), the CCT curve is calculated. From there, the microstructure and hardness are calculated. This last method is more accurate, as it encompasses the entire quench path of the quenchant. Examples of the heat transfer as a function of the surface temperature for the cooling curves are shown in Figure 5. The calculated hardnesses for SAE 4140 and different size round bars are shown in Figure 6.
However, similar physical properties and quenching characteristics will not mean the oil will perform over time in a similar fashion. The thermal stability of the oil, measured by its oxidative stability, must also be considered [19]. However, due to space constraints, the oxidative stability of oils will be discussed in a later article.
Conclusions
In this article, the various methods of selecting a quench oil for various applications are described. Each of the different methods has merits and shortcomings. The cooling curve method is typically conservative, as the oils are not agitated during cooling curve measurement. This method is also the simplest method and offers a visual indication of the similarity or difference between different quenchants. The hardening power is an extension of the cooling curve test and is an additional method of showing similarity of different quench oils. However, it is only as good as the cooling curve measurement. Using the cooling curve and determining the Grossman H-Value is a quick method of predicting hardnesses for different size bars. It does not provide any information regarding microstructure. Another limitation is that the agitation is typically not determined, and only one point on the cooling curve is used for the determination of the average heat-transfer coefficient.
The last method, using calculated surface heat transfer coefficients and calculation of microstructure and hardness as a function of radial distance, offers the most comprehensive method of comparing quenchants. However, it is limited to simple round bars. It is also limited by the accuracy and availability of TTT curves.
References
- D. S. MacKenzie, “History of Quenching,” Journal of Heat Treatment and Surface Engineering, vol. 2, no. 2, pp. 68-73, 2008.
- B. Liscic, H. M. Tensi, L. C. Canale and G. E. Totten, Eds., Quenching Theory and Technology, Boca Raton, FL: CRC Press, 2010.
- G. Totten, C. Bates and N. Clinton, Eds., Handbook of Quenching and Quenchants, Metals Park, OH: ASM International, 1993.
- S. Segerburg, “Classification of quench oils: A method of comparison,” Heat Treating, vol. 20, no. 12, pp. 30-33, 1988.
- D. S. MacKenzie, “Metallurgical Aspects of Distortion and Residual Stresses in Heat Treated Parts,” in 23rd IFHTSE Heat Treatment and Surface Engineering Congress, April 18-21, Savannah, GA, 2016.
- E. Troell, H. Kristofferson, J. Bodin, S. Segerberg and I. Felde, “New Tool for Calculation of Heat Transfer Coefficients, Microstructure and Hardness from Cooling Curve,” in IFHTSE 5th International Conference on Quenching and Control of Distortion, Berlin, Germany, 2007.
- H. Kristofferson and S. Segerberg, “Designed Experiments to Study Distortion, Hardness and their Variation in Hot-Oil QUench Carburizing,” Heat Treatment of Metals, vol. 2, pp. 39-42, 1995.
- L. C. Canale, X. Luo, X. Yao and G. E. Totten, “Quenchant Characterization by Cooling Curve Analysis,” J. ASTM, vol. 6, no. 2, pp. 1-29, 2009.
- C. Chen and J. Zhou, “Discussions on Segerberg Formula Concerning Hardening Power of Quenchants,” J. Shanghai Jiaotong Univ., vol. 36, no. 1, pp. 78-82, 2002.
- M. A. Grossman and M. Asimov, “Hardenability and Quenching,” Iron Age, vol. 145, no. 17, pp. 25-29, 1940.
- M. A. Grossman and M. Asimov, “Hardenability and Quenching,” Iron Age, vol. 145, no. 18, pp. 39-47, 1940.
- A. V. Reddy, D. A. Akers, L. Chuzoy, M. A. Pershing and R. A. Woldrow, “A Simple Method Evaluates Quenches,” Heat Treating Progress, vol. 1, pp. 40-42, 2001.
- R. Otero, “Calculation of Kobasko’s Simplified Heat Transfer Coefficients from Cooling Curve Data Obtained with Small Probes,” J. ASTM, vol. 4, no. 2, pp. 30-36, 2012.
- N. Kobasko, “Optimized Quenched Layer for Receiving Optimal Residual Stress Distribution and Super-strength Material,” in 3rd WSEAS International Conference on Applied and Theoretical Mechanics, Barcelona, Spain, December 14-16, 2007.
- J. L. Lamont, “How to Estimate Hardening Depth in Bars,” Iron Age, no. 10, pp. 64-70, 1943.
- Timken, Practical Data for Metallurgists, 17th Edition, North Canton, OH, 2014.
- Swerea IVF AB, SQIntegra Product Brochure, Monldal, 2012.
- I. Felde and T. Reti, “Evaluation of Cooling Characteristics of Quenchants by Using Inverse Heat Conduction Methods and Property Prediction,” Materials Science Forum, vol. 659, pp. 153-158, 2010.
- K. Funatani, “Distortion control via optimization of cooling process and improvement of quench oils,” in IDE 2008, Bremen, Germany, 2008.


 general practice for CQI-9 and AMS2750E")


