


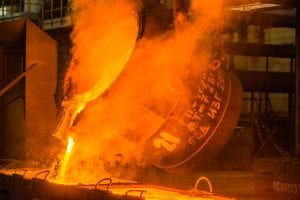
When a hot component comes in contact with the liquid quenchant, there are normally three stages of quenching. There are exceptions to this, which will be explained in each stage. The three stages of quenching are:
- Vapor stage (stage A or vapor blanket stage)
- Boiling stage (stage B or nucleate boiling stage)
- Convection stage (stage C)
The vapor stage is encountered when the hot surface of the heated component first comes in contact with the liquid quenchant. The component becomes surrounded with a blanket of vapor. In this stage, heat transfer is slow and occurs primarily by radiation through the vapor blanket. Some conduction also occurs through the vapor phase. This blanket is stable, and its removal can only be enhanced by agitation or speed-improving additives. This stage is responsible for many of the surface soft spots encountered in quenching. Strong agitation eliminates this stage. If the vapor phase persists, then non-martensitic transformation products can occur.
The second stage encountered in quenching is the boiling stage. This is where the vapor stage starts to collapse and all liquid in contact with the component surface erupts into boiling bubbles. This is the fastest stage of quenching. The high heat extraction rates are due to carrying away heat from the hot surface and transferring it further into the liquid quenchant, which allows cooled liquid to replace it at the surface. In many quenchants, additives have been added to enhance the maximum cooling rates obtained by a given fluid. The boiling stage stops when the temperature of the component’s surface reaches a temperature below the boiling point of the liquid. For many distortion-prone components, high boiling temperature oils or liquid salts are used if the media is fast enough to harden the steel, but both of these quenchants see relatively little use in induction hardening.
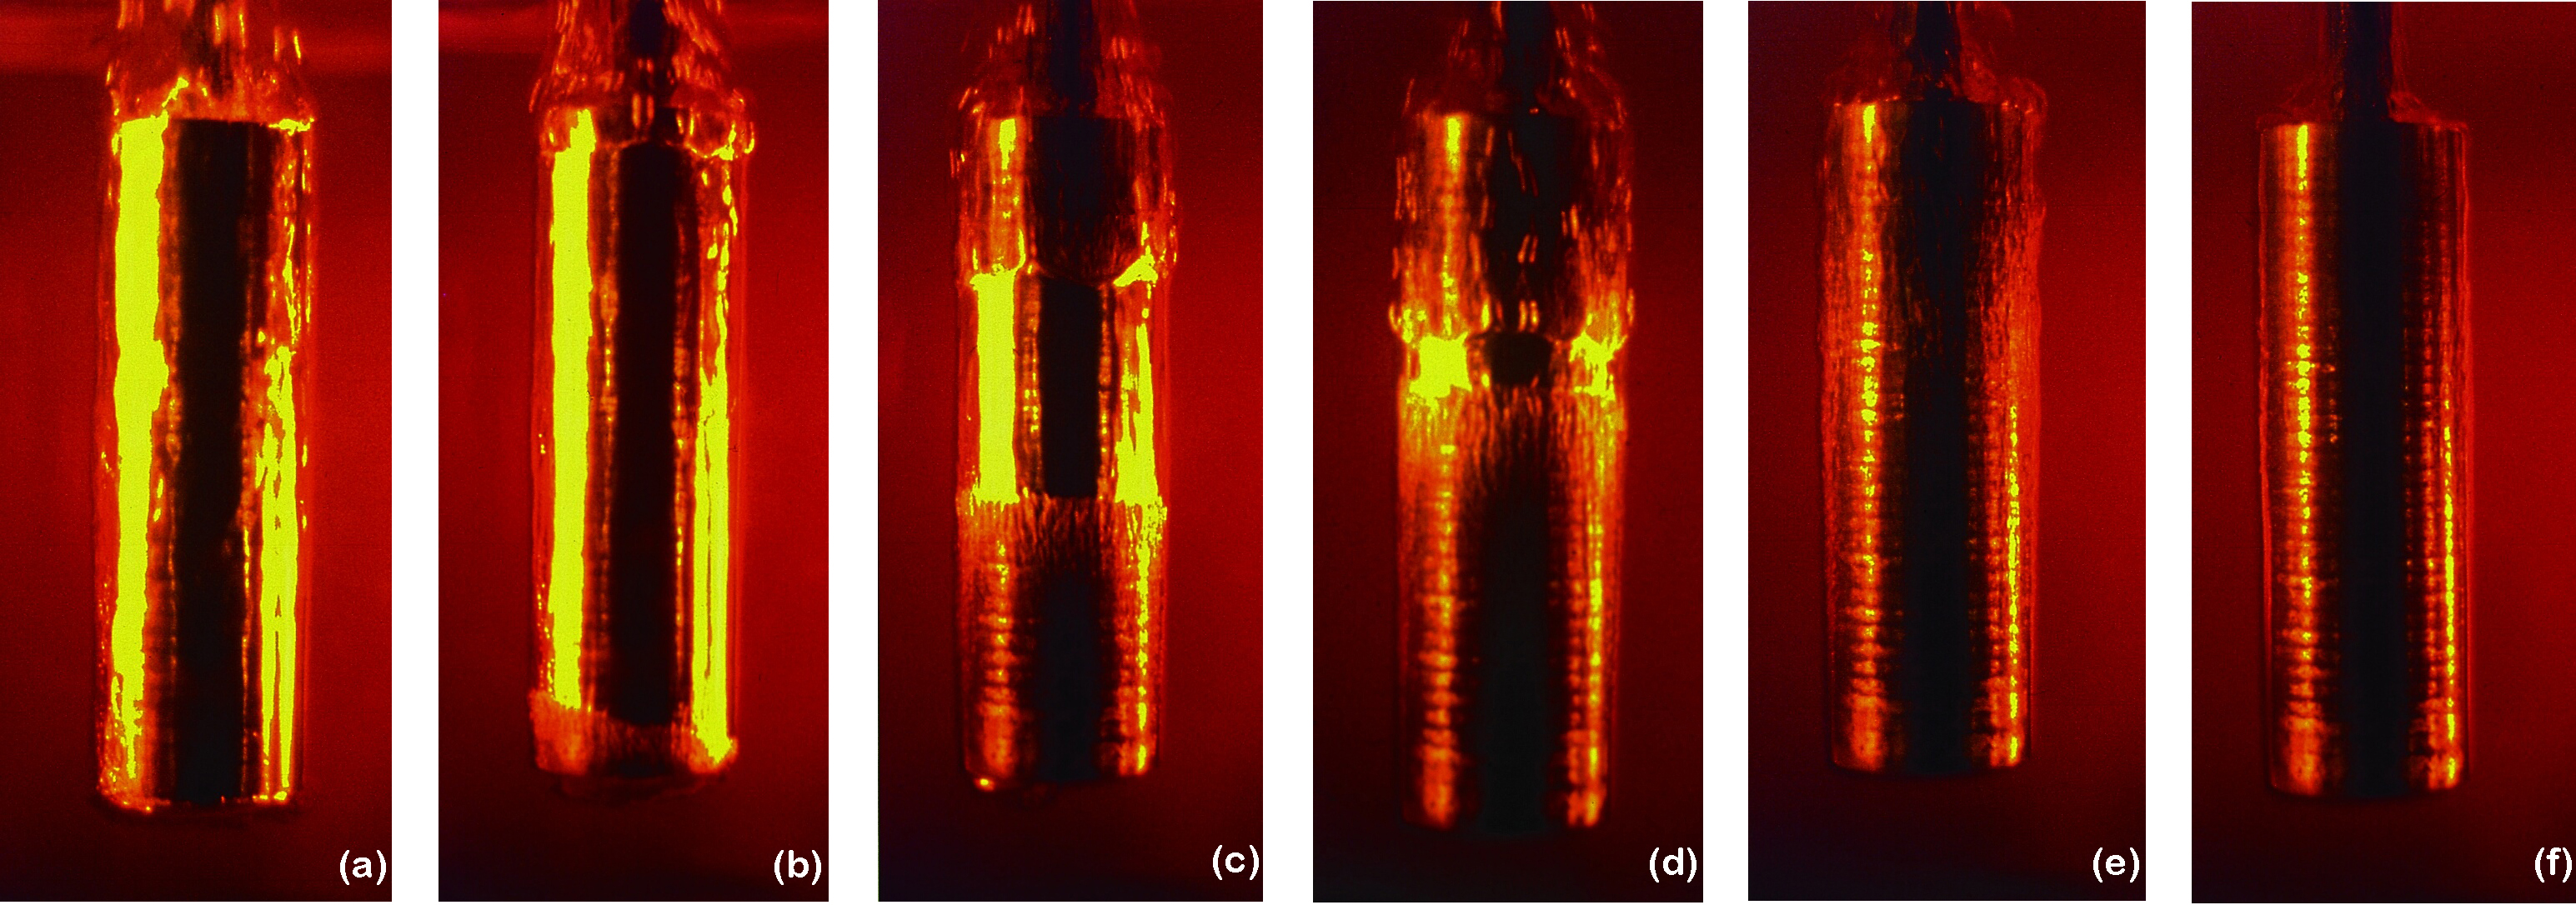
The final stage of quenching is the convection stage. This occurs when the component has reached a point below that of the quenchant’s boiling temperature. Heat is removed by convection and is controlled by the quenchant’s specific heat and thermal conductivity and the temperature differential between the component’s temperature and that of the quenchant. The convection stage is usually the slowest of the three stages. Typically, it is this stage where most distortion occurs. An example showing the three stages of quenching is shown in Figure 1.
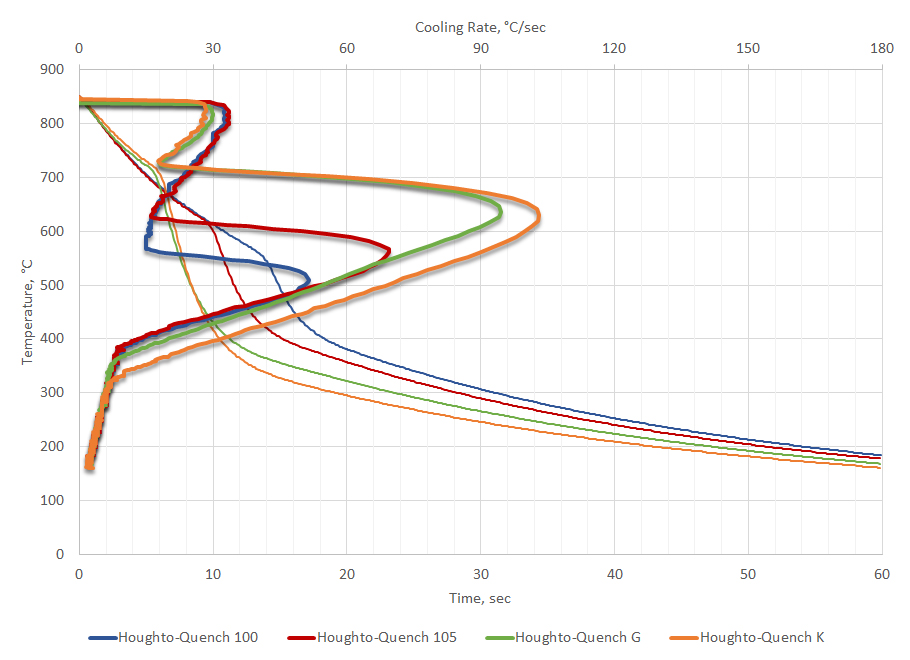
The cooling curve test is the best procedure for characterizing the ability of a quenchant to extract heat. Cooling curves provide a complete picture of the heat extraction and cooling performance of a quenchant, as a function of surface temperature or center temperature of a probe. In this test, an instrumented probe of some material is heated to the desired temperature (usually in the austenite range) and then removed from the furnace. It is then transferred to the quenchant, recording the time verses temperature of the probe. Additional information is obtained by taking the instantaneous slope of the time-temperature curve to obtain the cooling rate curve. An example of the typical cooling rate curves for a selection of fast to slow oils is shown in Figure 2.
Standardized test procedures are absolutely necessary to evaluate quenchant performance. This fact is recognized by ASTM [3], SAE [4], NADCAP [5], CQI-9 [6], ISO [7], and other auditing bodies for aerospace, automotive, and other industries. The use of standardized procedures for quenchant evaluation, in particular heat extraction capabilities, allows reproducible historical data collection. It allows evaluation to determine if a quenchant is suitable for a particular application or enables quality checks on current processes.
One of the first documented references on cooling curve apparatus was published by Pilling and Lynch [8]. This was an extension of the work by Le Chatelier [9]. In this study, Pilling and Lynch used a platinum-platinum rhodium thermocouple welded to the geometrical center of a 6.4 mm diameter by 50 mm probe fabricated from nickel + 5% silicon. This alloy was found to be free from the transformation effects of steel and avoided any transformations of nickel. The addition of silicon afforded oxidation resistance. They systematically examined the quenching characteristics of water, brine, soap solutions, and three different oils. They observed three different modes of cooling: type A, which is now known as the vapor blanket; type B, or nucleate boiling; and type C, or convection.
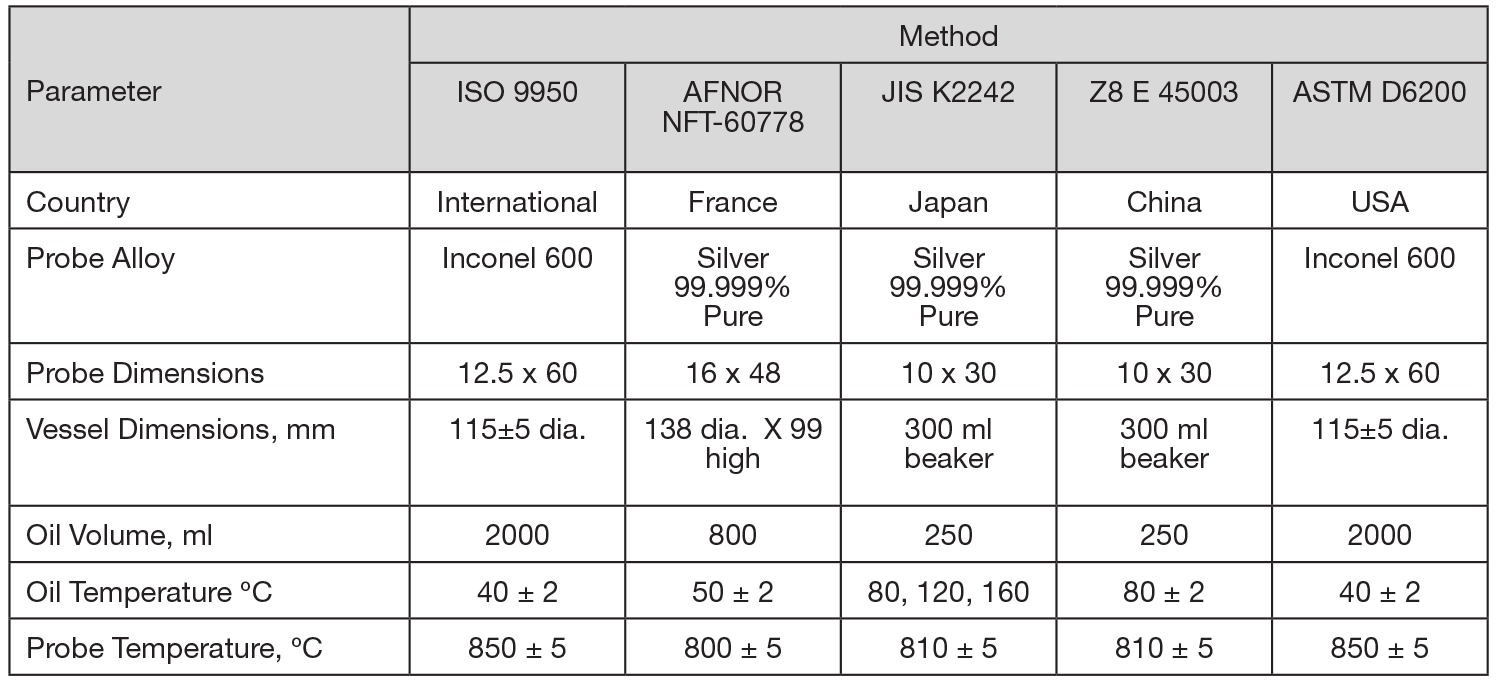
Instrumented probes of many different types, shapes, and alloys are presently being used for cooling curve analysis. Presently, most standards specify either a pure silver or nickel-base Inconel 600 (UNS N06600) alloy. An early standard adopted by Japan, JIS K 2242 [10], is the Tamura probe, which measures surface temperature variation by a thermocouple located at the probe surface. Two other national standards utilize a silver probe: the French AFNOR NFT-60778 [11] and China’s ZB E 45003-88 [12]. A reusable Inconel 600 probe was developed at the Wolfson Heat Treatment Center, Birmingham, U.K. [13]. This probe is the basis for ISO 9950 [7] and ASTM D6200 [3]. A comparison of the test methods is shown in Table 1.
In the United States, the most commonly used method for determining cooling curves is ISO 9950 [7] or ASTM D6200 [3]. This standard is used extensively for the characterization of cooling curve behavior of oil quenchants. It is used to determine the suitability of a quenchant for a particular application and is increasingly used as a quality control check of used oil to ensure proper quenching and to observe any oil deterioration.
Typically, the Inconel 600 probe is heated to 871°C and quenched into the desired quenchant. In the case of oil, 1-2 liters of oil is used without agitation. The temperature of the oil can vary, but is typically either 60°C for “cold” oils or 121°C for martempering oils. No agitation is used because of the difficulty in quantifying agitation.
Application of the Cooling Curve
Typical data that can be extracted from the ASTM D6200 cooling curve test includes:
- Maximum cooling rate, °C/s
- Temperature at maximum cooling rate, °C
- Cooling rate at 300°C, °C/s
- Time to cool to 600°C, 400°C, and 200°C/s
Other data can be extracted such as the temperature at the start of boiling and the temperature at the start of convection. This data can be used to compare oils or to evaluate oils for a new process or application.
When examining in-use oils, it is important to understand the effects of “real-world” contaminates to the cooling curve. Oxidation, particulate, and water can have a considerable effect on the shape of the cooling curve.
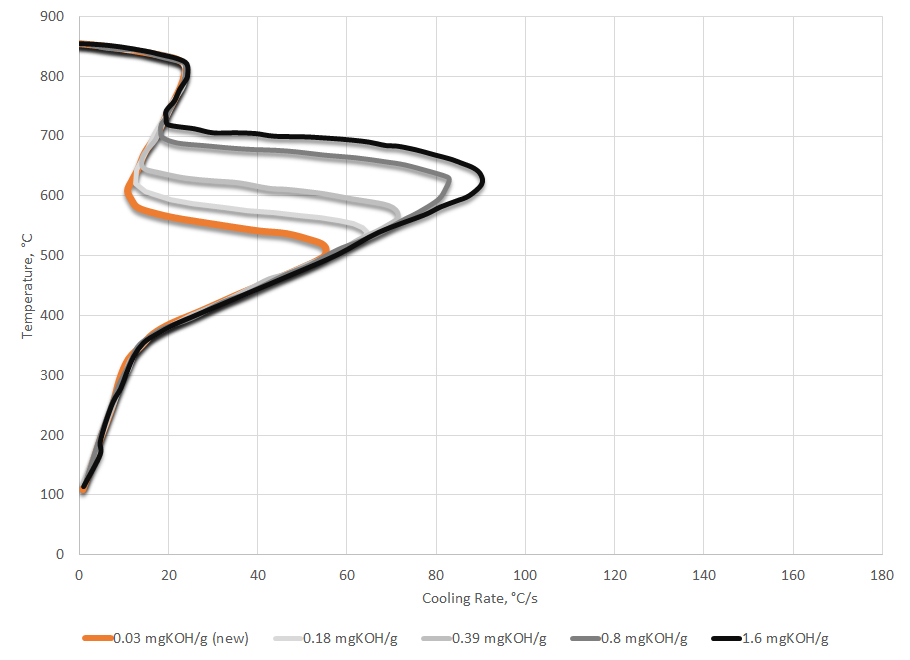
Oxidation and fine particulate have the effect of suppressing the vapor phase and increasing the maximum cooling rate. It will also increase the temperature at which the maximum cooling rate occurs. This is because the fine particulate or precursors to oxidation that are soluble in the oil act as nucleation sites for the initiation of nucleate boiling. A schematic representation of the effect of fine particulate or oxidation on the shape of the cooling curve is shown in Figure 3.
While oxidation and fine particulate such as soot can yield similar cooling curve behavior, it is possible to differentiate between the causes with testing. Determining the total acid number per ASTM D664 [16] or ASTM D974 [17] will tell if the oil is oxidized. If the oil is not oxidized and has a low TAN, then the likely cause of the change in cooling curve response is due to fine particulate or soot.
Fine filtration (less than 3 µm) can reduce the effect of fine particulate. Additions of antioxidant can reduce the oxidation of the quench oil and return the curve close to normal.
Experience with poorly functioning quenching oils indicates that in at least half the cases, water gets into the oil, causing cracking, uneven hardness, and soft spots. Water can enter the oil in a number of ways, and the sources must be tracked down and eliminated. A leaky cooler might bring water into the oil or water may drip into the tank from the roof. A tiny amount of water (about 0.1 percent) can cause a bath to foam excessively and greatly increase the danger of fire.
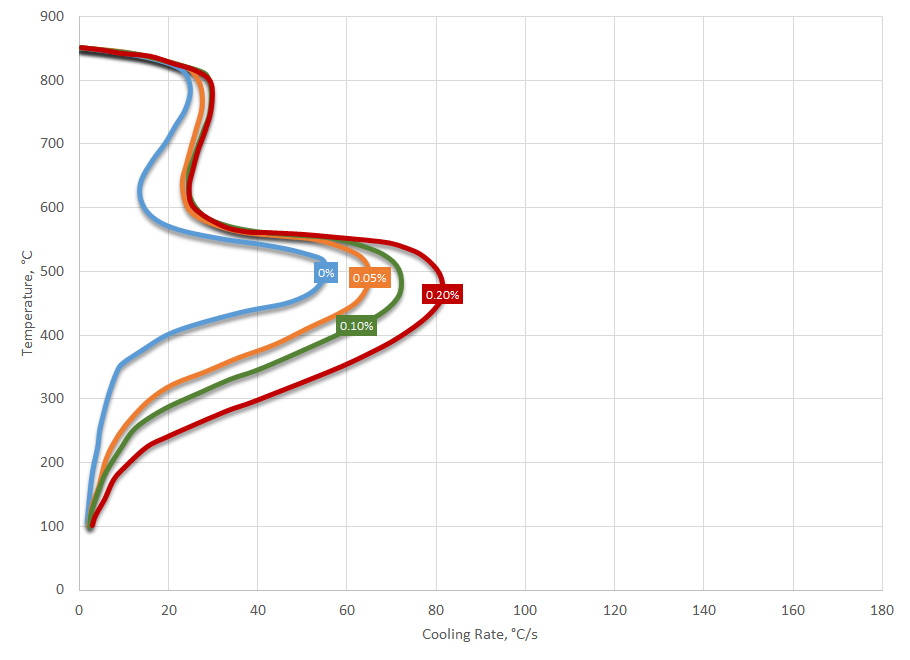
The cooling curve response of oils containing water shows an increased maximum cooling rate with an extended vapor phase. Further, and probably the most telltale sign that water is present, is the rounding of the nucleate boiling to convection transition. It is this change in cooling curve response that is responsible for cracking of parts when water is present. A schematic showing the effect of water on the cooling curve response is shown in Figure 4.
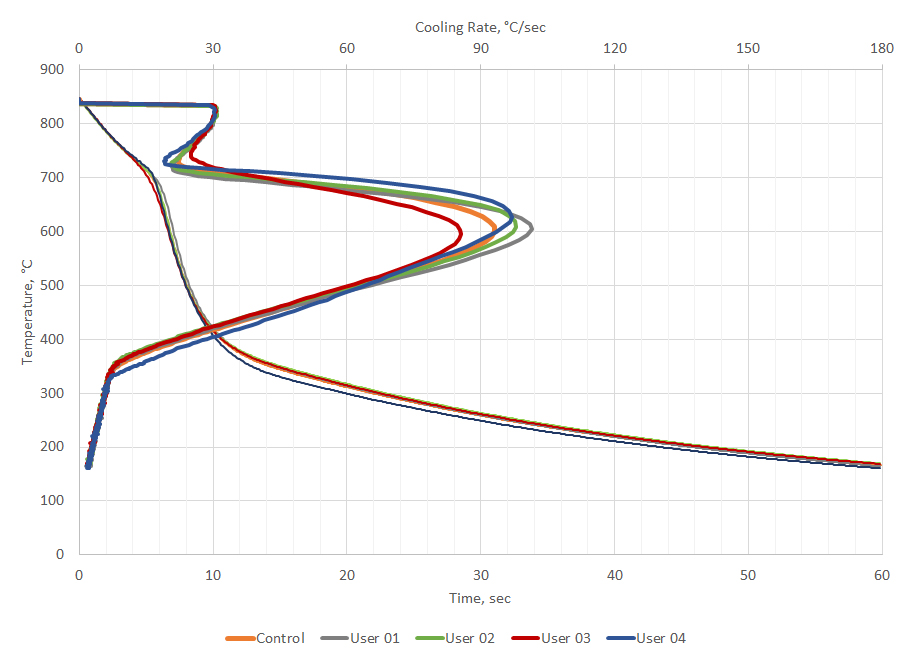
The cooling curve test is also used as a quality control check to ensure that the oil is operating as it should. Deviations from process parameters indicate that corrective action should be taken to ensure that parts are quenched properly. For example, four cooling curves from customers using the same oil (but different applications) were selected and compared to new oil. The representative cooling curves are shown in Figure 5. All the cooling curves show similar responses. Data from the cooling curve can be used to determine if the oils meet new manufacturing specifications for the quenchant.
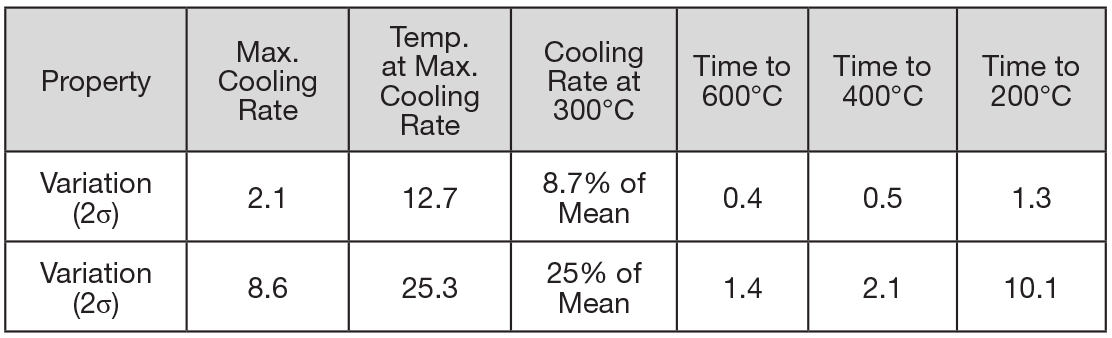
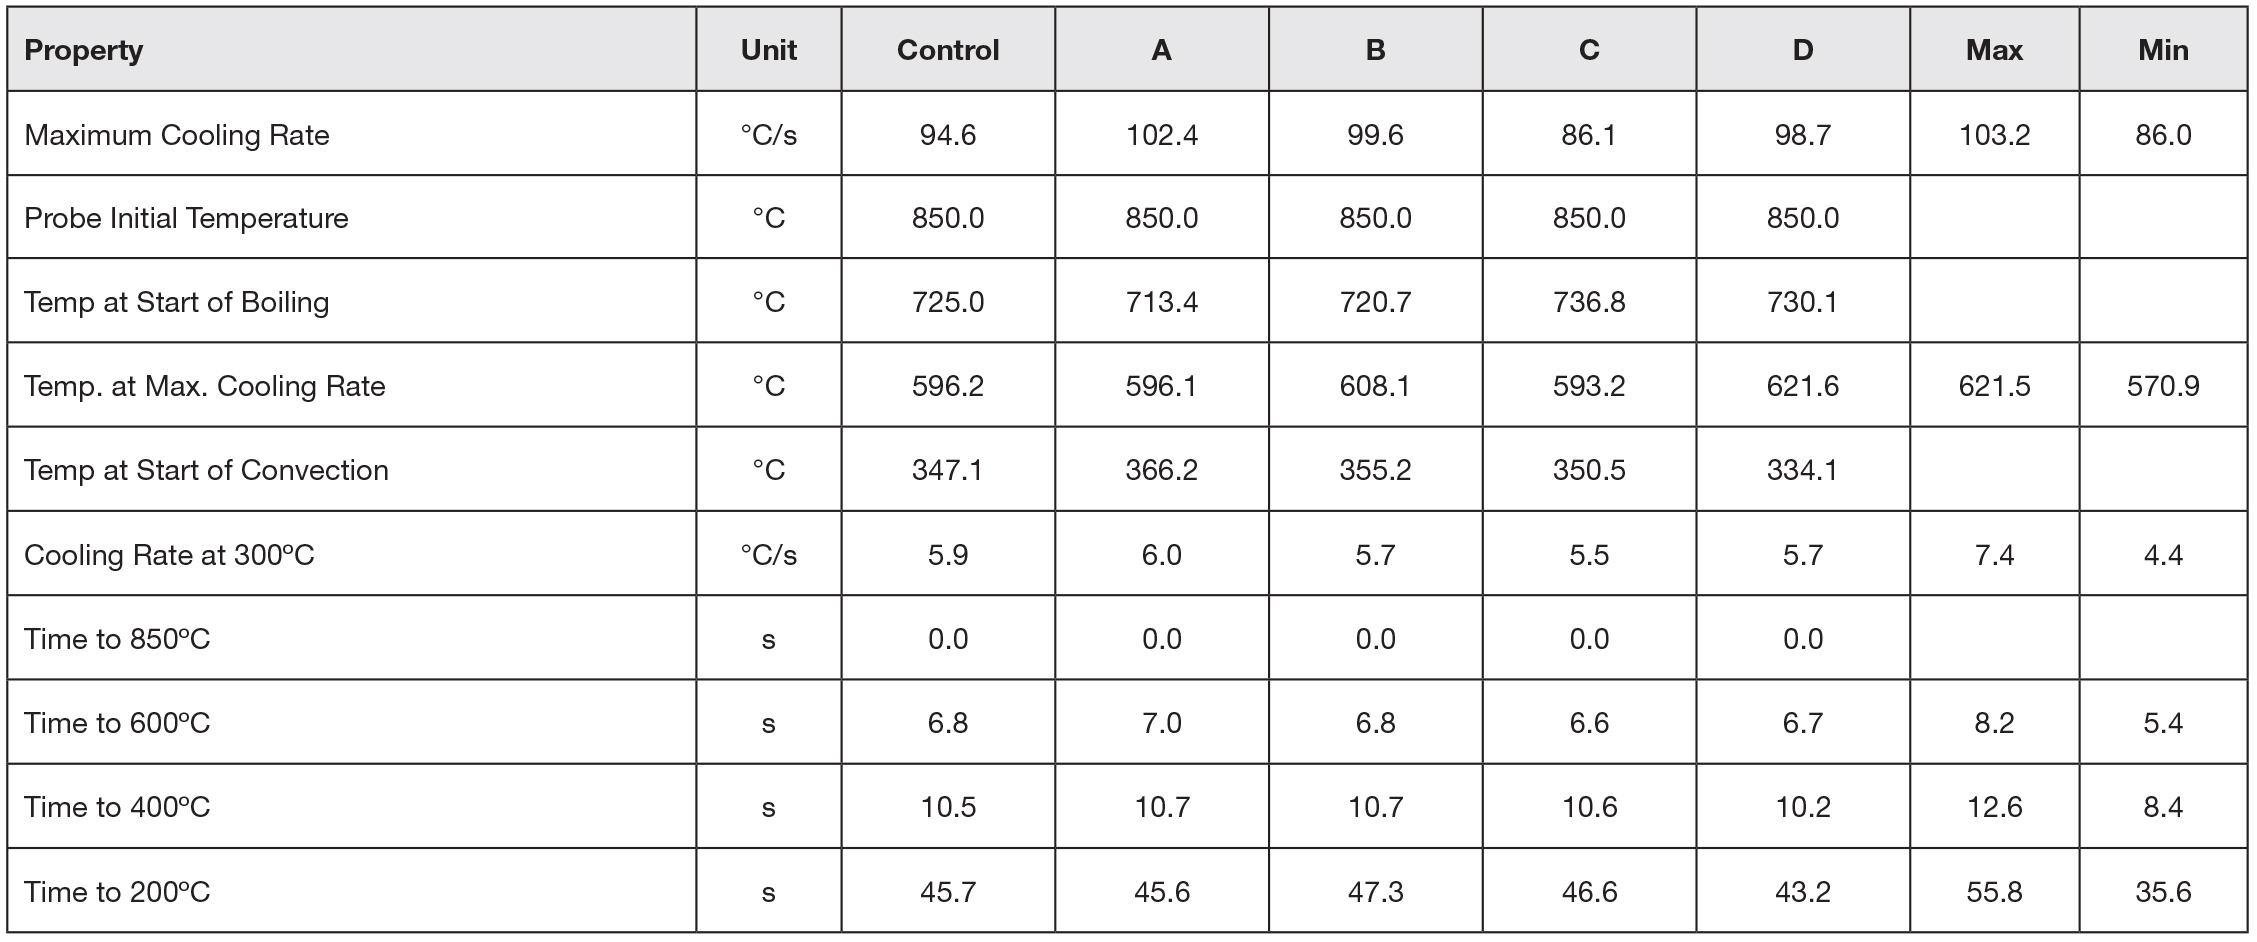
Extracting data from the cooling curve and applying the bias and precision from ASTM D6200, it can be determined if the customer cooling curves meet specifications for new oil. The extracted data is shown in Table 3. Inspection of the data from the cooling curves show that all the customer cooling curve data meets the requirements for new oil. However, customer 3 shows that the maximum cooling rate is a bit slower than the control, but still within the limits of error for the test. If the customer is achieving good hardness during quenching and not seeing a gradual decline in hardness over time, then the oil is acceptable for continued use. However, if the customer is observing a gradual decrease in hardness over time, then it might be appropriate to add a speed improver to his oil to recover the oil back to original specifications.
It is not unexpected that different customers would exhibit different cooling curves for the same oil. These customers use this oil (Houghto-Quench G) in a variety of applications, for different lengths of time, and under different maintenance conditions. None of these customers are reporting problems achieving hardness or properties.
There are multiple reasons why the used customer oils could show a greater scatter. Greater levels of dirt, including soot and scale, could cause differences in the cooling curve behavior of the oils. Further, recycling or recovery of the oil from washers could change the cooling curve. However, fine soot and residual washer residue would likely increase the maximum cooling rate.
This same methodology can be used to select oil for a new application or to replace an existing oil. The cooling curves are compared, and the extracted data from the curves is further compared. Additional information such as oxidation resistance and cost also enter into the decision.
Conclusion
The cooling curve test is a powerful method of examining the entire quench path of the quenchant. It can be used to examine the condition of an oil to ensure that the quenching characteristics are the same as new oil and whether corrective action must be taken.
Many of the latest revisions of specifications, such as AMS 2759 [4] and auditing agencies such as NADCAP [5], require the heat treating quenchant supplier to specify in the report whether the oil is “good” or “bad.” However, the supplier does not completely know the parts processed or the processes used nor does the heat treat quenchant supplier control any of the processes or parameters associated with the heat treating process. The quenchant supplier can only specify whether the used oil satisfies the manufacturing limits for new oil. Working with the customer, these limits can be modified for each application.
References
- Houghton International, Inc., “Houghton on Quenching,” 1991.
- ASTM, “Standard Method for Quenching Time of Heat Treating Fluids (Magnetic Quenchometer Method),” American Society for Standards and Materials, Conshocken, PA, 88.
- ASTM International, Standard Test Method for Determination of Cooling Characteristics of Quench Oils by Cooling Curve Analysis, Conshocken: ASTM, 2012.
- SAE International, Heat Treatment of Steel Parts, General Requirements, Warrendale, PA: SAE International, 2014.
- SAE International, National Aerospace and Defense Contractors Accreditation Program (NADCAP) Requirements for Heat Treating, Warrendale, PA: SAE International, 2008.
- AIAG, Special Process: Heat Treat System Assessment, AIAG, 2011.
- International Organization for Standardization, Industrial quenching oils — Determination of cooling characteristics —Nickel-alloy probe test method, Geneva, Switzerland.
- N. B. Pilling and T. D. Lynch, “Cooling Properties of Technical Quenching Liquids,” Trans. American Ins. Mining and Metallurgical Engineers, vol. 62, pp. 665-688, 1919.
- H. L. Le Chatelier, “Etudes sur la Trempe de l’Acier,” Rev. Met., vol. 1, p. 473, 1904.
- Japan Metal Working Fluids Association, Heat Treating Oil, Japan Standards Association.
- AFNOR, Industrial Quenching Oils — Determination of Cooling Characteristics — Silver Probe Test Method, Saint-Denis: AFNOR.
- Heat Treating Oils — Determination of Cooling Ability, Z8 E 45003, Beijing.
- Laboratory Test for Assessing the Cooling Curve Chacteristics of Industrial Quenching Media, Birmingham: Wolfson Heat Treatment Center Engineering Group Specification, 1982.
- D. L. Moore and D. A. Guisbert, “Influence of Test Conditions on Cooling Curve Data,” in Proc. 14th ASM HTS Conference & Exposition, Indianapolis, IN, 1993.
- D. A. Guisbert, “Precision and Accuracy of the Continuous Cooling Curve Test Method,” in Proc. 16th ASM HTS Conference & Exposition, Cincinnati, OH, 1996.
- ASTM, “ASTM D664: Standard Test Method for Acid Number of Petroleum Products by Potentiometric Titration.,” American Society of Testing and Materials International, West Conshohocken, PA.
- ASTM, “ASTM D974: Standard Test Method for Acid Number and Base Number by Color-Indicator Titration.,” American Society of Testing and Materials International, West Conshohocken, PA.


 general practice for CQI-9 and AMS2750E")


 steels")

