


Vacuum brazing is a black box process, so component distortion that occurs during heat treatment is difficult to prove experimentally. Thus, a novel FE-model was developed in ANSYS Workbench to calculate the time and location resolved component deformation of AISI 316L/B-Ni2 brazing assemblies. In this regard, a new method of radiation and contact modeling was developed that enabled a significant reduction of the calculation times and solved the convergence issue for simulating the distortion of large-scale, thin components. The results showed the component deformation during heating can be easily kept in the elastic range and can be almost completely eliminated by using a geometry-dependent soaking time. In contrast to this, high cooling rates were found to result in thermally induced stresses well above the elastic yield limit, causing significant component deformation. With further cooling, the deformation decreases significantly, but it depends on the initial stress state, the geometry, and the cooling rate whether the deformation can be completely leveled out during the shrinkage of the component. Thus, the initially high cooling rates were identified to be responsible for the final distortion. Furthermore, this was highly affected by the local position in the heating chamber. The simulation results were used to design a fixture for vertical positioning, which reduced the maximum temperature difference in the brazing assembly from 141 to 79°C, the maximum interim distortion from 275 to 31 µm, and the final distortion from 14 to 8 µm.
1 Introduction
There are mainly two application cases in brazing processes, where distortion is evident to the quality of the brazed part. On the one hand, there are assemblies with thin or greatly varying material thicknesses [1,2,3,4]. In addition to this, different materials are frequently used, so that a significant stress level is induced in the brazed part during cooling due to differing coefficients of thermal expansion [5,6,7,8,9]. Examples of this are cemented carbide/steel- and ceramic/steel-joints, in which cracks occur in the cemented carbide or in the ceramic whenever stress conditions are too high, despite the often small joining surfaces [7, 8, 10,11,12]. In addition to processing strategies, such as the use of brazing foils with a ductile interlayer made of copper, simulation-based optimization of the process is usually applied for this purpose [7, 13,14,15,16,17,18,19,20,21]. On the other hand, there are assemblies with integrated cooling channels at the joint level, primarily in toolmaking, for which distortion leads to leakage and thus to the failure of the component [15, 22]. An example that illustrates these relationships quite well is a brazed component from EUV-lithography, which is important to manufacture latest generation semiconductors and CPU cores in the nm range [23]. A copper mirror is joined to a stainless-steel substrate and features an internal cooling channel structure. The component is used to deflect extreme ultraviolet radiation (EUV) of a high-power laser; therefore, it must meet exceptionally high requirements for geometric precision as well as being continuously cooled. Another example is characterized by injection molds, which often have cooling channels integrated at the joint level to enable conformal cooling during injection molding [15].
All these examples illustrate the extraordinarily high demands on the control of component distortion in vacuum brazing processes, which require a lot of experience. Further challenges result from a wide range of influencing variables for distortion and large industrial batches of different components and, in particular, because component distortion cannot be easily determined during the process [24, 25]. From a brazing point of view, component deformation primarily leads to a widening of the joint gap, so that a depletion of the applied filler metal occurs and results in the formation of large cavities in the joint. In the case of the frequently used nickel-based brazing filler metals, the widening results additionally in the formation of continuously pronounced intermetallic phase bands that dramatically impair the joint strength [26,27,28]. In general, such phase bands cannot be avoided in brazing processes of common steels above a gap width of about 50-70 µm while complying with the heat-treatment specifications. Furthermore, the conditions of the components supplied by the user are often unknown with regard to the pretreatment (e.g., cold-, hot-, or cross-rolled, plane grinded, face milled) and the resulting residual stress state for the heat-treatment operation. For financial reasons or material technology (e.g., AISI 316L), not every component can be annealed in a stress-relieved way before joining. Therefore, the residual stress state is expected to be one of the most important influencing variables to be considered in the design of the heat-treatment process. Anyway, the main procedure to control component distortion in practice is characterized by defense heating and cooling rates, which increases the manufacturing time and therefore the costs significantly. The design of the associated temperature-time cycles is usually experience-based and offers a high potential for improvement if the process segments causing distortion can be identified simulatively [29, 30].
The simulation of vacuum brazing processes for specific component geometries is an adequate method to assist the brazer in the design of the temperature-time cycle, the adjustment of the batch size, and the local positioning of individual parts [25, 31, 32]. A particularly valuable advantage of the simulation is the possibility to advise and support the customer already in the design phase of the component with regard to heat-treatment distortion. In this context, a simulation tool is needed that allows moderate calculation times and is, therefore, likely to be subject to some restrictions in terms of accuracy. Nevertheless, such a simulation makes it possible to identify distortion-critical process segments and to evaluate a suitable component position. It also provides an important basis for deriving improvements such as additional loading by weights or the design of a fixture to braze the component with a minimum of distortion. From a research point of view, the finally developed simulation tool will be used to investigate the extent to which full- or partial-surface additional bodies influence the resulting component distortion. The additional bodies are expected to significantly affect the heating and cooling behavior by selectively increasing or decreasing thermal gradients within the component. They, therefore, reduce thermally induced stresses that lead to distortion. For the material selection of these additional bodies, primarily the heat capacity and the thermal conductivity are of interest, while the geometric shape can be freely designed. Before these interdependencies can be investigated, it is necessary to develop the simulation model itself. An initial starting point of the project is based on investigations by Tennenhouse, who stated that the allowed temperature difference ΔT to keep the material distortion within the elastic limit can be calculated by Equations 1-4 where ε is the strain, C the thermal coefficient of expansion, Sy the yield strength, and E the modulus of elasticity [33].


 Based on the mostly known temperature-dependent values of the thermal coefficient of expansion and the modulus of elasticity, an acceptable temperature difference within the component results for each process temperature. That way, the elastic deformation is completely eliminated at the end of the process at zero-temperature difference. At the time this relationship was evaluated in 1971, graphs were derived from these equations manually to design distortion-minimized temperature-time cycles with respect to the material used. Today, this procedure is automatically integrated by the definition of the materials data and multilinear plasticity hardening model in simulation. Determining the values for the plasticity behavior at high temperatures presents a particular challenge, because the yield point, which represents the elastic limit, can generally no longer be determined exactly [34,35,36]. However, it is precisely this material data set that is critical for an accurate prediction of component distortion. Therefore, the definition of the material data is particularly vital.
In this article, the goal is initially given by a new development of an FE-model and the fulfillment of basic requirements to simulate vacuum brazing processes. A key requirement is characterized by a free positioning of one or several brazing assemblies. Therefore, it is not possible to simplify the model using symmetry planes or to use symmetry surfaces as a definition for supports which makes it very challenging to achieve a convergent solution for large brazing assemblies. The novelty of the model is based on a simplified radiation modeling, which enables the usability of real vacuum furnace temperature data as an input variable. Furthermore, a new method of contact modeling will be investigated to enable the free positioning of the components, and thus, the distortion of the brazing assemblies can be analyzed for individual temperature–time cycles and positions within the heating chamber.
2 Materials and methods
In this section, the materials and methods used for the experimental brazements as well as simulations are described in detail.
2.1 Manufacturing process of samples and their geometry
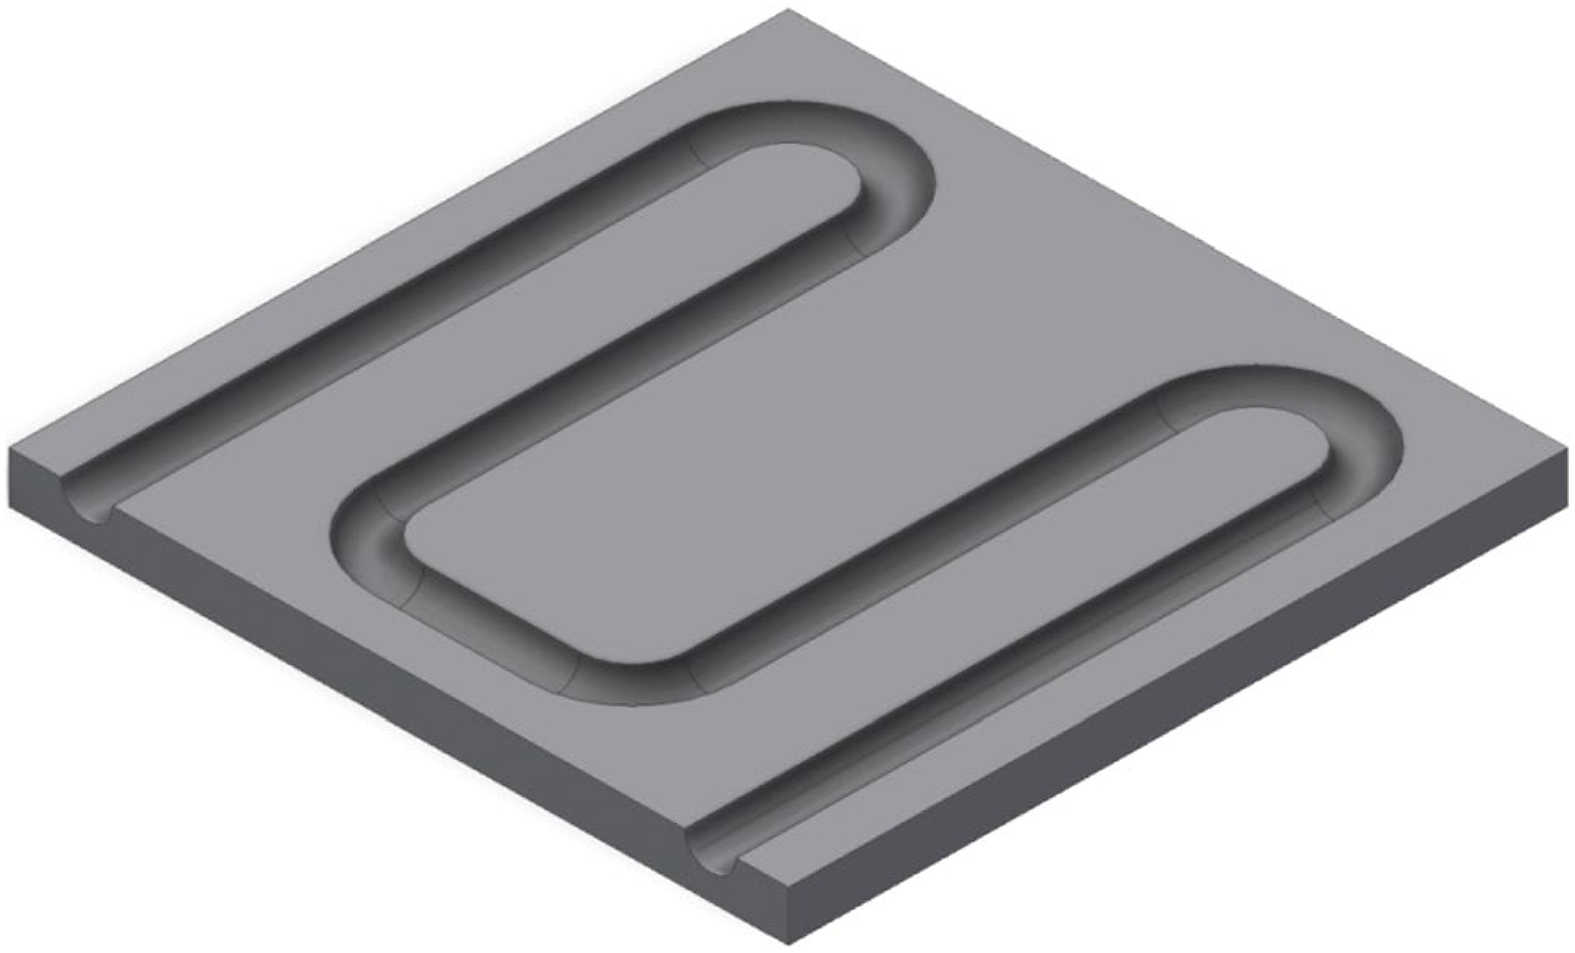
AISI 316L austenitic stainless steel was selected in order to build up the FE-model without an additional microstructural transformation effect. Two different geometries were defined to investigate the two main application cases mentioned in Section 1. For geometry A, a 5-mm-thick hot-rolled plate of size 200↔100 mm will be joined on top of a just 2-mm cold-rolled plate of the same dimension. Because of the requirement to produce a sufficiently large distortion for building up the FE-model, different rolling conditions need to be used. Moreover, hot-rolling processes are typically not applicable to thin sheet metals. The different material thicknesses and the normally unfavorable length-to-width ratio of 2:1 were also specified in order to be able to investigate the effects within the experimental design on the resulting component distortion with certainty. Figure 1 illustrates geometry B for which two hot-rolled sheets of thickness 10 mm and dimension of 150↔150 mm were brazed together to create an integrated cooling channel of diameter 10 mm. The minimum distance between the milled-in cooling channel and the rim of the component is 10 mm, which ensures a leak-tight connection with regular brazing processes.
The samples were cut from the strip by waterjet cutting, and then straightened with roll precision to finally be machine-grinded with a grit size of K240 to an evenness below ±10 µm by Kaiser Präzision GmbH. AMS 4777 (B-Ni2) nickel-based brazing foil with the thickness of 50.8 µm was used from the Prinze&Izant Company for the experimental brazing processes. The amorphous brazing alloy contains mainly 7.0% Cr, 4.5% Si, 3.125% B, and 3.0% Fe with silicon and boron serving primarily as melting point depressants, which enables a melting range of 971-998°C.
2.2 Experimental design
Table 1 illustrates the experimental design that was used to evaluate significant influencing variables on component distortion for geometries A and B. The varied parameters are characterized by the local position in the heating chamber, the temperature-time cycle, and the cooling mode. It should be noted the respective parameters were performed both experimentally and in simulation so the results can be compared in order to adapt the simulation more to reality.
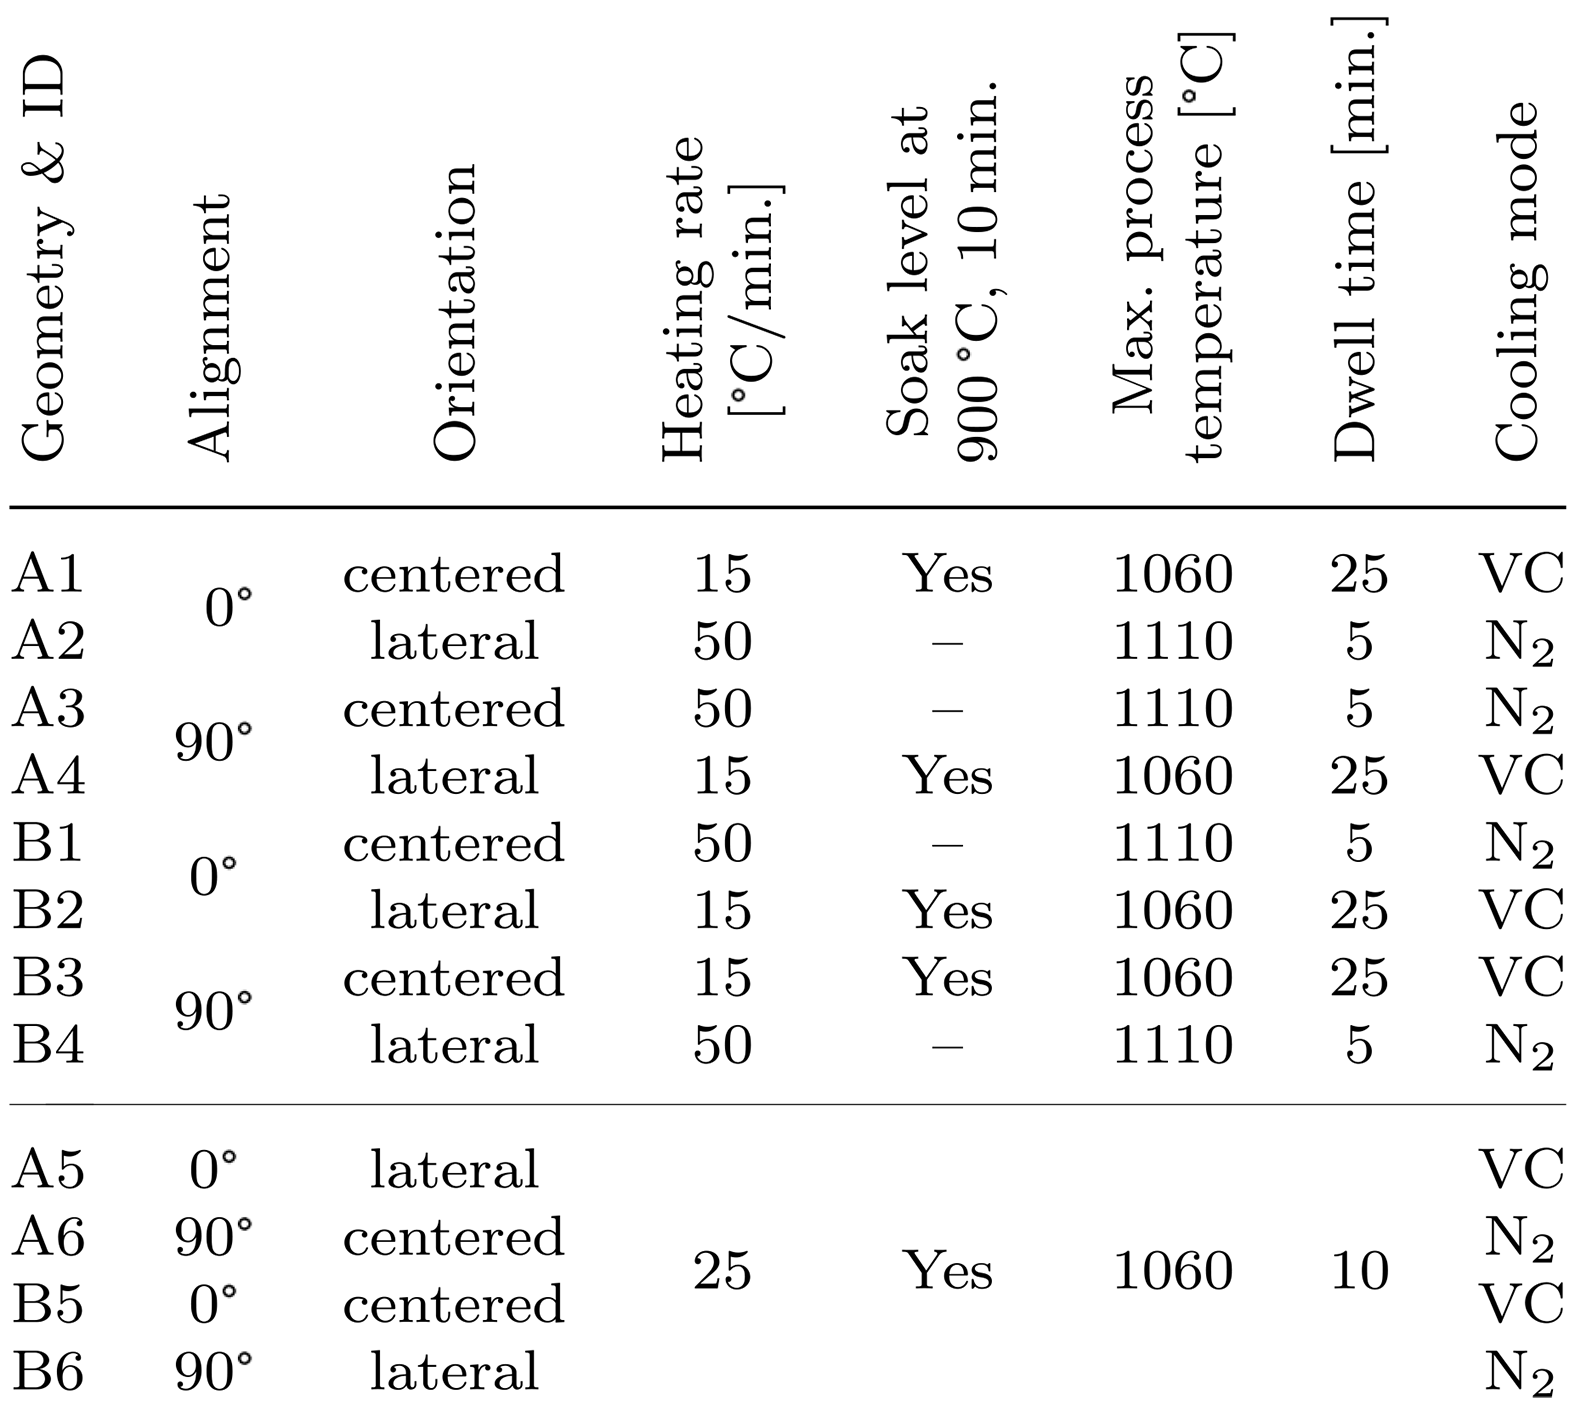
The alignment of brazing assemblies with geometry A is defined as 0° when the longer edge is aligned in the longitudinal direction of the rectangular heating chamber and 90° when the positioning is transverse to it. In the case of square geometry B, the degree represents the orientation of the cooling channel. In addition to this, a lateral orientation designates a local position on the edge of the usable area of the furnace with the smallest possible distance to the heating elements. The heating rates of 15 and 50°C/min were again explicitly chosen higher than usual in order to generate sufficient distortion if this should be characteristic for the respective process segment. Furthermore, the extent to which a soak level (900°C, 10 minutes) affects the stress state of the brazed components was investigated. In addition, the maximum process temperature and the dwell time were varied. Out of the 12 test series shown in Table 1, an additional simulation was carried out for the last four below the line, which was primarily intended to significantly reduce the calculation time.
With regard to the resulting distortion, the temperature is evident because higher temperatures result in higher temperature gradients between the edge and the core of the brazing assembly during cooling. The dwell time probably determines the stress relief, which serves as the initial state for cooling and is then superimposed with the cooling stresses. It is expected that the greatest stresses will occur during the cooling phase, so two different methods were investigated. With vacuum cooling (VC), the heating is switched off, and the batch cools down by thermal radiation losses quite quickly at first and very slowly at very small temperature differences. This is due to the Stefan-Boltzmann equation in which the temperature enters with the fourth power for the emitted radiation. At low temperatures, the radiation losses are quite small and it is time-consuming to cool down the batch completely in vacuum. Overpressure gas cooling with inert gas (e.g., N2) is frequently used for such brazed components to enhance the economic efficiency or beyond that to harden martensitic hardenable steels. In the case of AISI 316L, an overpressure gas cooling is mainly used to avoid a formation of the σ-phase, which affects the corrosion resistance [37,38,39,40,41].
2.3 Stress relief annealing and evaluation of temperature distributions
Prior to conducting the experimental design, a preliminary study was conducted on the effect of stress relief annealing on the resulting component distortion. Stress relief annealing is not recommended for AISI 316L, as it affects corrosion resistance. Nevertheless, a preliminary study was carried out in order to transfer the results to other steels and to evaluate the extent to which stress relief annealing already produces component distortion. For this purpose, three samples each of geometries A with a thickness of 2 and 5 mm and geometry B were annealed at 650°C for 2 hours in the vacuum furnace, which is described in the next subsection. A heating rate of 10°C/min and vacuum cooling were used. Afterwards, the distortion of these samples was compared to the as-delivered condition using a 3D scanning method which is described in Section 2.5. Furthermore, the biaxial residual stress state of the surface was determined for all these samples by X-ray diffraction using a Bruker D8 Advance device. Peak (311) was chosen for the determination of residual stresses because it is at high 2 Θ angles and has a narrow peak width. Furthermore, this peak showed a significant lower texturization than peak (200). Thus, the measurements were conducted at 40 kV and 40 mA with Co-Kα radiation for 2 Θ angles between 108 and 114°, using a step size of 0.1° and a time-per-step of 1 second. Φ was set to the range of 0-45° and Φ to the range of 0-270° with several equidistant intermediate steps.
2.4 Heat treatment and brazing
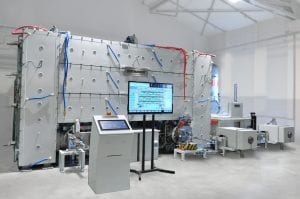
All heat treatments and brazements were carried out using a vacuum furnace of type EU80/1H 2RV from IVA Schmetz GmbH. The heating chamber is rectangular with an inner size of 660 ↔ 430 ↔ 460 mm (l ↔ w ↔ h). The heating elements are made of twisted wires of molybdenum and laid in a meandering pattern in the vicinity of the internal surfaces of the chamber with the exception of the front door and the back. The internal surfaces are made of several thin molybdenum sheets with some space in between, so that a heat distribution within the heating chamber of ΔT ≤ 2°C can be assured for the usable area of the furnace. The outer surfaces of the heating chamber are made of a stainless-steel weld construction, inserted in a double-sided and water-cooled enclosure. Six load supports of Ø16 mm and a length of 230 mm protrude from the bottom of the tubular enclosure into the interior of the heating chamber and are isolated by Al2O3 tubes (Ø22 mm, h = 100 mm, t = 2 mm) on the inside. On top of these supports, three elongated U-profiles of molybdenum are placed, with a size of 550 ↔ 24 ↔ 3 mm each (l ↔ w ↔ t), on which the batch is finally placed on the top of a molybdenum sheet of the size 300 ↔ 274 ↔ 4 mm (l ↔ w ↔ t). The allowed usable area is of the size 350 ↔ 250 mm and is between the centers of the outer U-profiles with regard to the longitudinal axis.
For the control of the max. 80 kW heating capacity, a sheath thermocouple type C (Ø3.2 mm W5Re-W26Re) near the heating wires is used as an actuating variable within the PID-control loop. In addition, six thermocouples type N (Ø1.5 mm NiCrSi-NiSi) can be used to measure the temperature of the batch. Prior to the heat treatments and brazements, the measuring section was calibrated using a loop calibrator of the type DPI 812 device of GE Inc. Subsequently, the six batch elements were inserted 5 mm deep into drill holes of a test sample. The calibration was checked with an experimental furnace run at several temperature levels, which revealed a maximum ΔT ≤ 2°C. To perform the brazements later on, furnace runs with dummy specimens of geometries A and B were first performed with the individual temperature-time cycles and the local position of the brazing assemblies with respect to Table 1. Thereby, three thermocouples were placed into the upper part and three into the lower part of the brazing assembly at the center, the edge, and the center of the longitudinal edge. This is necessary because program control according to the batch temperature leads to different process times depending on the positioning of the components. Afterwards, the brazements were conducted based on these individual temperature-time cycles and controlled only by the heater thermocouple. This way, the brazing assemblies were not affected by the drill holes for the batch thermocouples.
2.5 Optical 3D measurement of distortion
The measurements for the distortion of the components were carried out on the top side of the heat-treated samples and the brazed components with the optical 3D measuring system ATOS II Triple Scan from Carl Zeiss GOM Metrology GmbH (accuracy 20–62 µm). Several measuring marks were stuck on the top surface. Then, AESUB-Blue-Scanning spray was thinly coated on top of the component’s surface and the edges. Afterwards, the component was placed on a rotating plate with additional measuring marks. Within the scope of the measurement, seven individual measurements were taken from each of two different angles. As a result, a polygon-shaped surface can be calculated from the single measuring points. This surface was superimposed using a 3-2-1 best-fit-method to an ideal even surface of the same dimension. It was constructed by CAD in GOM Inspect software. This allows the deviation of the two surfaces to be determined (distortion), visually displayed with false colors, and locally evaluated numerically. It is generally more useful to scan the component before and after heat treatment and to compare the respective measurement data directly with each other. Due to the significantly lower measurement effort and a basically identical pretreatment of the components by surface grinding, a super-imposement by CAD ideal bodies was selected. The measuring time can be estimated at merely 2 minutes, while about 15 minutes per component were needed for the data processing.
2.6 Sample preparation for metallographic investigations
Following up on the brazements and the 3D scan of the upper surface for the judgment of the component distortion, an ultrasonic C-Scan was carried out in water on a LS-100 machine from Inspection research & Technologies Ltd. An amplification of 34.4 dB and a scan speed of 10 mm/s was used with a V317 immersion transducer of Olympus Europe SE & Co. KG running at 20 MHz. Based on the C-Scan, characteristic positions for the preparation of metallographic cross sections were determined. Five segments were cut out for each brazed component using a Mecatome T330 cutting machine along with the joint at each outer edge and for the center of the component. Afterwards, these samples were embedded in epoxy resin, grinded, and finally polished with a diamond suspension of 1 µm to reveal the microstructure of the joint. The samples were then cleaned in an ultrasonic bath using ethanol and dried with warm air.
2.7 Development of an FE-model for vacuum brazing
This section exclusively describes the final developed model and additionally explains the most important aspects to be considered when thermal radiation is investigated in brazing simulations. The FE-model was created with ANSYS Workbench 2020 R1 and calculated by an Intel i5-8400 CPU running at 2.8 GHz as well as 128 GB random-access memory. The FE-model allows to consider real heating and cooling rates of a vacuum batch furnace and enables a free shape as well as a free alignment of the components within the heating chamber. The brazing processes were simulated and analyzed individually by a thermal-transient and a structural-transient analysis. For this purpose, the vacuum furnace described in Section 2.4 was used as the basis for building a completely new FE-model. The following describes the development of the model in detail.
2.7.1 Simplifications
With respect to the calculation times, some simplifications were made for the model. Previous simulation results prove it is not necessary to include the water-cooled enclosure in the model. It is sufficient to set a time-dependent temperature specification on the bottom side of the cylindrical load supports. In addition, instead of modeling the geometrically complex molybdenum wire heater, the entire inner surface of the heating chamber can be defined as heating surfaces. The material properties of the brazing alloy AMS 4777 were specified in the technical data by those of pure nickel, since no sufficient data exist for the brazing alloy. The brazing alloy remains in the solid state in the simulations performed, so there will be a change in the contact condition prior to the cooling segment. This implies the model cannot initially be used to investigate the widening of the brazing gap, which was derived from the deformation of the component surface instead. For simulations with overpressure gas cooling, a temperature-dependent heat-transfer coefficient is specified instead of a computational fluid dynamic simulation (CFD). The heat transfer coefficient α was deviated from technical literature with respect to the pressure and the estimated flow velocity [42]. Only two of the three possible U-profiles were used in both the experimental and simulation, so the influence of the local position can be investigated first in this study.
2.7.2 CAD modeling of a vacuum furnace
The individual parts of the FE-model were constructed according to the real dimensions of the heating chamber of the furnace described in Section 2.4 using the CAD-software Inventor professional 2019 from Autodesk GmbH. In Figure 2, the CAD-Model is shown with the front and one side of the heater surfaces blanked out for reasons of presentation.
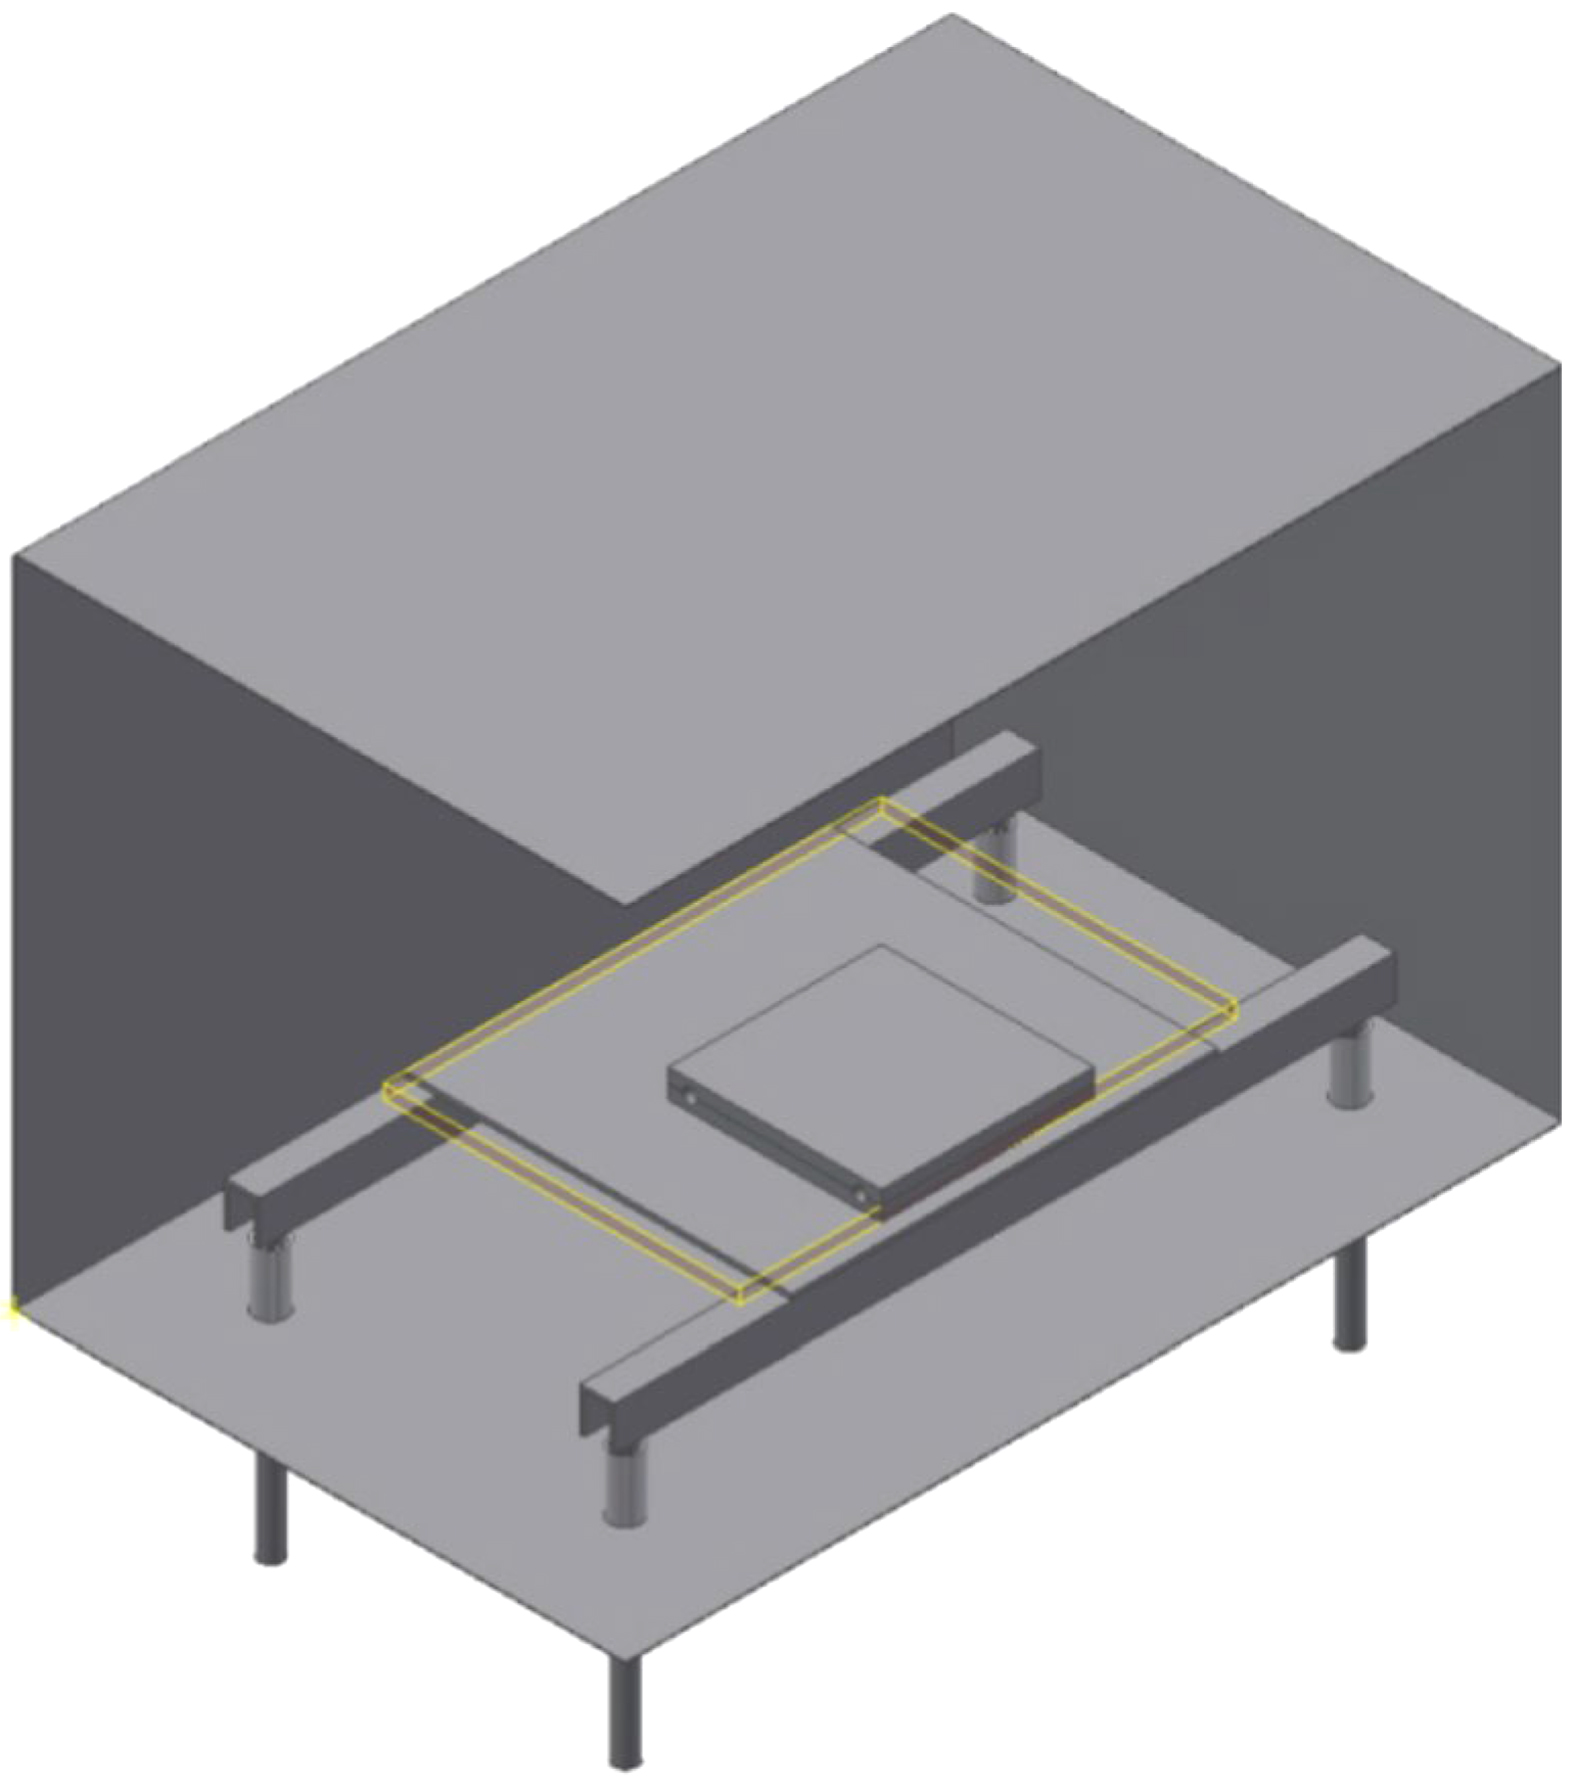
There are some important aspects to consider when assembling the single parts, if thermal conduction and thermal radiation are involved in the simulation. The most important one is the batch and its support are geometrically decoupled from the heating surfaces. This ensures the heat from the heating surfaces is introduced into the batch primarily by thermal radiation and not by thermal conduction. As a result, a small error in the calculation of the view factors in the perfect enclosure type, which was applied later in the simulation, is present. It is still minimized by the insulating Al2O3 tubes and can be considered as negligible. In addition, the designer must consider those surfaces or parts of surfaces that are subjected to thermal radiation can be selected individually. The best way to achieve this is given by the Design Modeler CAD-software included in ANSYS Workbench, in which the surface separation tool can be applied. The six faces of the rectangular heating chamber are connected to each other by the inner corners and inner edges. This offers the advantage that the non-heated surfaces of the front and rear sides are in contact only at one node or node line in the FE-model, thus reducing the influence of heat conduction.
2.7.3 Technical data and meshing
The second step after the construction of the CAD-model is to set the technical data of the materials used in ANSYS Workbench. To calculate the temperature distribution in thermal-transient analysis, the density, the thermal conductivity, the specific heat capacity, and the emissivity of the respective materials are required. For the subsequent calculation of the deformation in the structural-transient analysis, the coefficient of thermal expansion, the Young’s modulus, the Poisson’s ratio, the strain at failure, and the tangent modulus are necessary. Most of the required material data sets are documented in the ANSYS Granta Selector software as well as in additional technical literature and were imported to ANSYS Workbench. In some cases, the data sets were extrapolated to ensure this spanned the entire temperature range to be investigated within this study. However, a particular challenge exists for the yield strength of the material AISI 316L, which can only be found in the literature up to 870°C and cannot be clearly determined experimentally. Above this temperature, the yield strength was estimated by a factor of 0.35 for the tensile strength, which is significantly reduced in the temperature range of 870-1,100°C from 183 to 23 MPa [34, 35]. Because of these very low strength values and the fuzzy definition between the elastic and plastic material behavior, a precise calculation of the deformation behavior is an extremely challenging task.
If possible, the meshing was performed by the sweep method, using the following element sizes: heating surfaces, 50 mm; load supports, 8 mm; U-profiles and support plate, 10 mm; AISI 316L geometry A, 1.5 mm; AISI 316L geometry B, 5 mm; and brazing filler metal, 1.5 mm. A very coarse meshing was chosen for the heating surfaces since a temperature specification is made for them in the simulation. In contrast, all contact surfaces and the surfaces of the joint were meshed relatively finely. In order to be able to simulate bending and thus the deformation of the component, two divisions in the material thickness were used for the components of the brazing assembly.
2.7.4 Conditions of contacts and definition of load steps
Almost all contacts were defined as symmetric and frictional using a friction coefficient of 0.15 as well the Augmented-Lagrange method using the adapt to touch option for the initial contact elevation. For the joining surfaces, an additional contact was created as a bond. Furthermore, within the structural-transient analyses, a contact type of no separation was used in the heating phase for the contacts of the brazing assembly. It is highly recommended to check the initial contact finding status with the contact tool to proof the accuracy of the imported CAD-data. The load steps were defined in the settings of analysis for the thermal-transient and structural-transient analysis identically. Three load steps were defined, with the first load step mapping the heating segment and calculated with a step size of 60 seconds. The second load step represents the first part of the cooling phase, in which very high rates of cooling are present, so that this step was calculated with a step size of 10 seconds. The third part has comparatively low rates of cooling and was calculated with a step size of 60 seconds. In detail, the third load step was set to begin at 400°C of the heater temperature for processes with vacuum cooling and at 100°C for processes with overpressure gas cooling. Contact step control was added to the structural tree of both analyses for each of the joint surfaces, so at the beginning of the cooling phase, the frictional or no separation contact was deactivated and the bonded contact activated.
2.7.5 Definition of thermal radiation and convection
Based on the brazing processes actually carried out, the temperature of the heater thermocouple was used as the temperature specification for the four heating surfaces in the simulation by using a surface-to-surface type of radiation in a perfect enclosure. An emissivity of one since the reflective part of thermal radiation is already considered by using real process data. In contrast to this, all other surfaces, which are no contact surfaces, were defined using a temperature-dependent emissivity of the individual material. The outer surfaces of the heating chamber were set as perfectly insulated, while the part of the load supports outside radiates to the ambient temperature. For processes with overpressure, gas cooling convection was defined in addition using 5.0-5 W/mm2 °C as heat transfer coefficient.
2.7.6 Structural-transient analysis on thermal-transient results
It was very beneficial to duplicate the calculated thermal-transient project and to then set a structural-transient analysis for the first three entries. After that, the solution of the first thermal-transient analysis can be placed on the setup of the structural-transient analysis to import the results. Due to this procedure, it is possible to suppress the components of the heating chamber and the supports in the duplicated project so the calculation time is extremely reduced for the structural-transient analysis while the solution of the thermal-transient analysis is still available. It is important to set the source time of the imported component temperatures to all.
2.7.7 Support conditions and convergence behavior
The definition of supports as boundary condition is highly challenging when handling such large surfaces. The main problem is characterized by an achievement of the convergence behavior by the solver, since it is allowed in simulation that the components can penetrate into each other as a function of the contact stiffness. Particularly for components that bend, there is the problem either that the component is not allowed to penetrate far enough into the surface of the support, so the stresses in the component cannot be transferred into deformation, or it penetrates too far and cannot be pushed back. In both cases, the simulation aborts and no sufficient solution is obtained. To solve this problem, first the bottom surface of the brazing assembly is defined as a support only due to compression. This forms an imaginary support plate, where the component is allowed to penetrate it slightly and to lift off from it completely. A manual contact stiffness of 0.1 was defined for this support, and it is crucial to update this factor for each iteration. In addition, the option “weak springs” was activated beyond the gravitational force so the component is restricted from floating into the space. It is highly important to track the computation of the solution when building such a simulation. Therefore, the number of the Newton–Raphson residue and the number of element violations should be set to three within the solution information. This results in a visualization of the last three solution steps before the non-convergent solution. This way, locally unresolvable stress states can be identified and possibly already solved by a refinement of the local mesh. Furthermore, for large areas, it is essential to manually increase the allowed number of iterations of the solver from fifteen significantly, which is implemented with the APDL-programming command “NEQIT, 100.”
3 Experimental results
In this section, the results of the real brazements are explained.
3.1 Assessment of the initial state
The required roughness of the joining surfaces transverse to the grinding direction of ≤ 6.3 µm could be met and was proofed by three samples of each geometry. Furthermore, the specified evenness of these components below 20 µm could be confirmed by optical 3D measurement. It should be noted that, due to the manual spraying of the scanning spray, a systematic deviation of up to 10 µm is possible, especially at the component edges. The measurements on the residual stress state showed that there are mostly compressive stresses in the range of minus-350 to minus-550 MPa in grinding direction whereby transverse values are lower by more than half.
3.2 Effect of stress relief annealing on the evenness and the residual stress state
No distortion was found for the stress relief annealed samples. Accordingly, this part of the heat treatment is not critical, at least if the stresses present in the as-delivered condition are not exceptionally high. It was proven the residual stresses near the surface could be reduced by half compared to the initial state.
3.3 Distortion of brazed components
For some of the brazements performed, significant component distortion was detected by optical 3D measurement. Figure 3 illustrates the distortion of the brazed component with ID A2 as an example, which showed one of the highest distortion of all samples.
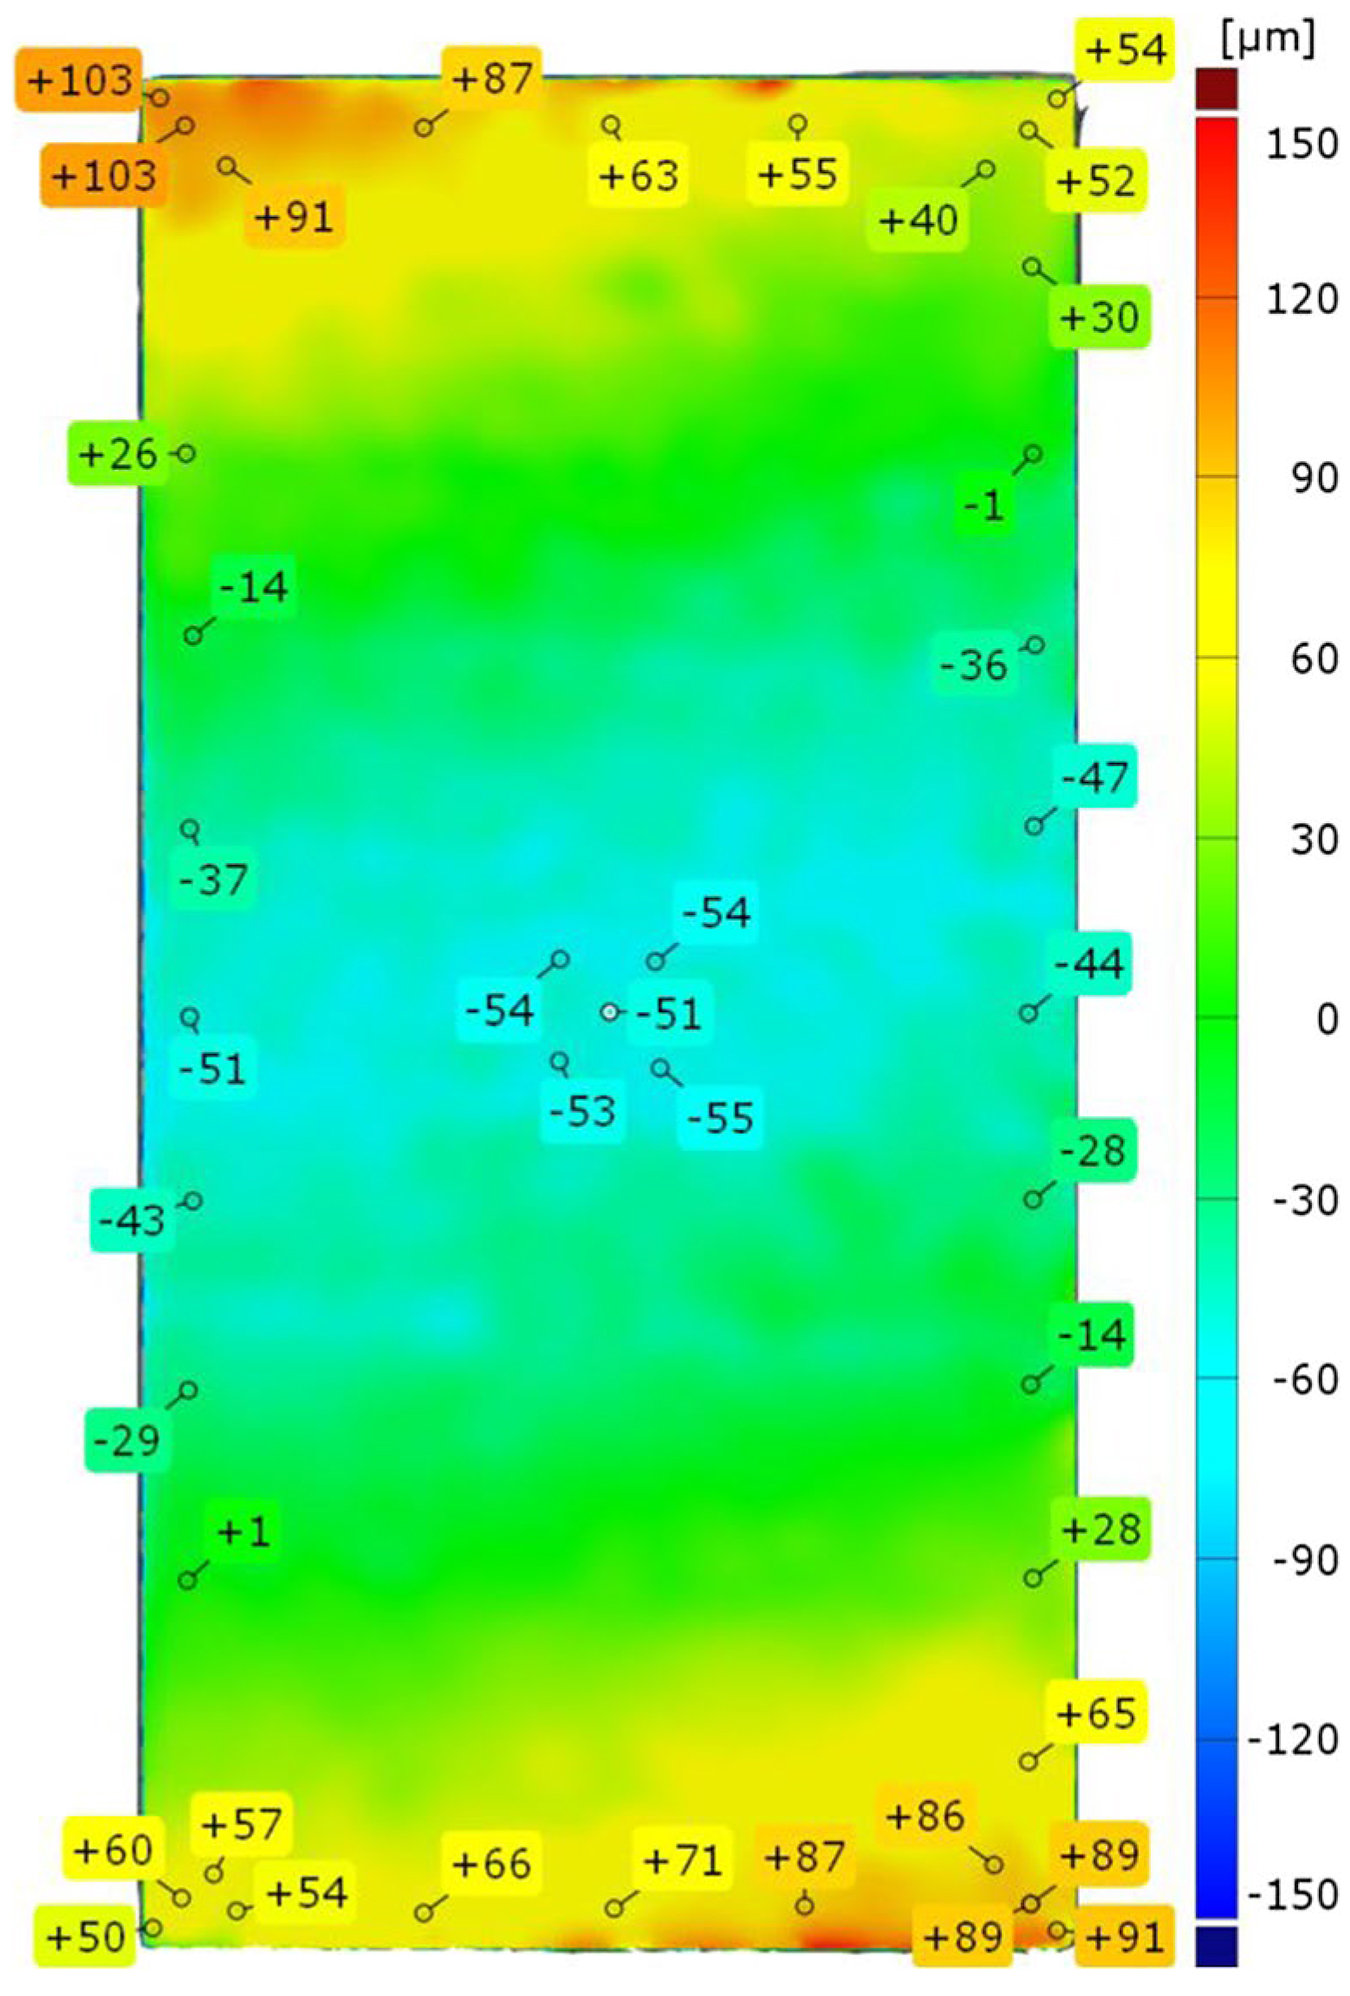
It is clearly visible that the top surface of the brazed component was significantly distorted or respectively bent around the shorter center axis. The negative values result from the best-fit with an ideal CAD-plane. Therefore, the maximum total distortion of sample A2 can be indicated to be about 150 µm. Most of the other samples revealed much less distortion, which, unfortunately, could be not traced back to critical brazing parameters, the cooling mode, or the local position as well.
3.4 Metallographic inspection
The ultrasonic C-Scans of the brazements revealed all the joints of the processes with an overpressure gas cooling were locally insufficient so, e.g., no connection was present in the vicinity of the cooling channel. The analyses of the cross sections for these parts showed the main reason for this was a significant widening of the brazing gap from initially 50 µm up to about 200 mm in the worst case, so there was not enough braze metal to fill up the gap. Due to the morphology of the residues of the braze material, it can be assumed, additionally, there was still a part of the braze in the liquid state. The processes with a heating rate of 50°C/min showed a significantly higher flow behavior of the braze and thus a reduction of the brazing gap to about 25-30 µm compared to the processes with 1 °C/min. Figure 4 illustrates a characteristic joint of sample A1 of the longitudinal edge of the component.
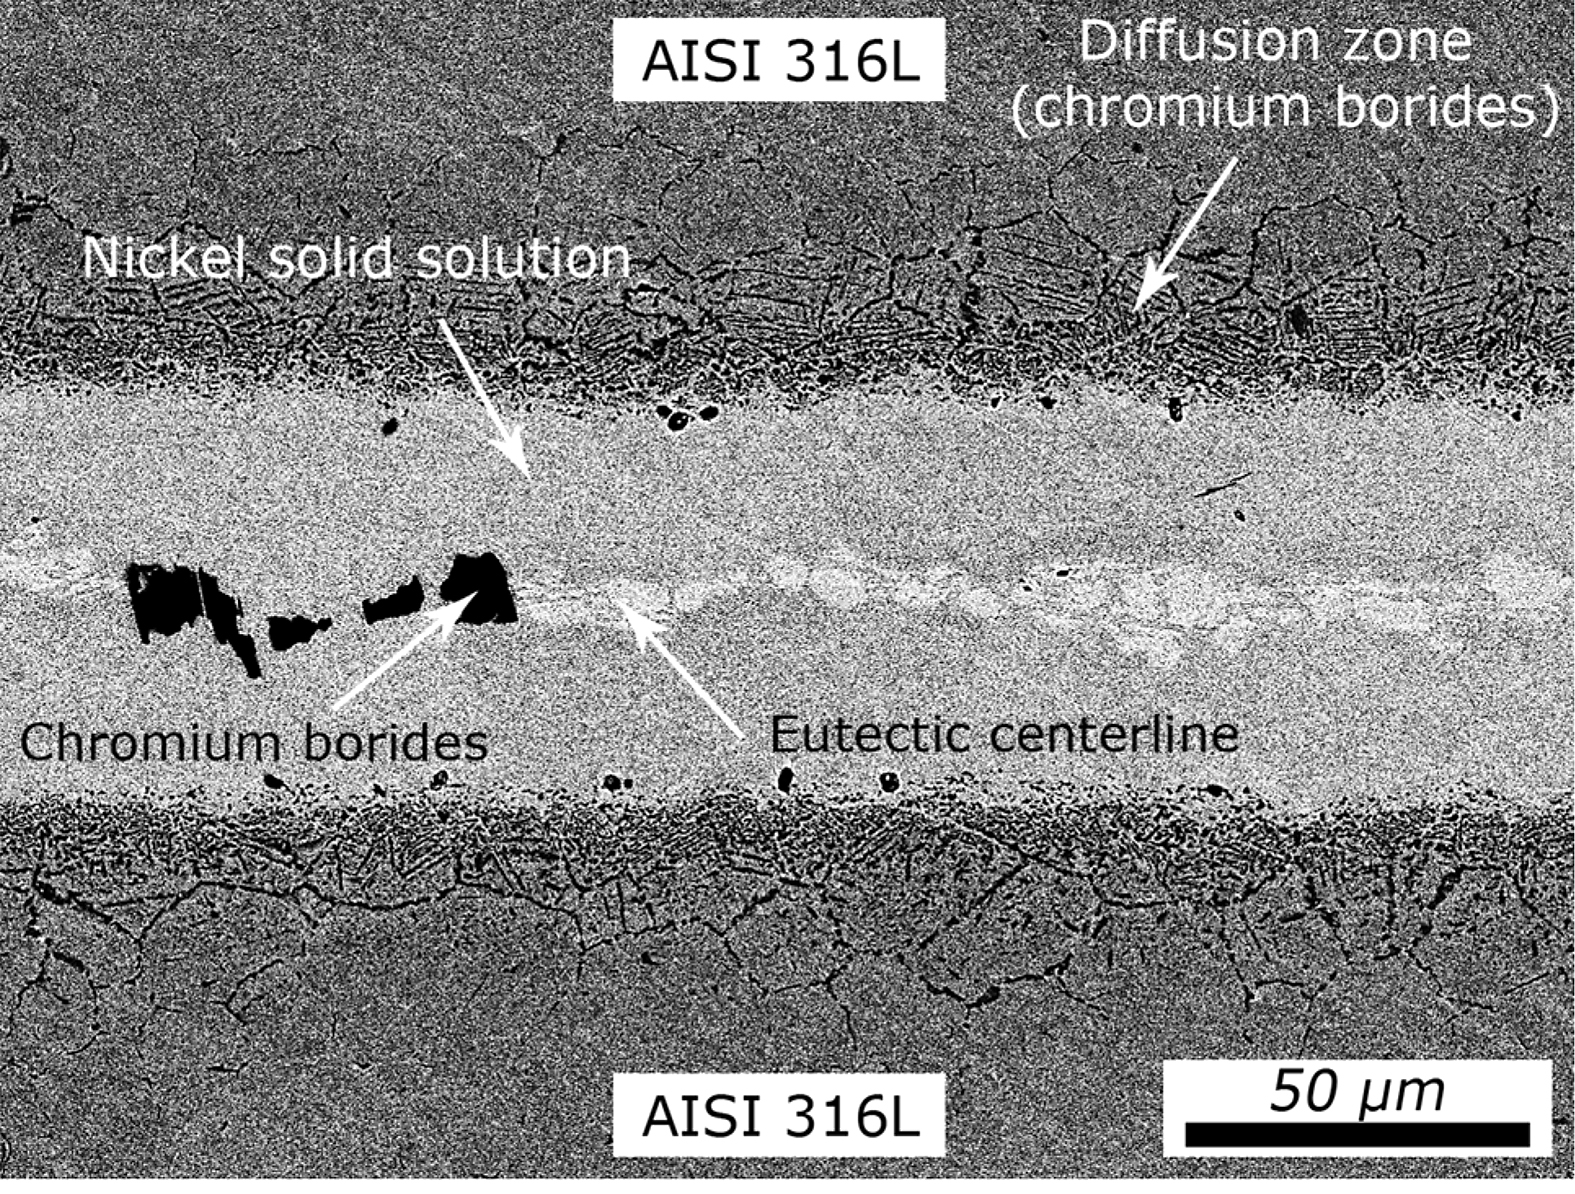
The thickness of the brazed metal was measured to 57 µm, and between the nickel-solid solution phases, there is a continuously pronounced phase band in the center of the joint, which consists of black colored chromium borides and light-gray colored eutectic phases. The formation of these highly brittle phases is generally increasing with the gap size and indicates insufficient temperature-time cycles for diffusion of silicon and boron into the base material.
4 Simulative results
In this section, the results of the thermal-transient and structural-transient simulations are explained.
4.1 Heat distribution in the brazing assembly
The results of the thermal-transient analyses showed a strongly pronounced dependence of the temperature distribution in the brazing assembly on the local component positioning and the process parameter used. The temperature specification of the heating surfaces based on the respective furnace process data from Section 3 represented the real heating behavior of the heating chamber and the components inside quite well, which will be explained in more detail later (Section 5.2). Figure 5 illustrates the temperature distribution during the heating of the brazing assembly, taking into account the surrounding supports (upper image) and of the brazing assembly itself in more detail (lower image).
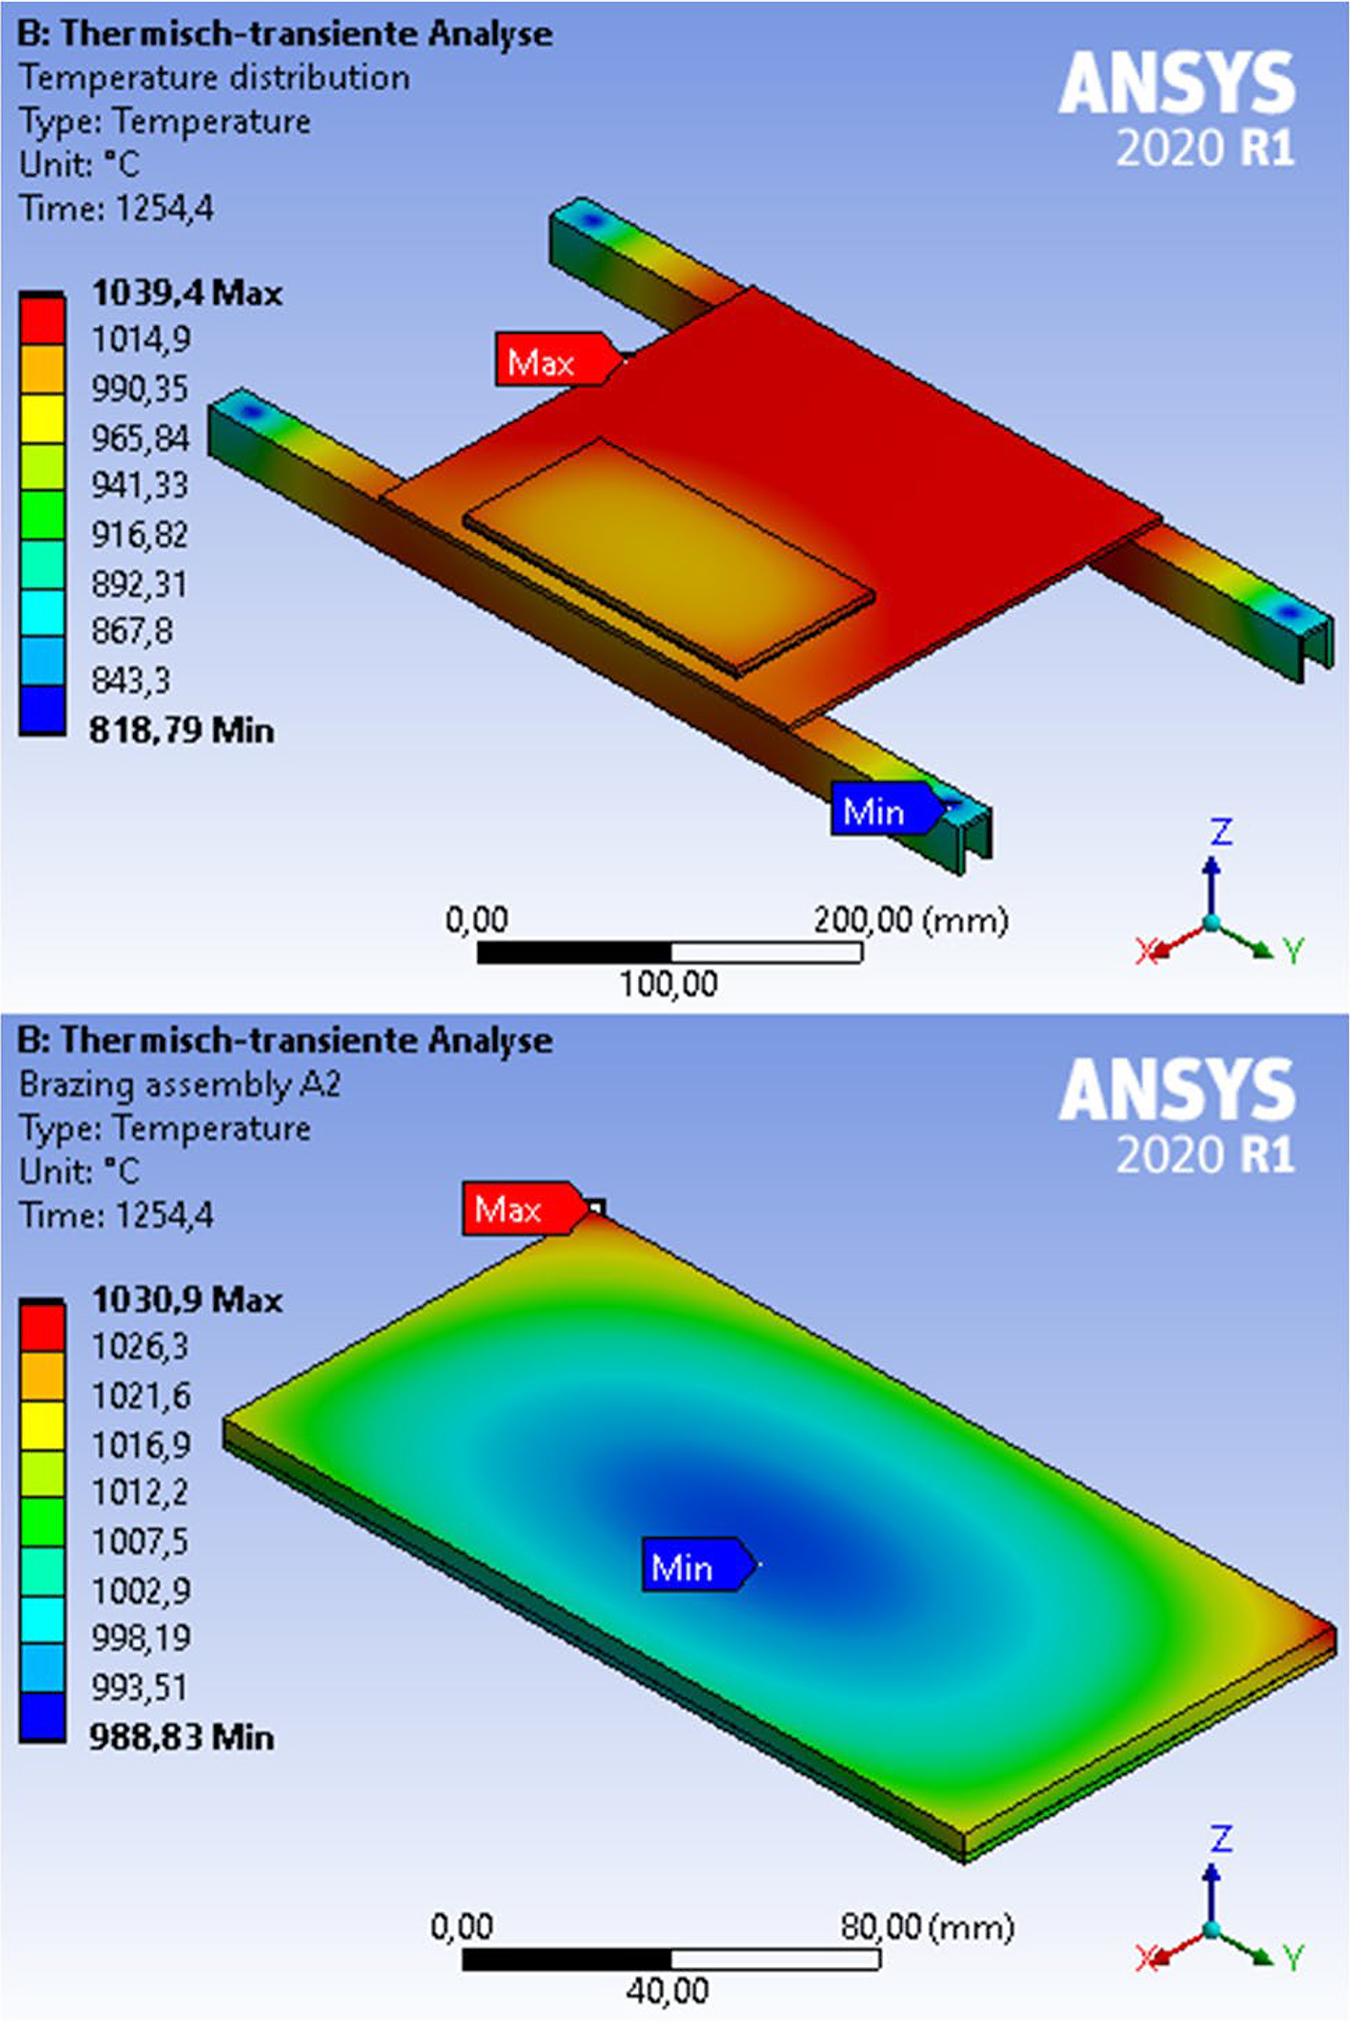
It was found the four load supports (blanked out) at the end of the U-profiles act as a heat sink. Furthermore, the shading of the brazing assembly due to a partial overlap with the U-profile leads to a stronger heating of the assembly on the opposite side. This is especially the case at the edges that represents the maximum temperature. The temperature field is elliptical with the minimum temperature on the bottom side so a maximum temperature difference of 42°C is present at this time step within the brazing assembly. At the end of the heating, all components of the experimental design were almost completely soaked and corresponded to the heating temperature with a few degrees’ deviation. As expected, the largest temperature differences were found in the cooling phase, which will be explained in more detail in the next section.
4.2 Cycle-dependent component distortion
The analyses of distortion in the structural-transient simulation were carried out on the top surface of the upper body (UB) and the lower body (LB) of the brazing assemblies. Therefore, the maximum and minimum of the displacement to the Z-axis, which is normal to the particular surface, were used so that the deformation can be calculated (Δzmax) for each step without the effects of general thermal expansion. In addition, these results were correlated manually to the simulated temperatures (max./min.) as well as to the real temperature of the batch thermocouple from the furnace run. Figure 6 shows an exemplarily graph for ID A2.
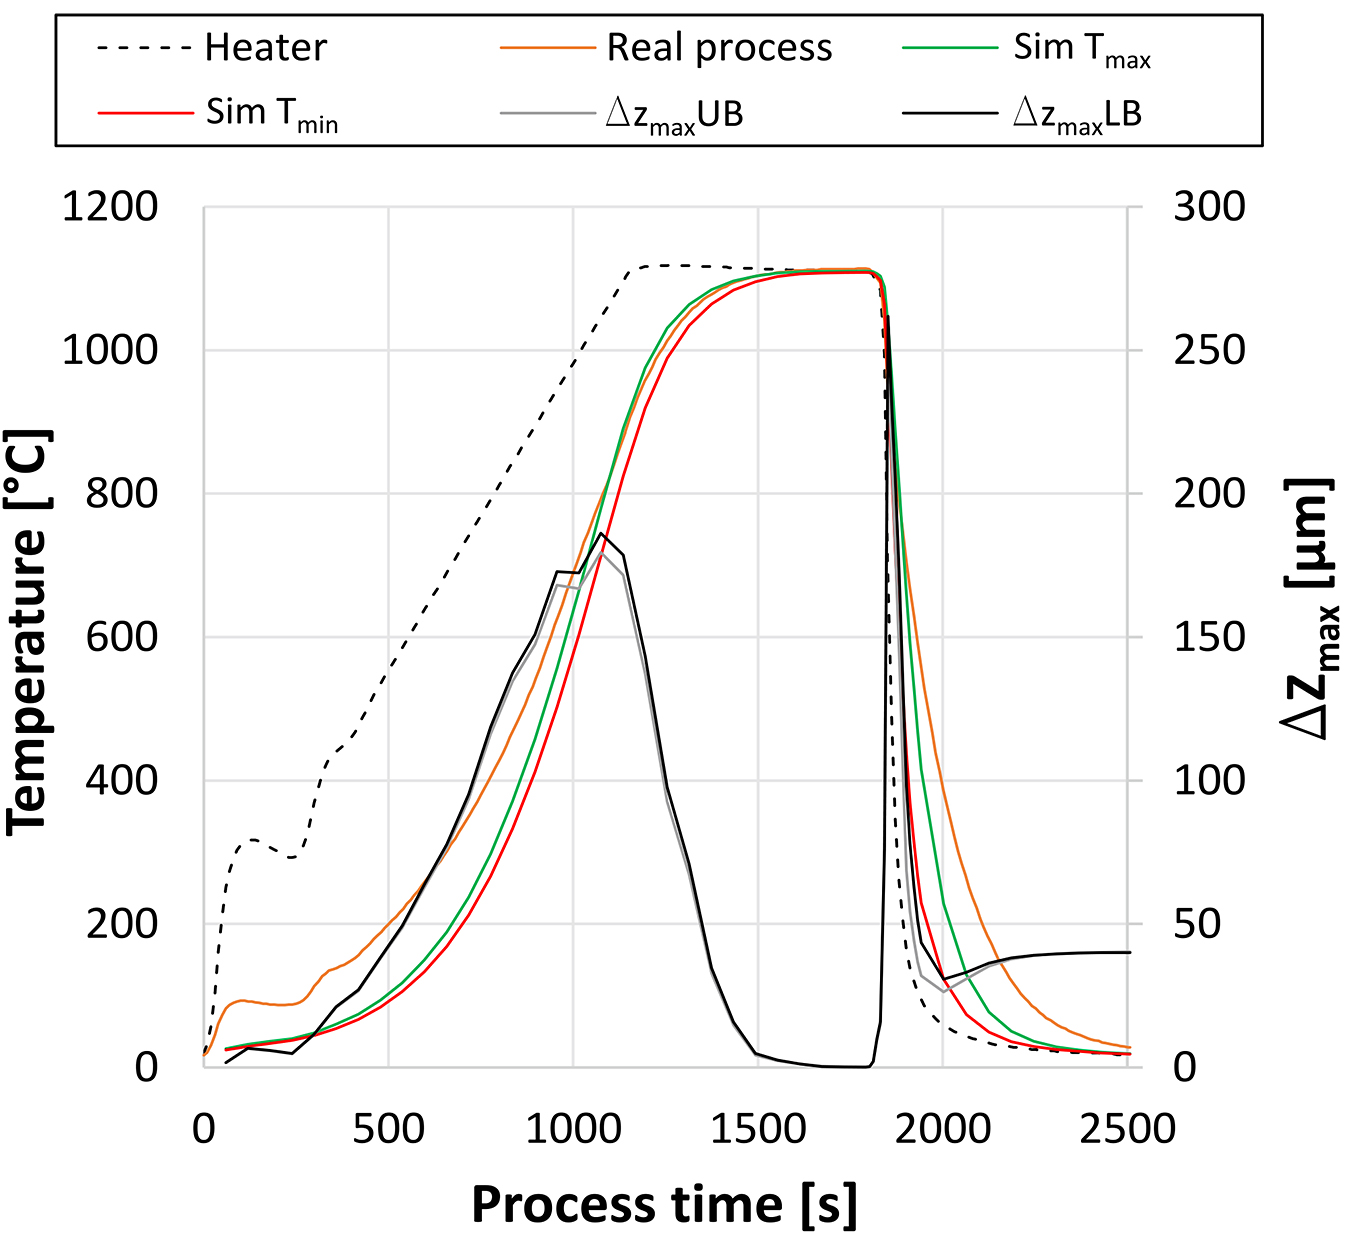
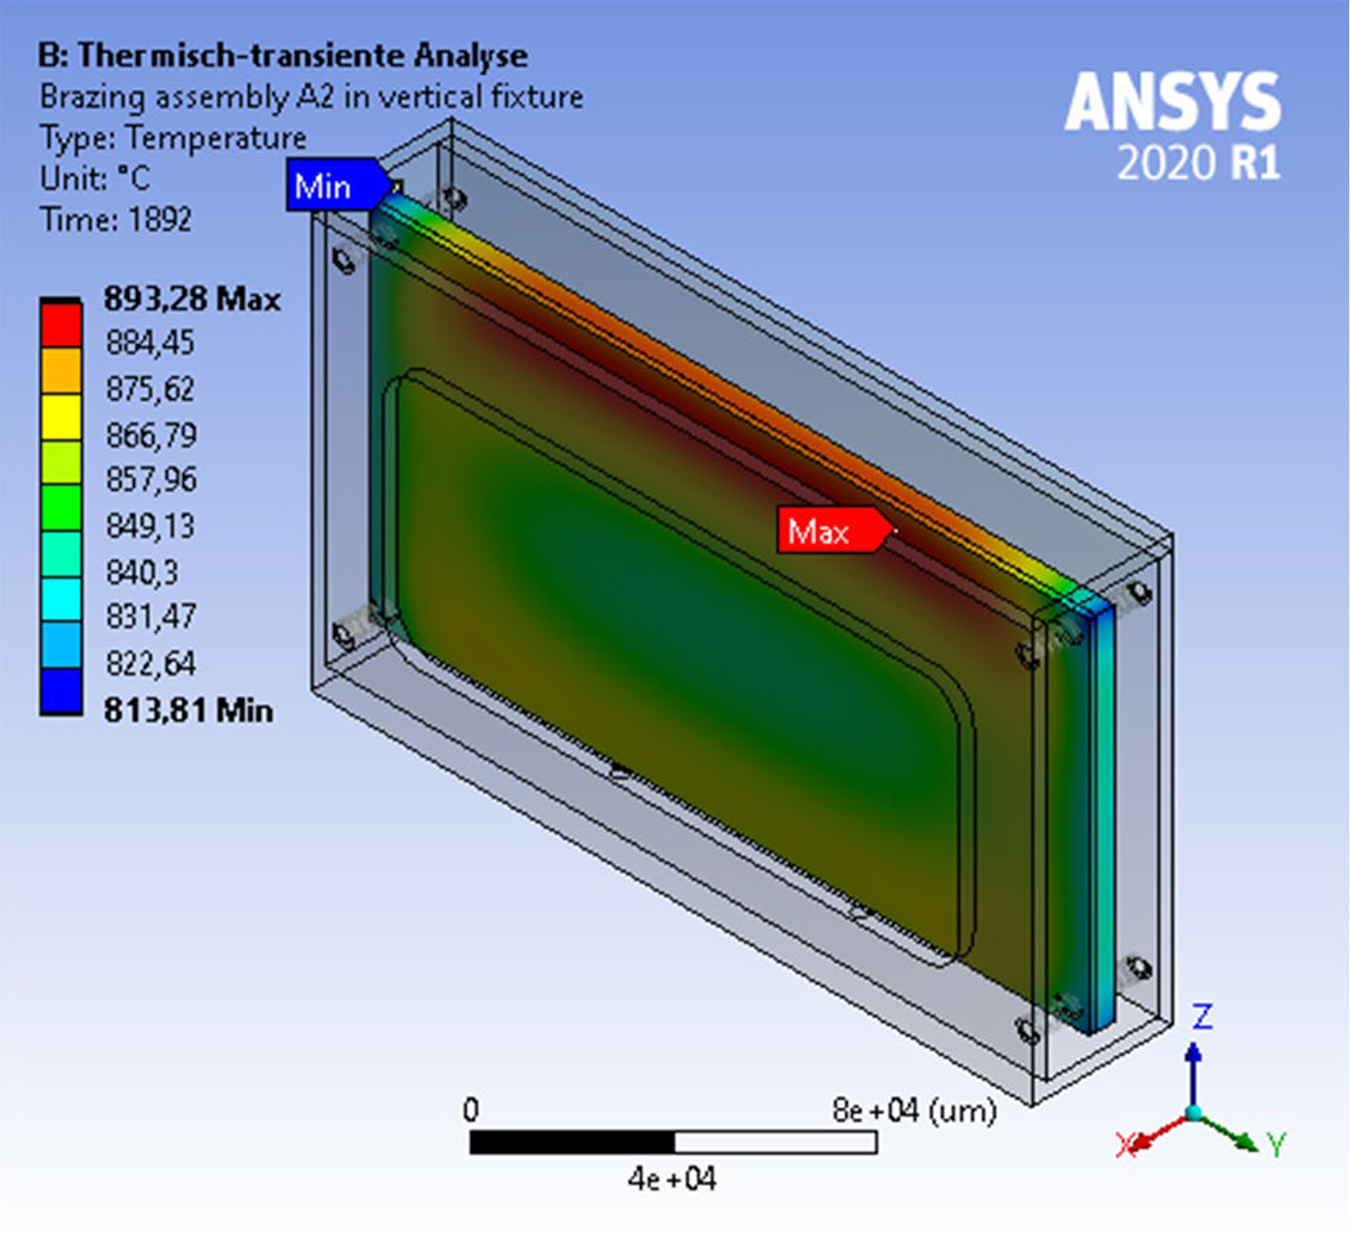
It can be seen the simulated temperatures overall match the real temperature of the batch quite well, but below 700°C, the deviation was still slightly too large during both heating and cooling. However, it was found that, during heating, the brazing assembly was significantly deformed up to 180 µm, which was completely leveled out at the end of the soaking time. At the beginning of the cooling phase at which the contact was changed to compound, there was sharp increase of deformation up to 250 µm following a brief decrease, but 40 µm distortion remained at the end of the process. Figure 7 shows the results of the thermal-transient and structural-transient analysis for the time step of maximum deformation for brazing assembly A2 during convective cooling.
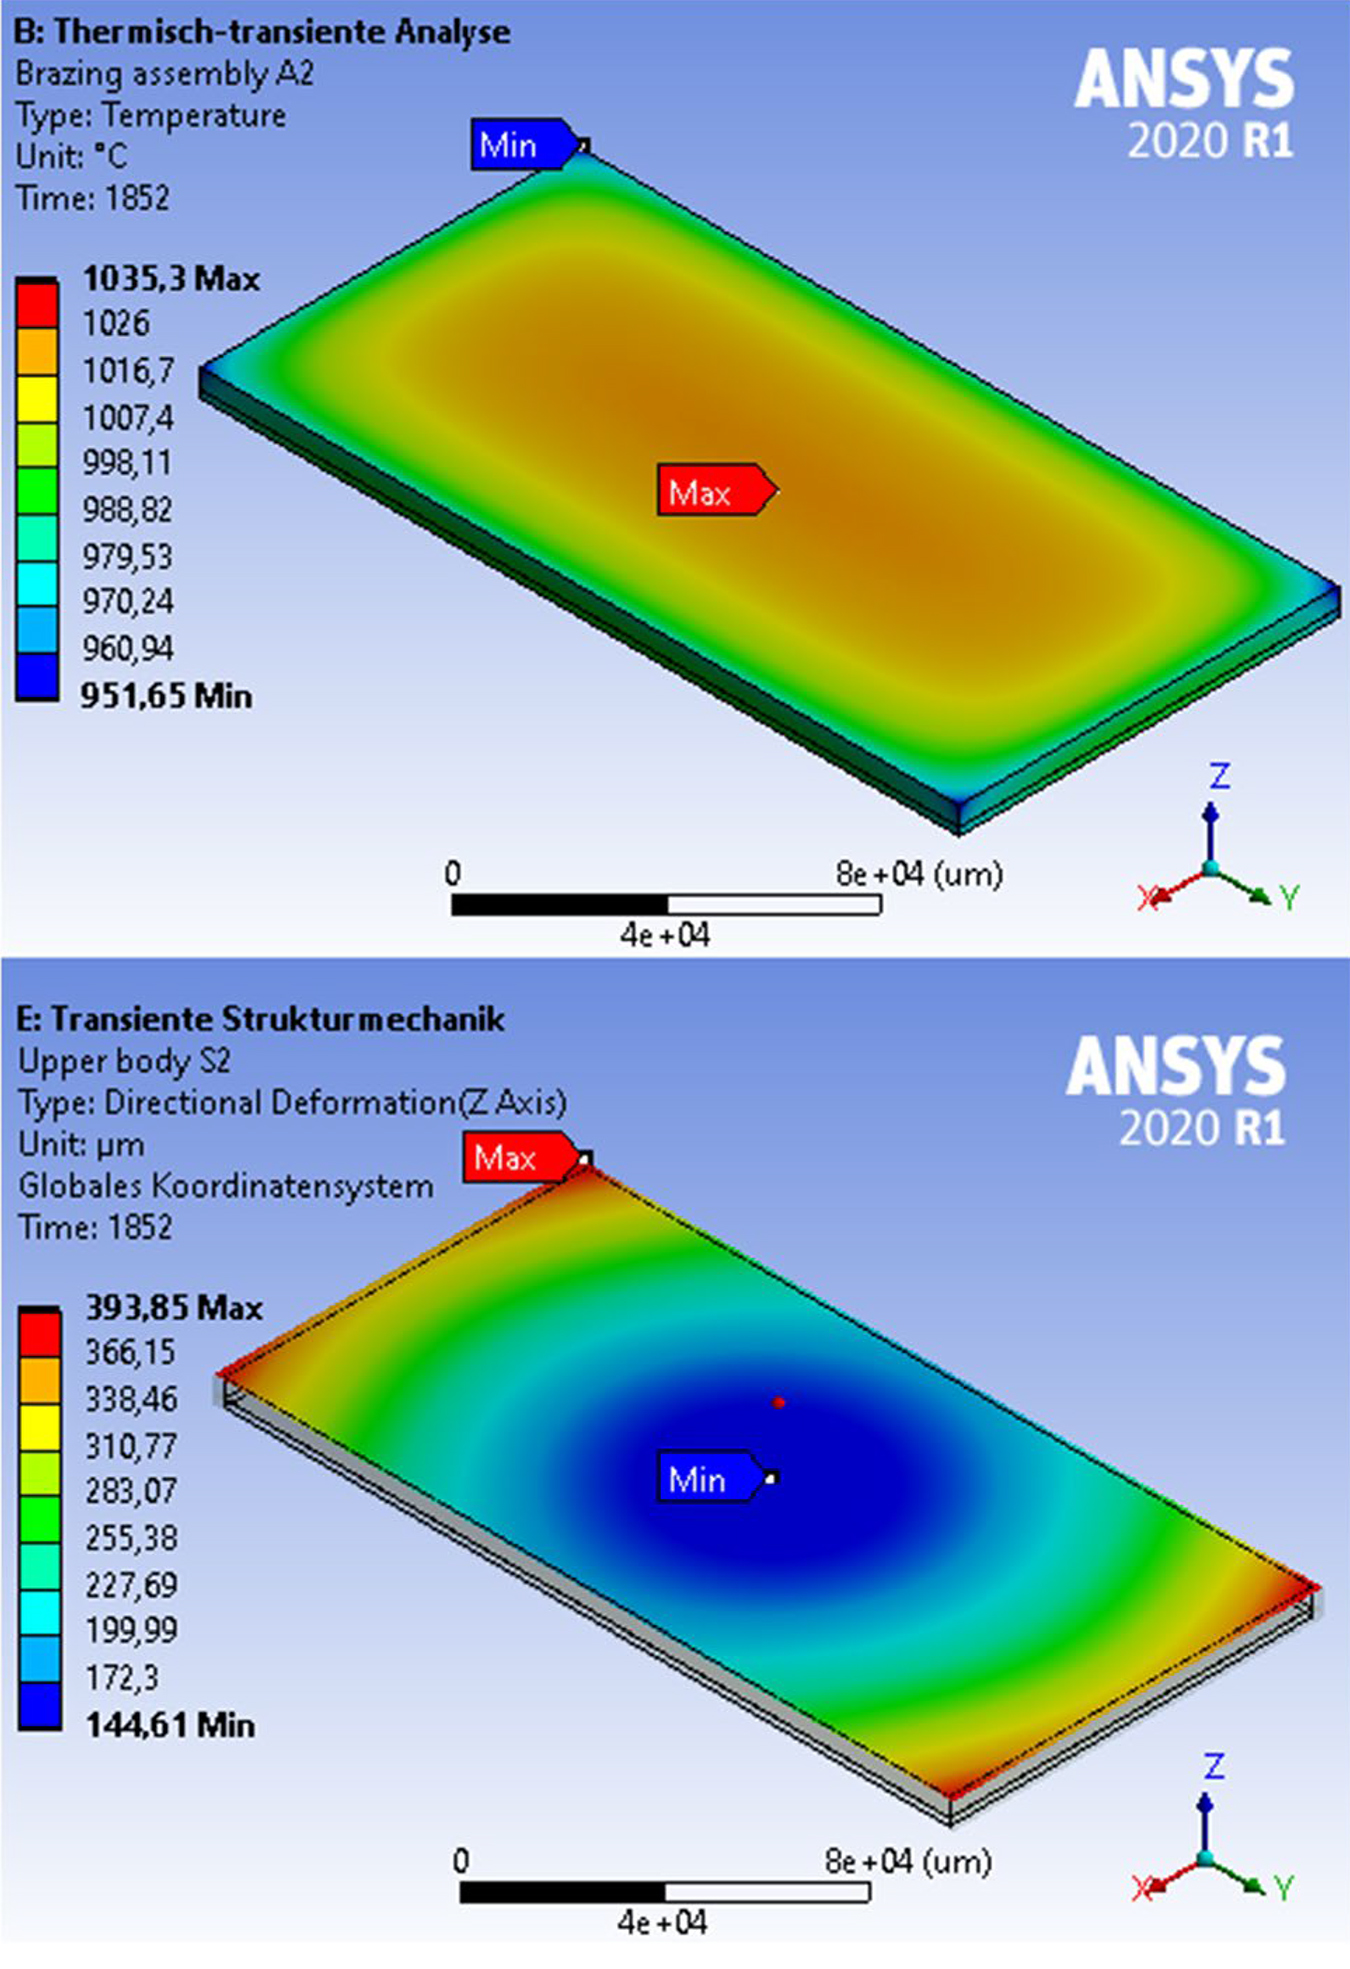
It is visible that the temperatures at the edges of the brazing assembly were highly decreased to a minimum of 952°C, so a maximum temperature difference of 82°C was present. The maximum temperature was identified in the center of the lower body. The brazing assembly was deformed mainly by bending up from the center point and was especially high at the edges. During further cooling, the local deformation behavior changes from the shown cylindrical one to a finally complete bending around the shorter center axis. Due to the asymmetric temperature field in the brazing assembly, which is produced by a shading effect of the U-profile, a significantly higher distortion of the edges placed on the profile was present compared to the opposite side of the component.
4.3 Final component distortion
In Table 2, the main results of the thermal-transient and structural-transient analyses of the experimental design are summarized.
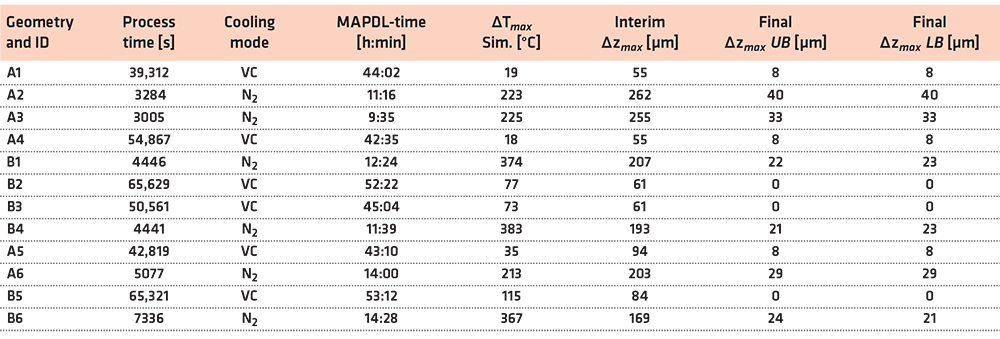
It is visible that the total calculation time of both analyses (MAPDL-time) was significantly higher for processes using vacuum cooling (VC) due to the very slow cooling rate and the selected step size of 60 s. Processes with convective cooling (N2) showed very high maximum temperature differences within the brazing assemblies for which the highest values occurred always shortly after the beginning of the cooling. Thus, the maximum interim deformation is pronounced at this time step. As one can see, there are no significant differences in the resulting total deformation of the upper and the lower body (UB, LB). As expected, processes with convective cooling showed significantly higher distortion than processes with vacuum cooling. Furthermore, the simulations with the higher maximum process temperature (1,110°C, ID A2, A3) appeared to have a higher distortion for samples with geometry A than the process with 1,060°C (A6). Furthermore, it was noticeable the temperature differences for geometry B were considerably larger for samples with convective cooling than for samples with geometry A, while the resulting distortion is lower. Based on these two relationships, it can be concluded material thickness has a significant influence on distortion. In addition, it could be shown by comparison of A2 and A3 that the local position of the brazing assembly affects the distortion as well.
5 Comparison of experimental and simulative results
In this section, the results of the experimental and simulation will be compared. Afterwards, the main actuating values will be explained to apply the FE-model closer to reality and to adjust the FE-model toward a truthful depiction of the actual distortion.
5.1 Reality comparison
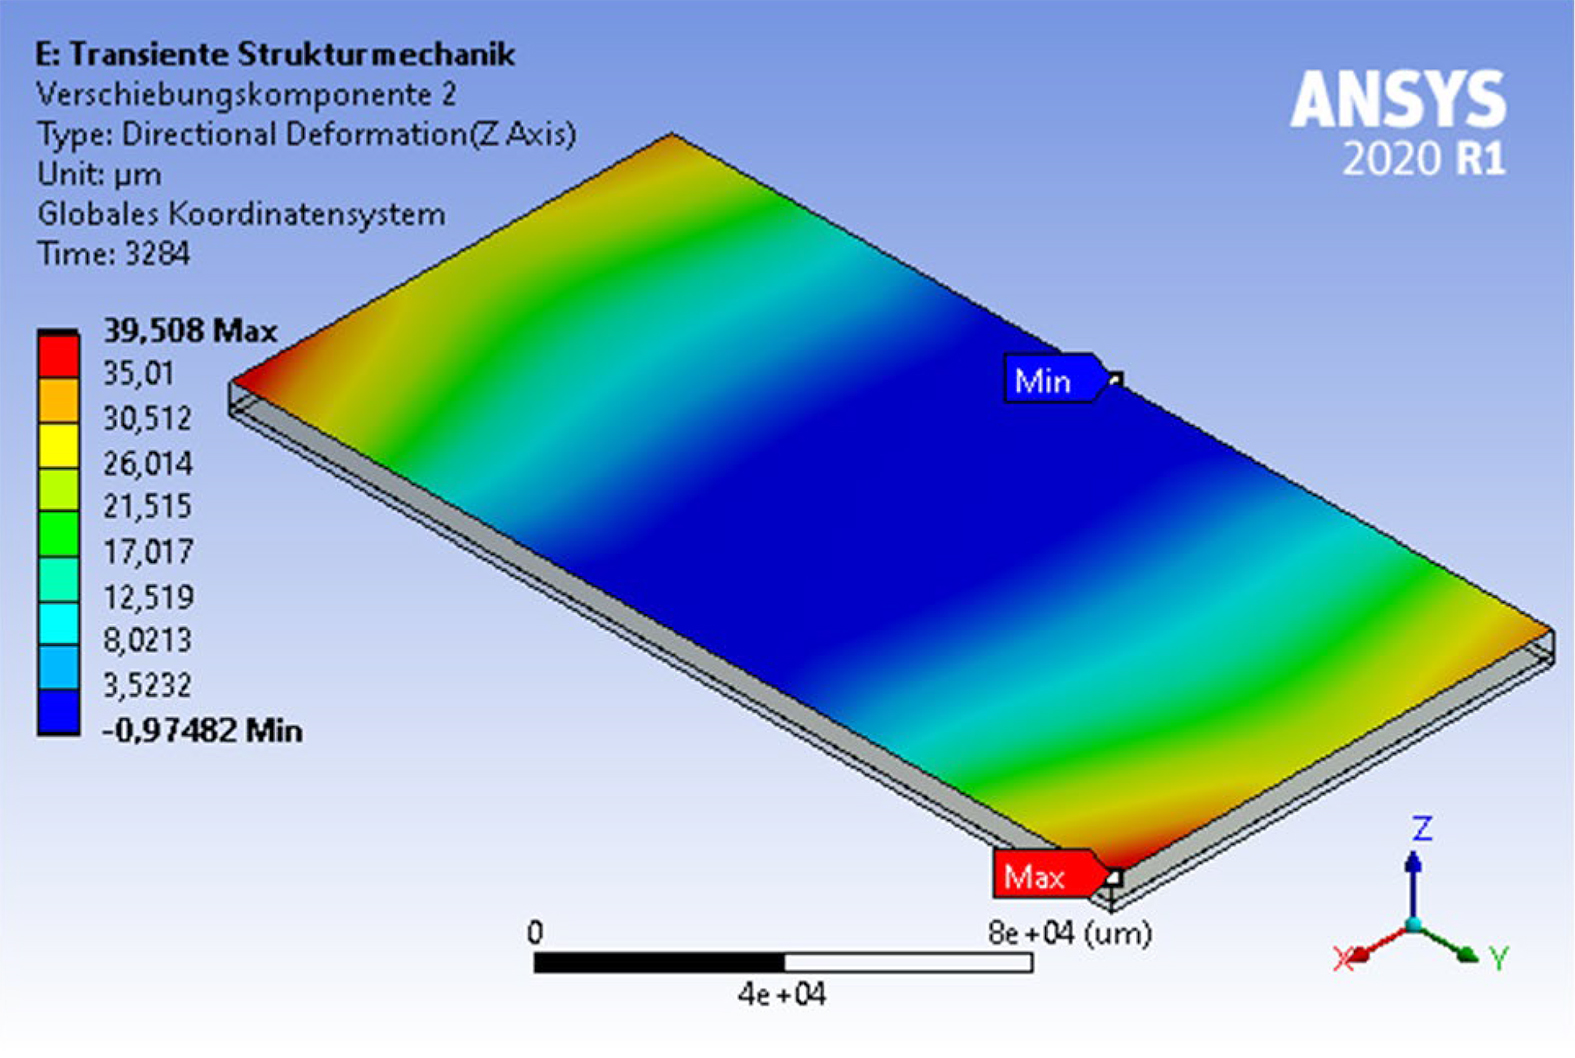
A superior goal of a simulation is always given by the experimental verification. The simulation results revealed the influences of the varied parameters from the experimental design in high detail. As mentioned before, the distortion of the real brazements does not match with the expectation of the effect of the varied parameters very well. Therefore, an intensive comparison is not useful at the current stage of development. Figure 8 illustrates the final distortion of sample A2 of 40 µm, which was not matching numerically but geometrically pronounced in a similar way to the results of the optically 3D measured real sample shown in Figure 3 (150 µm distortion).
5.2 Actuating variables of the FE-model
A detailed analysis of the achieved results revealed actuating variables of the FE-model, which were used to improve the simulation results and to reduce the calculation times. The two most important values are characterized by the emissivity of the materials and by the heat transfer coefficient. Both parameters are to be defined temperature-dependent and enable, with some iterative effort, a perfect match of the temperature cycle of the batch thermocouple of real furnace runs. Another important value was identified by the radiation of the outer part of the load supports by which the amount of heat dissipated from the adiabatic chamber can be additionally regulated. It should be mentioned that the emissivity and the heat-transfer coefficient are difficult to determine experimentally and mostly dependent on many further factors, so they can be varied within a relatively wide range. In order to increase the calculation time, the mesh size of the brazing filler metal and AISI 316L for geometry A was doubled to 3.0 mm. In addition, the step size was decoupled to 600 seconds for processes with vacuum cooling and temperatures below 400°C in load step three. The results of these parameter adjustments are marked in Table 3 by a star and are compared to the results of the previous simulation results.
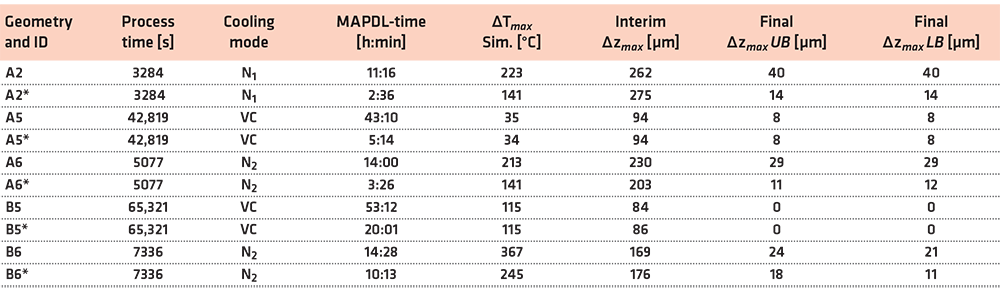
It is visible that the calculation times were significantly reduced for all processes. For those processes with convective cooling (N2), the maximum temperature difference in the brazing assemblies was also decreased, and thus, the final distortion improved substantially. For the processes with vacuum cooling, no significant difference was noticeable.
5.3 Adaptive distortion minimization
To give an outlook on the usability of the simulation, a vertical fixture was developed based on the simulation results of ID A2*, illustrated in Figure 9.
The fixture of material AISI 316L is designed to have as little contact as possible with the brazing assembly, which is placed on two tips on the bottom and aligned by four tips from each side. The scale of the open area at the sides was derived from the temperature distribution of the brazing assembly of the previous simulations so the edges are shaded to the radiation during heating and protected by the cool gas flow in reality. Since the simulation does not consider this flow until now, the emission on the edges during cooling is reduced by the hot face of the fixture. Compared to the corresponding simulation A2*, the vertical fixture reduced the maximum temperature difference in the brazing assembly from 141 to 79°C, the interim max. distortion from 275 to 31 µm, and the final maximum distortion from 14 to 8 µm.
6 Summary, conclusion, and outlook
In this study, a new method of radiation and contact modeling was developed to identify the most critical influencing factors of distortion for vacuum brazed assemblies with simulation.
The results obtained are summarized in the following:
• The new method of radiation modeling enables the import of real furnace temperature data to be used for the heater in the simulation.
• The contact modeling developed and the boundary conditions used both reliably solved the convergence problem of distortion calculation of large area and thin components and enabled a free positioning of one or more components in the heating chamber.
• The emissivity and the heat transfer coefficient were identified as actuating variables to adjust the heating and cooling behavior of the FE-model to the real vacuum furnace.
Distortion was mainly built shortly after the contact was changed to a bond when the temperature difference within the brazing assembly exceeds the yield strength at the initially high cooling rates even if vacuum cooling is used. Since the yield strength of AISI 316L above 870°C is very low and difficult to determine accurately, the definition of this temperature-dependent data set can be considered as a crucial factor for the simulation results.
With further cooling, a considerable amount of the deformation was leveled out with the shrinkage of the component. If the interim deformation was too high, the brazed assembly will remain distortion, which depended furthermore on the material thickness.
A fixture for a vertical positioning of the component reduced the maximum temperature difference in the brazing assembly from 141 to 79°C, the maximum interim distortion from 275 to 31 µm, and the final distortion from 14 to 8 µm.
Thus, the developed model is able to investigate the effect of different cooling rates on the final distortion for an individual geometry and positioning of the brazing assembly in future.
Based on the results obtained, it is highly recommended to investigate a controlled cooling rate (e.g., 10°C/min) up to 900°C heater temperature and then overpressure gas cooling for AISI 316L to avoid the formation of the σ-phase. For further development of the FE-model, it should be possible to take the residual stresses into account, ideally with depth resolution, which are suspected to be responsible for the non-systematic distortion results of the real brazements. In addition, it might be beneficial to implement a computational fluid dynamics (CFD) simulation for the processes using overpressure gas cooling instead. However, all these efforts are expected to highly increase the calculation times of the simulation.
Data availability
The project data and material is stored in accordance with the guidelines of the German Federation of Industrial Research Associations and can be made available on request.
Code availability
The simulation data can be provided upon personal request.
Acknowledgements
Many thanks to Fabian Maaß from the Institute of Forming Technology (IUL) at TU Dortmund University for the machine time and the support of the 3D measuring system GOM ATOS II Triple Scan.
Funding
Open Access funding enabled and organized by Projekt DEAL. Many thanks to the German Federation of Industrial Research Associations (AiF) for the financial support of project 21.960N “Investigation and simulation of the heat input into vacuum brazed components to reduce distortion of large joint surfaces.”
Publisher’s note
Springer Nature remains neutral with regard to jurisdictional claims in published maps and institutional affiliations.
References
- Wan Y, Jiang W, Dong Z et al (2023) Brazing manufacturing technology of plate-fin heat exchanger for solid oxide fuel cells. Int J Hydrog Energy 48:4456–4468.
- Luo Y, Li ZH, Luo YZ et al (2023) Vacuum brazing effect on the interlayer failure behavior of TiAl/GH3536 hetero-thin-walled structure with BNi-2 interlayer. Thin Wall Struct 184:110492.
- Jiang WC, Gong JM, Tu SD et al (2009) Modelling of temperature field and residual stress of vacuum brazing for stainless steel plate-fin structure. J Mater Process Technol 209:1105–1110.
- Jiang WC, Gong JM, Tu SD et al (2009) Three-dimensional numerical simulation of brazed residual stress and its high-temperature redistribution for stainless steel plate-fin structure. Mater Sci Eng A 499:293–298.
- Ma S, Li B, Zhang P et al (2022) Effect of brazing filler metals and welding parameters on laser welding-brazing joints of WC-Co to S1045. Metals 12:1780.
- Chiocca A, Frendo F, Bertini L (2019) Evaluation of heat sources for the simulation of the temperature distribution in gas metal arc welded joints. Metals 9:1142.
- Lou M, Cai W, Huang J et al (2020) Simulation of laser brazing of sheet panels and parametric studies of thermally-induced distortion reduction. JMP 60:1–10.
- Amelzadeh M, Mirsalehi SE (2019) Dissimilar vacuum brazing of cemented carbide to steel using double-layer filler metals. JMP 47:1–9.
- Kahlol KK, Aldhaidhawi M, Nawi SA (2021) Simulation between soldering and brazing of copper at 450 temperature by Zn-Sn fillet alloy. IOP Conf Series: Mater Sci Eng 1076:012074. https://doi.org/10.1088/1757-899X/1076/1/012074.
- Li P, Yan Y, Ba J et al (2023) The regulation strategy for releasing residual stress in ceramic-metal brazed joints. JMP 85:935–947.
- Yi R, Chen C, Li Y et al (2021) Research advances in residual thermal stress of ceramic/metal brazes. Ceram Int 47:20807–20820.
- Barrena MI, Gómez de Salazar JMN, Gómez-Vacas M (2014) Numerical simulation and experimental analysis of vacuum brazing for steel/cermet. Ceram Int 40:10557–10563.
- Qin G, Su Y, Meng X et al (1925) 2015 Numerical simulation on MIG arc brazing-fusion welding of aluminum alloy to galvanized steel plate. Int J Manuf Technol 78:1917.
- Guo S, Sun L, Fang J et al (2022) Residual stress, microstructure and corrosion behavior in the 316L/Si3N4 joint by multi-layered braze structure-experiments and simulation. Ceram Int 48:32894–32907.
- Bartout D, Süleymanov N (2017) Simulation methods for joining of tools with complex geometries by brazing. J Mater Environ Sci 8:4415–4425.
- Brzoza M, Pietzsch R, Kaymak Y et al (2005) Minimizing the distortion of steel profiles by controlled cooling. Steel Res Int 76:399–407.
- Liu G, Wang A, Tang R et al (2022) Fabrication and modeling of ultra-hard and high-strength B4C-based laminated ceramics by brazing joining. Ceram Int 48:27982–27987.
- Wang Y, Liu M, Zhang H et al (2021) Fabrication of reliable ZTA composite/Ti6Al4V alloy joints via vacuum brazing method: Microstructural evolution, mechanical properties and residual stress prediction. J Eur Ceram 41:4273–4283.
- Jing Y, Xiong H, Shang Y et al (2020) Simulation on Ti-based filler and vacuum brazing for TA15 alloy. Weld World 64:1261–1268.
- Jafari A, Sadeghianjahromi A, Wang C-C (2022) Experimental and numerical investigation of brazed plate heat exchangers – A new approach. Appl Therm Eng 200:117694.
- Zhang Y, Chen Y, Zhou J (2000) Experimental and numerical study on microstructure and mechanical properties for laser welding-brazing of TC4 Titanium alloy and 304 stainless steel with Cu-base filler metal. J Mater Res Technol 9:465–477.
- Zouaghi A, Velay V, Soveja A et al (2016) A multi-scale approach to investigate the nonlinear subsurface behavior and strain localization of X38CrMoV5-1 martensitic tool steel: Experiment and numerical analysis. Int J Plast 87:130–153.
- Deile J, Doberitzsch J (2013) Essential building blocks for a flexible approach to laser source design, Proc. SPIE 8603, High-Power Laser Materials Processing: Lasers, Beam Delivery, Diagnostics, and Applications II, 860309. https://doi.org/10.1117/12.2006068.
- Aranaga S, Izcara J, Del Río L et al (2016) Thermal modelling of a brazing process of vacuum interrupters. 2016 27th International Symposium on Discharges and Electrical Insulation in Vacuum (ISDEIV), Suzhou, China, p 1–4. https://doi.org/10.1109/DEIV.2016.7763943.
- Zhao XF, Wimmer A, Zaeh MF (2023) Experimental and simulative investigation of welding sequences on thermally induced distortions in wire arc additive manufacturing. Rapid Prototyp J 29:53–63.
- Zaharinie T, Yusof F, Hamdi M et al (2014) Effect of brazing temperature on the shear strength of Inconel 600 joint. Int J Adv Manuf Technol 73:1133–1140.
- Ivannikov A, Krasnova E, Penyaz M (2020) Effect of high-temperature brazing with a nickel-based STEMET 1301A brazing alloy on the unbrazing temperature of 12Kh18N10T steel joints. Int J Adv Manuf Technol 110:1319–1326.
- Tillmann W, Henning T, Boretius M (2019) Effect of the dwell time on the microstructure and tensile strength of vacuum-brazed tool steels using BNi-2 filler metal. Weld world 63:1477–1488.
- Mann B, Ford K, Neilsen M et al (2020) Minimizing residual stress in brazed joints by optimizing the brazing thermal profile. Proceedings of the ASME 2020 International Mechanical Engineering Congress and Exposition. Volume 2A: Advanced Manufacturing. Virtual, Online. November 16–19. https://www.osti.gov/servlets/purl/1812850.
- Heuer V, Leist T, Schmitt G (2016) Distortion control through synchronized vacuum heat treatment. HTM J Heat Treatm Mat 71:83–89.
- Since JJ, Irretier O (2010) Vacuum heat treatment and high pressure gas gas quenching – Aspects in Distortion Control. Heat Processing 8:1–6.
- Kallmeyer R (2006) Untersuchungen zur Strahlungsmodellierung in ANSYS, TU Ilmenau, GRIN Verlag. https://www.grin.com/document/79513.
- Tennenhouse CC (1971) Control of Distortion During the Furnace Cycle is vitally important for successful brazing, particularly of complex parts and assemblies. AWS Welding J October.
- American Iron and Steel Institute (2020) High-temperature characteristics of stainless steels – A designers’ handbook series No. 9004. https://nickelinstitute.org/media/4657/ni_aisi_9004_hightemperaturecharacteristics.pdf.
- Richter F (2011) The physical properties of steels “The 100 steels program” part I: Tables and figures, TU Graz, Institute of experimental physics. https://www.tugraz.at/institute/iep/forschung/thermophysics-and-metalphysics/literature/.
- Gardner L, Ashraf M (2010) Elevated temperature material properties of stainless steel alloys. J Constr Steel Res 66:634–647.
- Ding J, Han EH, Zhang Z et al (2017) Influence of sigma phase on corrosion behavior of 316L stainless steel in high temperature and high pressure water, Mater. at. High Temp 34:78–86.
- Lescur A, Stergar E, Lim J et al (2021) Microstructural investigation and identification of intermetallic σ-phase in solution annealed 316L-type austenitic stainless steel. Mater Charact 182:111524.
- Aditya DM, Ardy H, Lantang YSF et al (2023) The study of sigma and carbide in cast austenitic stainless-steel grade HH after 24 years of high-temperature service. Heliyon 9:e14109.
- Andreatta F, Lanzutti A, Revilla RI et al (2022) Effect of Thermal Treatment on Corrosion Behavior of AISI 316L Stainless Steel Manufactured by Laser Powder Bed Fusion. Materials 15:6768.
- Laleh M, Hughes AE, Xu W et al (2019) On the unusual intergranular corrosion resistance of 316L stainless steel additively manufactured by selective laser melting. Corros Sci 161:108189.
- Böhler Edelstahl GmbH (2006) Praxis-Service – Erfolgreiche Edelstahlverarbeitung. https://docplayer.org/22768989-Praxis-service-erfolgreiche-edelstahlverarbeitung.html.
© 2023 by the authors.
This article is an open access article (https://link.springer.com/article/10.1007/s00170-023-11905-0) distributed under the terms and conditions of the Creative Commons Attribution (CC BY) license (https://creativecommons.org/licenses/by/4.0/). This article has been edited to conform with the style of Thermal Processing.


 general practice for CQI-9 and AMS2750E")


