


The active screen plasma nitrocarburizing technology is an improvement of conventional plasma nitrocarburizing by providing a homogeneous temperature distribution within the workload and reducing soot formation. In this study, an industrial-scale active screen (AS) made of carbon-fiber-reinforced carbon serves as the cathode as well as the carbon source for the plasma-chemical processes taking place. The pulsed dc discharge was maintained at a few mbar of pressure while simultaneously being fed with a mixed gas flow of hydrogen and nitrogen ranging from 10 to 100 slh. Using in situ infrared laser absorption spectroscopy with lead-salt-tunable diode lasers and external-cavity quantum cascade lasers, the temperatures and concentrations of HCN, NH3, CH4, C2H2, and CO have been monitored as a function of pressure and total gas flow. To simulate industrial treatment conditions, the temperature of the sample workload in the center of the reactor volume was kept at 773 K by varying the plasma power at the AS between 6 and 8.5 kW. The resulting spectroscopically measured temperatures in the plasma agreed well with this value. Concentrations of the various species ranged from 6×10¹³ to 1×1016 cm-3 with HCN being the most abundant species.
1 Introduction
In the field of thermal treatments of materials, nitriding and carburizing and the combination of both, called nitrocarburizing, are standard practices to improve the wear and corrosion resistance of steel components. The basic mechanism for this improvement is the diffusion of nitrogen, carbon, or both, respectively, at temperatures of up to 823 K into the lattice structure of the material, which typically expands and thus forms expanded austenite or the so-called s-phase. Due to the expansion, the material is locally hardened, generating hardness profiles that correspond to the diffusion depth from the interface. The benefit of the combination treatment of nitrocarburizing is a smoother transition of hardness and thus typically a higher load-bearing capacity [1]. While the diffusion mechanism can also be achieved using gas or salt-bed reactors, the use of plasma nitrocarburizing (PNC) has the advantage of a lower environmental impact at a reduced processing time [2]. In part, this is due to an in-process activation of the diffusion interface by removal of the oxide layer. However, current industrial implementations of the PNC technology still are limited in their variation of the carburizing potential as the carbon content within the process is regulated using carbon-containing admixtures to the feed gas. This can lead to oversaturation of the process atmosphere, in turn causing soot production and generation of cementite in the compound layer [3]. So far, process control in industrial applications is based on the operator’s empirical experience. Already in 1997, Mittermeijer and Somers published about the prospect of a general nitriding process control with process control for PNC being far out of reach [4].
Current industrial applications of plasma-assisted nitrocarburizing are commonly conducted by conventional plasma nitrocarburizing. Therein the workload is negatively biased relative to the grounded reactor walls. At a few mbar of pressure, a pulsed dc glow discharge is maintained, producing reactive species from the feed gas of H2, N2, and carbon-containing species. The plasma heats the workload to a temperature between 673°K and 823°K, thus enabling diffusion processes to take place. However, depending on the workload geometry, the temperature distribution may not be homogenous and therefore causes uneven treatment progress, the so-called edge effect [5]. The plasma may as well sputter the workload surface, requiring post-treatment polishing.
These drawbacks have led to the development of the active screen plasma nitrocarburizing (ASPNC) technology. In this approach, the glow discharge is placed at an intermediate steel screen, called active screen (AS), which surrounds the workload and allows a gas flow to pass from the plasma region to the workload providing the reactive species required for the hardening process. Even though, for industrial-scale reactors, a secondary plasma directly at the workload is still required to achieve a reasonable nitrocarburizing response, the secondary plasma is operated at a fraction of the power of the AS plasma. As a consequence, thermal inhomogeneity and sputtering are reduced [6–8].
Several studies and proposals already discussed admixtures to the feed gas to affect the process conditions and treatment results [9–11]. However, with the AS being introduced as a cathode in a reactive plasma, it can be sputtered and thus serves as an additional solid chemical source. To investigate the mechanism of nitriding with an ASPNC reactor, Hubbard et al studied the mass transfer from an AS made of steel to the workload and found that sputtered material does not contribute to the nitriding of the substrate [6]. Independent on this study, other groups investigated co-alloys to the AS, such as aluminum and silver, to produce e.g. antimicrobial surfaces, again via the mass transfer from AS to the workload [12, 13]. A different approach is the substitution of steel as screen material with a solid made of carbon, such as graphite or carbon-fiber-reinforced carbon (CFC). The use of a solid carbon source had been first proposed by Lebrun et al and realized by Crespi et al for CNx deposition on a polymer substrate [14, 15]. The application for ASPNC had then been reported by Burlacov et al and Hamann et al in 2017, for industrial- and laboratory-scale reactors respectively [16, 17]. In both works, it has been found that an AS made of CFC affects the process atmosphere most drastically in the concentrations of HCN and C2H2, which increased by a factor of 30 and 70 respectively compared with 1% admixture of CH4 in the H2-N2 feed gas typical for ASPNC processes using a steel AS. This is of particular interest since beneficial diffusion conditions created by the highly reactive HCN molecule were first reported in the early 1990s [18, 19]. In a later study, Burlacov et al identified the concentration of HCN as a control parameter for the carburizing potential of the nitrocarburizing process [20].
To monitor the concentrations and temperatures of HCN and further species, non-intrusive in situ diagnostics are required. In the past, spectroscopic methods such as optical emission spectroscopy (OES), Fourier transform spectroscopy in the infrared, and laser absorption spectroscopy (LAS) have been used for this purpose [16, 17]. Therefore, LAS is exemplary due to the high-quality quantitative information and high sensitivity it offers. Depending on the selected laser source, different species are available for detection. In previous studies, lead-salt diode lasers (TDL) have been used to measure the transient CH3 radical as well as CO, CO2, C2H4, and C2H6 [21]. During the early 2000s, external-cavity quantum cascade lasers (EC-QCL) became commercially available and found widespread application. While technologically limited in their achievable spectral range, they tuned over a much broader range than TDLs, allowing a near-simultaneous multi-species detection. In the study of ASPN processes, both types of sources were extensively used in combination with OES and other spectroscopic techniques. This way, 14 species were detected within the plasma process, and, as mentioned before, partially linked with the treatment behavior [17, 20, 22, 23].
Some of these measurements were conducted at the laboratory-scale plasma nitriding monitoring reactor (PLANIMOR) [24]. This reactor was specifically constructed to simulate the plasma-chemical conditions present in an industrial-scale plasma nitriding process, while simultaneously offering improved access for diagnostics, including spatially resolved LAS measurements of the afterglow region. A comparative study between PLANIMOR and an industrial-scale reactor has proven the general similarities in respect to the plasma-chemical behavior of both types [25]. Consequently, the plasma-chemical similarities also are reflected in the nitriding treatment of samples in both systems, resulting in a comparable thickness of the compound layer.
Recently, the results of investigations on plasma processes using an AS made from CFC in PLANIMOR have been published [22]. In this study, the concentrations, temperatures, and conversion efficiencies of nine molecular species were measured as functions of the plasma power at the AS, the pressure, and the nitrogen fraction in the feed gas. Additionally, the carbon mass flow from the AS and the efficiency of the carbon mass flow in relation to the applied power were presented. The present study is a continuation of the former and investigating the plasma processes of an AS in an industrial-scale ASPNC reactor. To find the influence of process pressure and feed gas flow, a constant temperature is maintained inside the reactor while the concentrations and temperatures of HCN, NH3, CH4, C2H2, and CO were measured using EC-QCLAS and TDLAS.
The current study focuses on the production rate of the five molecular species, their dependence on the gas flowrate, and finally, the scalability of the concept for an AS made of carbon materials. Further observations concern the sole detected oxygen-containing species CO as a measure of contamination with oxygen, since previous studies by Burlacov et al pointed out the importance of contamination in industrial-scale reactors [20].
2 Experimental
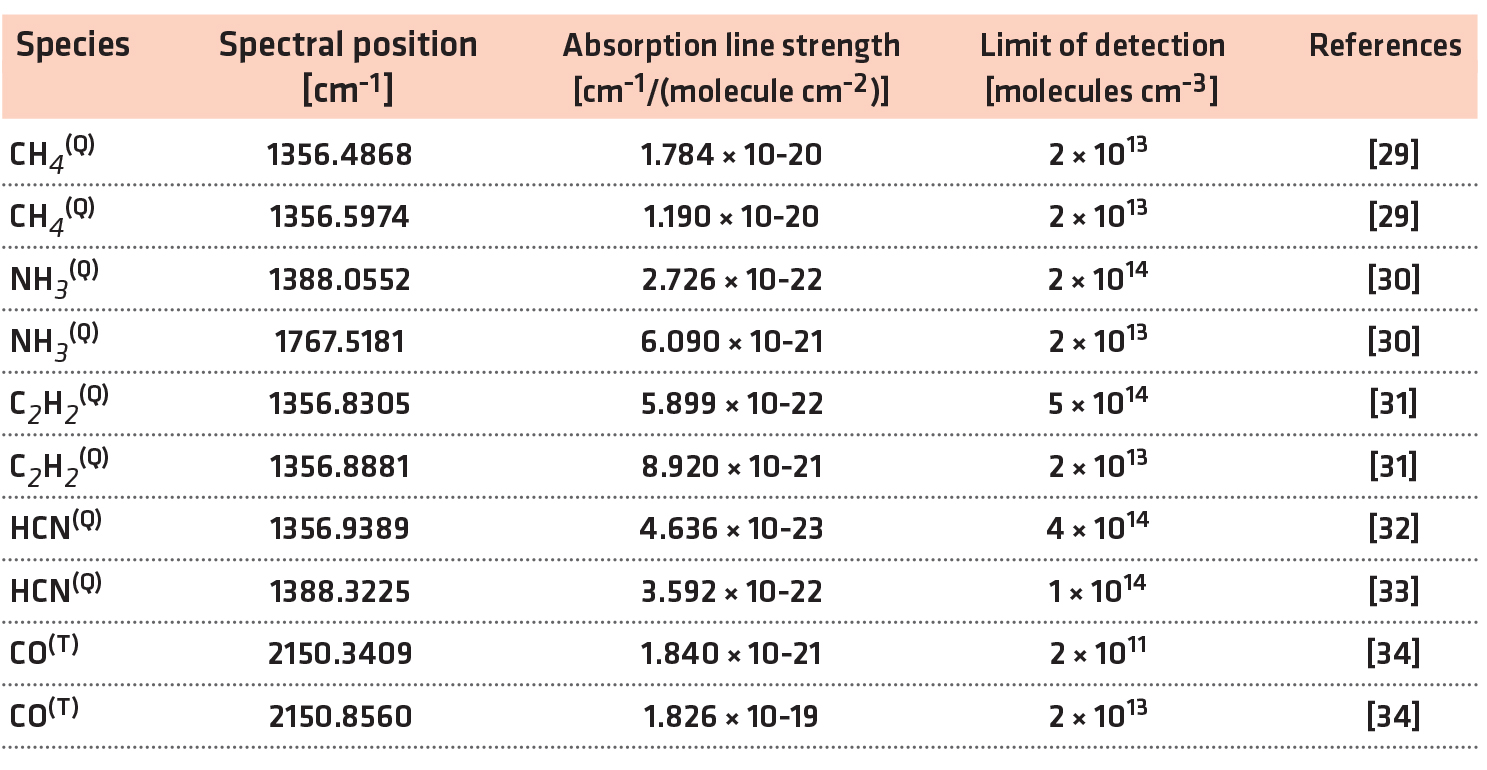
A crosscut schematic of the industrial-scale reactor with the LAS setup including three laser sources is shown in Figure 1. As indicated by the presence of two flipping mirrors, the laser sources are co-aligned and cannot be used simultaneously. Furthermore, two Daylight Solutions EC-QCL, labelled as QCL I and QCL II, provide mode-hop free spectral ranges of νI = 1,345-1,400 cm-1 and νII = 1,770-1,850 cm-1, respectively [26]. In addition, the infrared multi-component acquisition system (IRMA) [27] has been used, which combines three lead-salt tunable diode laser (TDL) sources to a single acquisition system. Table 1 presents a list of detected species and their respective spectral positions, line strengths, and limits of detection, whereby the superscript Q and T designate the measurement with an EC-QCL or a TDL source respectively. The reference and etalon spectra of the EC-QCLs were measured simultaneously using a three-channel setup. For the TDL sources, they were measured separately.

The shared beam path enters and exits the reactor through two KBr windows at a distance of 1 meter, which is assumed identical to the length of absorption. A model sample composed from 26 equidistant punched discs is placed in the center of the reactor, aligned to the beam path. It serves to simulate the influence of a workload for nitrocarburizing and can be biased for this purpose. Finally, a liquid nitrogen cooled HgCdTe detector positioned at the focus of an off-axis parabolic generates an analogue signal for data acquisition.
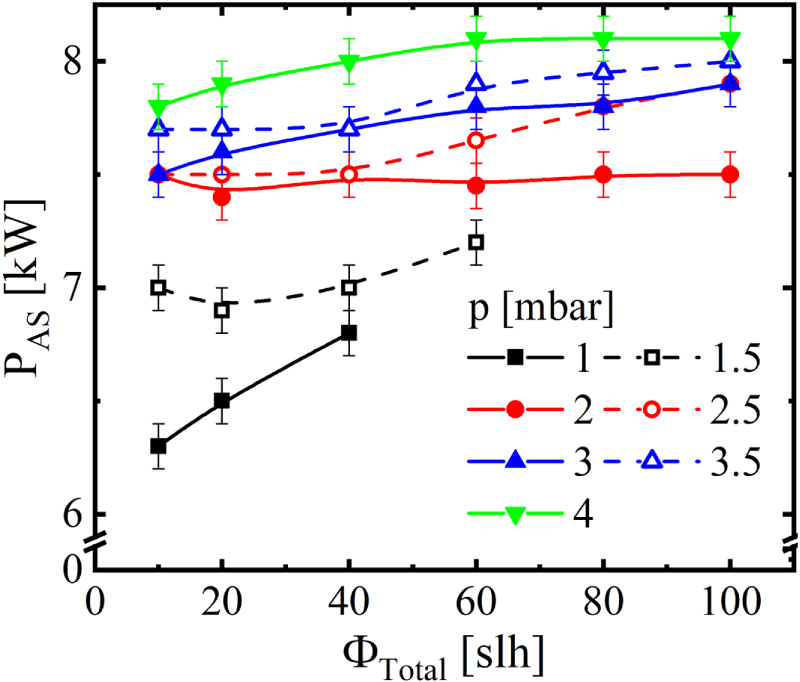
The reactor itself has a cylindrical volume of approximately 1 m3, at a diameter of 1 meter. It contains the AS made of CFC with a diameter of 0.8 meters and a height of 0.75 meters. Besides the top plate, the screen is composed of circular sections made of CFC each covering 60° of the cylinder’s perimeter with 20 mm radial depth, distanced 20 mm in height between each section. The thickness of the CFC base material is 5 mm. All components included, the AS weighed approximately 30 kg. For plasma generation, a pulsed DC power supply with a maximum power of P = 15 kW at a frequency of f = 1 kHz and a duty cycle of 60% is connected with the AS. The steel reactor wall is grounded, and the model probe is on a floating potential. During the measurement, the system regulated the power at the AS between 6.0 and 8.5 kW to maintain a stable temperature of Tset = 773 K, measured with a thermal probe integrated in the model probe. The plasma power at the AS as a function of the total gas flow for different pressures is shown in Figure 2. At the lower limit of the pressure range, the discharge was not stable, reflected by a reduced power consumption.
The precursor composition is controlled by mass flow controllers. In turn, the feed-gas is led into the reactor via a showerhead integrated into the reactor top. This way H2, N2, and Ar were introduced, the latter only during starting process of the reactor to provide a stable plasma until the chosen treatment temperature was reached. The total mass flow varied from ΦTotal = 10-100 slh, at a mixing ratio H2:N2 of 1:1. The pumping system is connected to the bottom of the reactor, including a butterfly valve allowing the control of gas pressure in the range of p = 1-4 mbar.
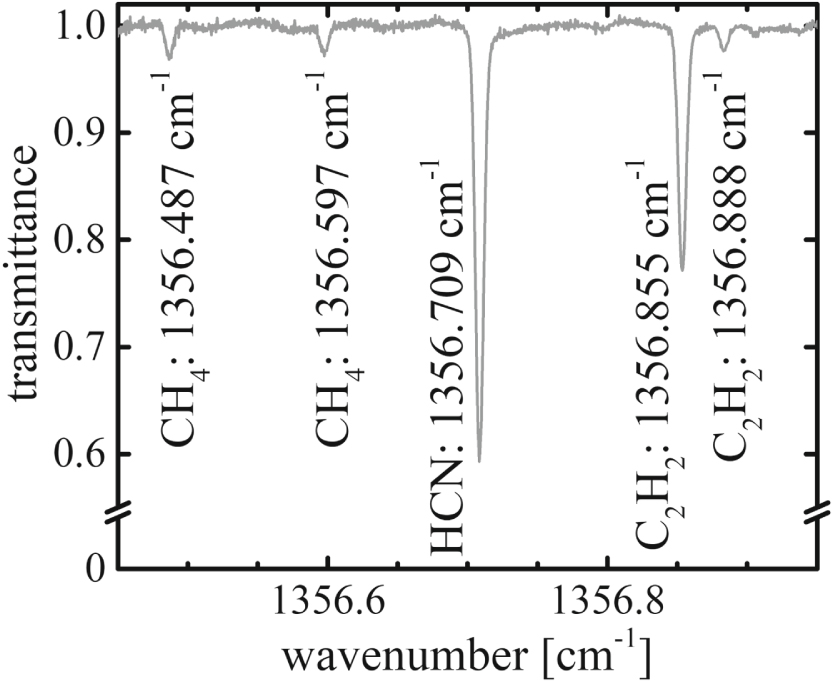
An EC-QCL absorption spectrum in the spectral range near 1356.7 cm-1 with specified absorption lines assigned to CH4, HCN, and C2H2 recorded with EC-QCLAS is shown in Figure 3. The conditions were as follows: ΦTotal = 40 slh H2 + 40 slh N2, Tset = 773 K, PBias = 0 W, p = 3 mbar. For the determination of the temperature, line profile analysis has been used to obtain the translational temperature, associated with Doppler broadening. The laser linewidth, determined at a room temperature reference, was taken into account. We calculated concentrations with Beer-Lambert law using temperature dependent line information from the HITRAN database [28] and derived mole fractions with the ideal gas law. The production rate rProduction,i of a species i is given by
 whereas nmole,i is the mole fraction of the species i and ΦTotal is the total gas flow through the reactor with the unit slh. We assume that the plasma-chemical reactions are in a steady state of equilibrium. The rate of production has the unit of slh. The carbon mass flow ΦC is given by
 with rProduction,i being the production rate of species i in slh, NC,i being the number of carbon atoms within species i and the sum including all species in the process. The carbon mass flow has natively the unit of slh, which is converted to mg h-1 using the atomic mass of carbon and the ideal gas law to better relate it with the macroscopic mass of the AS. Finally, the carbon consumption efficiency ECC is given by
 whereas ΦC is the carbon mass flow in mg h-1 and P is the plasma power at the AS. Accordingly, ECC has the units of mg h-1 W -1. Additionally, the overall conversion Xi of a species i is given by
 with ni being the concentration of species i, meanwhile Ni,j is a proportionality factor for correlation of the resulting species j to the feed gas species i. The right hand side of the equation chain is equivalent to Equation 2 with the consideration that the feed gas species are diatomic molecules. The concentration has the unit of cm-3.
3 Results and discussion
Due to the temperature dependence of the absorption line strength, the temperature has been determined for the available species using line profile analysis. For the transitions of the available species HCN, CH4, CO, NH3, and C2H2 the line profiles correspond to the set process temperature of Tset = 773 K. Apart from that, a thermal equilibrium between rotational and translational temperatures is assumed. Even if the rotational temperatures are not directly available in this study, in [35] comparable values for the process temperature measured at the model probe and for the rotational temperature measured in the plasma at the steel screen have been found. However, it should be noted that LAS is a line-of-sight method allowing only line-averaged results and as such does not allow any spatially resolved information in the used geometry. Thus, the active plasma zone at the carbon screen may have a higher temperature or even no thermal equilibrium at all.
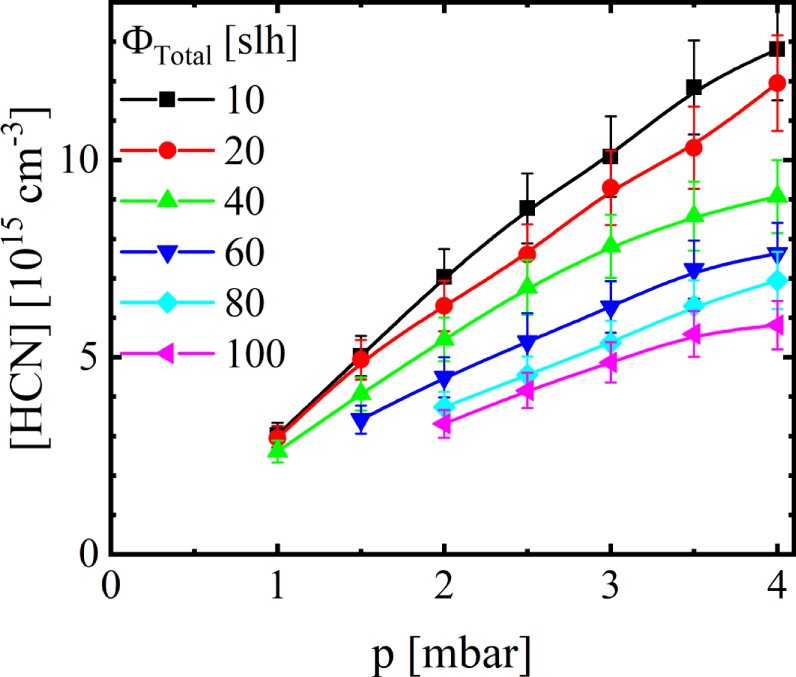
Using the line strengths for 773 K, the absolute concentrations of the detected species have been determined. To demonstrate the chronological order of measurement, the absolute concentration of HCN at different gas flows measured as a function of pressure is presented in Figure 4. The measurements were conducted at a set gas flow, varying the pressure until moving on to a new set gas flow starting with a total flow of 10 slh. As the pressure increases, the concentration of HCN increases linear within the margin of error from 2.5 to 14 × 1016 cm-3 in case of the lowest gas flow. On the other hand, increasing the total flow decreases the concentration from 14 to 6 × 1016 cm-3 at the pressure of 4 mbar. At lower pressures, the decrease is less pronounced, and in some low pressure and high total gas flow settings no stable discharge was achieved.
In Figure 5, the concentration of HCN is shown at different gas pressures as a function of the residence time with a logarithmic x-axis. With increasing residence time, a monotonous increase of the concentration of HCN can be seen at every pressure, typically with a steeper increase at higher pressure. Due to the high reactor volume, the residence time ranges in the minutes. Since the concentration of HCN is dependent on the resident time — even at high values of the residence time, one has to assume that surface reactions are contributing to the production of HCN. Similar increases were observed for the concentrations of C2H2, CH4, and CO, with only the concentration of NH3 decreasing with residence time. Accordingly, for the generation of all detected species, surface processes are non-negligible.

Subsequent figures present the mole fractions in dependence on the total gas flow. Accordingly, Figures 6a-6e shows mole fractions of HCN, C2H2, CH4, CO, and NH3 measured as a function of the total gas flow for different pressures. As the total gas flow increases, the mole fractions of HCN, C2H2, CH4, and CO decrease. Concerning HCN and C2H2, the respective mole fractions share very similar trends. Accordingly, the ratios of the two mole fractions, which is equal to the ratios of the two concentrations, can be approximately given as [C2H2]:[HCN] ≈ 0.17 at all gas flow settings. Both mole fractions, as well as the mole fraction of CH4, decrease by a factor of 2 between a total flow of 10 and 100 slh. However, the mole fraction of CH4 reaches a plateau at 60 slh of total gas flow. Furthermore, the mole fraction of CO decreases by approximately a factor of 10 within the same range of the total gas flow, from 5.5% to 0.5%. In that relation, only NH3 is an outlier of the five species, its mole fraction increasing linear with the total gas flow by a factor of 2 over the full range of the total gas flow. The mole fractions of HCN, C2H2, and CO indicate only a weak or no dependency on pressure, while those of CH4 and NH3 show a clear dependency on pressure. The mole fractions of both species increase with growing pressure.


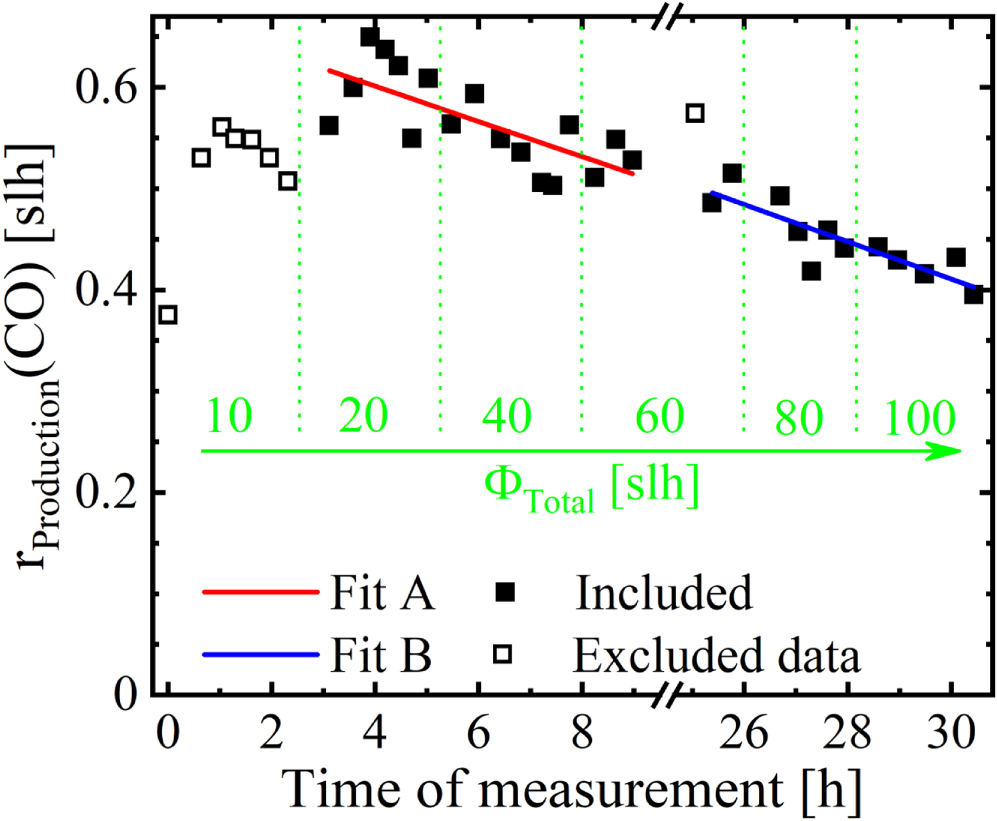
For further analysis of the data, the production rates at stationary conditions of each molecular species were determined by applying Equation 1. The production rates of HCN and C2H2 for different pressures measured as a function of the total gas flow are shown in Figures 7a and 7b respectively. While both are independent on the pressure and increase with the total flow, the slopes decrease with higher total gas flow values. For the production rate of CH4 in Figure 7c, a nearly linear increase with the gas flowrate can be identified, while the production rate of NH3, shown in Figure 7d, increases over proportionally with the gas flow. However, the production rate of CO, as shown in Figure 7e, decreases with the total gas flow with the exception of the lowest gas flow setting. It is independent on pressure. Since we supply no oxygen-containing species, the two available sources for CO formation can be wall attachment and leakage, with the wall attachment contribution typically decreasing with time. Figure 8 shows the production rate of CO as a function of time of measurement. The measurement was taken in two sessions; the first session concluded after circa 9 hours and the second session began at 25 hours as indicated by the break in the time axis. During the break, no plasma was active; the total gas flow was stopped, and the reactor chamber was actively evacuated. From data point to data point, the pressure was changed; the stepwise increase of the total gas flow is indicated in green. With the exception of the lowest total gas flow setting, the production rate of CO decreases linearly from 0.6 to 0.4 slh during the active time of the plasma. Even the break has little influence on the trend, as indicated by the good continuity of two linear fits, Fit A before and Fit B after the break. Therefore, the most likely oxygen source is the contamination of the reactor wall and the AS with oxygen-containing species. With CFC being a highly porous material, this assumption is well founded. The observed dependency of the production rate of CO on the total gas flow, as shown in Figure 7e, should therefore be interpreted as a dependency on the active time of the plasma. Since the measurement procedure created a direct correlation between the active time of the plasma and the total gas flow, deriving a pure dependency of the production rate of CO on the total gas flow is impossible.
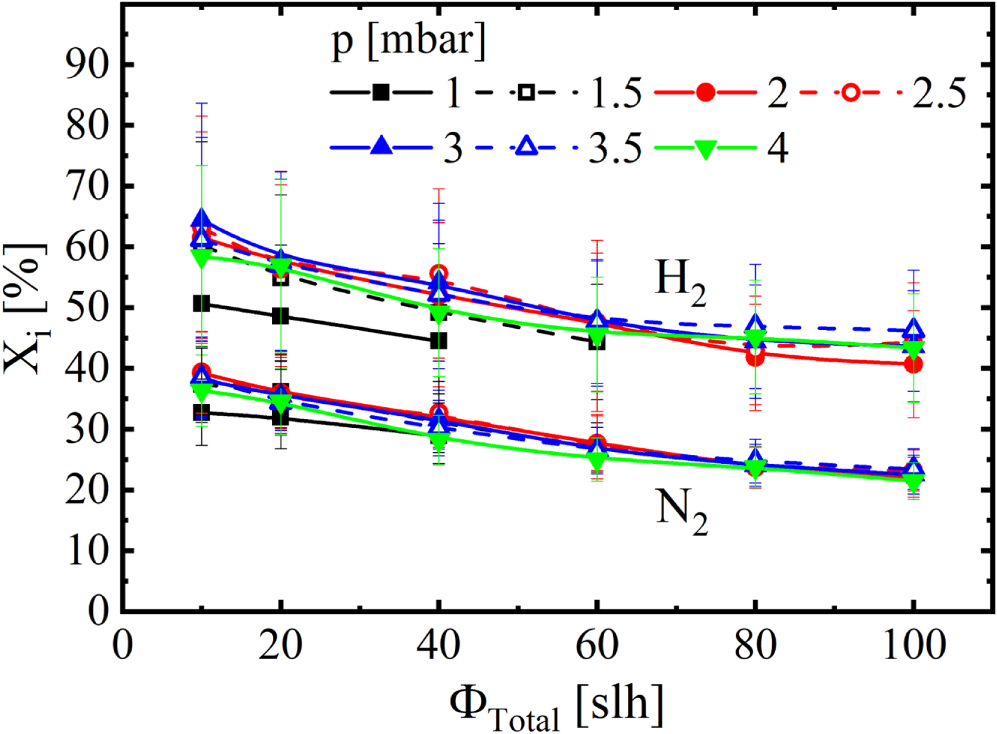
Focusing again on the intentionally admixed feed gas, in Figure 9 the conversions of hydrogen, XH2, and nitrogen, XN2, are shown at different pressures measured as functions of the total gas flow, as determined by Equation 4, assuming that only the detected species and the feed gas species are present in the reactor. While measurements at PLANIMOR have shown that other species are created, such as C2N2 or CN, their concentrations are negligible [22]. The higher set of curves corresponds to the conversion of hydrogen and the lower set to the conversion of nitrogen. Both set of curves in Figure 9 decay from 62% to 45% and from 35% to 25% respectively, while at the same time showing no dependency on the pressure. Figure 9 also allows to calculate the mole fractions of hydrogen and nitrogen according to
 with nmole,i being the mole fraction of species i. One can see the decrease of the mole fraction of the most abundant species HCN with increasing total gas flow being reflected in a decreased conversion of both hydrogen and nitrogen. This is only partially compensated by an increased mole fraction of NH3, resulting in a larger mole fraction of both hydrogen and nitrogen at high total gas flow compared with a low total gas flow. In order to explain this trend, the third constituent of HCN, i.e. carbon, was investigated.
The detected species can be separated in carbon-containing species such as HCN, C2H2, CO, and CH4, and carbon-free NH3. Consequently, the carbon mass flow is determined by using Equation 2, as shown in Figure 10a for different pressures measured as a function of total gas flow. The carbon mass flow reflects the consumption rate of the CFC cathode of finite mass, as previously shown at PLANIMOR [22]. It can be assumed that no carbon-containing species of noteworthy concentrations remained undetected. Since HCN is the most abundant carbon-containing species, the trends of the carbon mass flow are similar to those of the absolute production rate of HCN, increasing with the total gas flow but being independent on the pressure. The slope of the carbon mass flow in dependency on the total gas flow decreases at high values of total gas flow, indicating a limit to the release of carbon.

Such a limit to the release of carbon may explain the trends of the production rates as seen in Figure 7. At low total gas flow settings, the release of carbon is sufficient to create large amounts of carbon-containing species. In turn, these carbon-containing species bind a large fraction of the available hydrogen and nitrogen, leading to lowered concentrations of NH3. As the total gas flow increases, the release of carbon can only scale weaker than linear. This limits the production rates of carbon-containing species, thus e.g. the mole fraction of HCN is reduced. Accordingly, the conversions of the feed gas species are lowered, and higher amounts of hydrogen and nitrogen are available for the formation of NH3. Finally, the mole fraction of NH3 increases, as observed in Figure 6d. The production rate of CO is the only outlier of the carbon-containing species, due to its dependence on oxygen concentration, which is not intentionally admixed.
Using Equation 2, the carbon consumption efficiency ECC has been calculated and found to range between 0.13 and 1.9 mg h-1 W -1, as presented in Figure 10b. The trends of ECC strongly correlate with the trends of the total carbon mass flow, as the power only slightly varies for different gas flows and different pressures. For comparison, we can again refer to investigations on the laboratory-scale PLANIMOR [22] where, for a pressure p = 3 mbar and a feed gas mixture H2:N2 = 1:1, the carbon consumption efficiency ranged between 0.7 and 0.9 mg h-1 W -1 depending on the power at the AS.
Taking the cross section of both reactor designs into account to compare flow speeds, the mass flow of PLANIMOR of 20 sccm corresponds to a flow of 24 slh in the industrial-scale reactor. The closest measured value of gas flow is 20 slh with a carbon consumption efficiency of ECC = 0.6 ± 0.07 mg h-1 W -1, being in quite good accordance. Considering previously established differences in temperature and contamination, a small mismatch can be expected.
4 Summary and conclusion
In the current in situ spectroscopic study, an industrial-scale PNC process with an AS made of carbon-fiber-reinforced carbon was investigated using TDL and EC-QCL sources in the mid-infrared. This way the absolute concentrations of CH4, C2H2, HCN, CO, and NH3 were monitored in dependence on the total gas flow of the feed gas and the gas pressure in the reactor. To approximate common industrial conditions, the plasma power at the AS was regulated to maintain a steady temperature Tset = 773 K. The translational temperatures of the five molecular species were found to agree with the set temperature.
The plasma-chemical environment was strongly influenced by reaction products, which accounted for 50%–30% of the mole fraction at low- and high-total gas flow respectively. Furthermore, the mole fraction of C2H2, HCN, and CO were found to be independent on the pressure, while for CH4 and NH3 the mole fractions increased with the pressure. Since all the concentrations of all detected species increased monotonously with the residence time, surface reactions should play a role in the production of the five species. HCN was the most abundant measured reaction product, ranging in the 10s of percent in mole fraction and followed by C2H2 and NH3, both in the high percent of mole fraction range. Since a stable plasma-chemical equilibrium was assumed, the production rates could be derived from the concentrations of the species. This allowed to distinguish CO from the other species, since its production rate is the only one to drop with the increase of flow. Further investigation then highlighted the linear decay of the CO production rate with the progressing active time of the plasma. The release of adsorbed oxygen-containing species from the large surface area of the carbon cathode during the plasma process is the likely source for oxygen in the formation of the CO molecule. The influence of the oxygen-contamination of the reactor was unique to the CO molecule and made conclusions about the dependency of its production rate on the total gas flow impossible.
However, for the production rates of the remaining four molecular species, dependencies on the total gas flow trends could be established. The dominating production rate is of HCN with up to 18 slh, followed up by the production rate of NH3, which increased from 0.25 to 7 slh with increasing total gas flow. While the production rates of all oxygen-free species increase monotonously with the total gas flow, the production rate scales over proportionally only for NH3. In addition, it shows the highest relative increase over the given range. For CH4, a linear scaling was observed. However, HCN and C2H2 production rates flatten with higher total gas flows. This is mirrored in the carbon consumption rate also flattening with higher total gas flows, indicating a limit to the amount of carbon released by the AS. The largest value for the carbon consumption rate in this experiment was approximately ΦC ≈ 12 g h-1, which for an AS with a mass of 30 kg allows for 2,500 hours of treatment time, assuming ideal circumstances. However, with the current data, a reduction of screen size is considered for further experiments.
Acknowledgments
We are grateful to E. Siegismund for technical support during the measurement campaign. F. Weichbrodt and U. Macherius provided additional technical support before and after the campaign. This work was supported by the German Research Foundation (DFG) within the framework of the projects FKZ: BI 418/31-1 and RO 2202/10-1.
References
- Casteletti L C, Neto A L and Totten G E 2014 Metallogr. Microstruct. Anal. 3 477–508.
- Bell T, Sun Y and Suhadi A 2000 Vacuum 59 14–23.
- Spies H-J 2013 J. Heat Treat. Mater. 68 86.
- Mittemeijer E J and Somers M A J 1997 Surf. Eng. 13 483–97.
- Olzon-Dionysio M, Campos M, Kapp M, de Souza S and de Souza S D 2010 Surf. Coat. Technol. 204 3623–8.
- Hubbard P, Patridge J G, Doyle E D, McCulloch D G, Taylor M B and Dowey S J 2010 Surf. Coat. Technol. 204 1145–50.
- Georges J 1999 US Patent Specification 5,989,363, 18.04.
- Gallo S C and Dong H 2009 Surf. Coat. Technol. 203 3669.
- Ebersbach U, Friedrich S, Nghia T and Spies H-J 1991 J. Heat Treat. Mater. 46 339.
- Skolek-Stefaniszyn E, Kaminski J, Sobczak J and Wierzchon T 2010 Vacuum 85 164–9.
- Yue W, Sun X, Wang C, Fu Z, Liu Y and Liu J 2011 Tribol. Int. 44 2029–34.
- Naeem M, Shafiq M, Zaku-ul-Islam M, Díaz-Guillén J C, Lopez-Badillo C M, Ullah N and Zakuallah M 2017 Mater. Lett. 189 213.
- Dong Y, Li X, Tian L, Bell T, Sammons R L and Dong H 2011 Acta Biomater. 7 447.
- Lebrun J P 2000 US Patent Specification 7,074,460 B2 18.04.
- Crespi  E et al 2011 Mater. Lett. 65 2985–8.
- Burlacov I, Hamann S, Spies H-J, Dalke A, Röpcke J and Biermann H 2017 J. Heat Treat. Mater. 72 254.
- Hamann S, Burlacov I, Spies H-J, Biermann H and Röpcke J 2017 J. Appl. Phys. 121 153301.
- Sproge L and Slycke J 1992 J. Heat Treat. 9 105–12.
- Lebrun J P 1996 European Patent Specification EP 0 801 142 B1 12.04.
- Burlacov I, Hamann S, Spies H-J, Röpcke J and Biermann H 2018 J. Appl. Phys. 123 233302.
- Hamann S, Börner K, Burlacov I, Hübner M, Spies H-J and Röpcke J 2013 Plasma Sources Sci. Technol. 22 055022.
- Puth et al 2018 Plasma Sources Sci. Technol. 27 075017.
- Dalke A, Burlacov I, Hamann S, Puth A, Böcker J, Spies H-J, Röpcke J and Biermann H 2019 Surf. Coat. Technol. 357 1060.
- Hamann S, Börner K, Burlacov I, Spies H-J, Strämke M, Strämke S and Röpcke J 2015 Rev. Sci. Instrum. 86 123503.
- Hamann S, Börner K, Burlacov I, Spies H-J and Röpcke J 2015 Contrib. Plasma Phys. 55 689.
- Lopatik D, Lang N, Macherius U, Zimmermann H and Röpcke J 2012 Meas. Sci. Technol. 23 115501.
- Röpcke J, Mechold L, Käning M, Anders J, Wienhold F G, Nelson D and Zahniser M 2000 Rev. Sci. Instrum. 71 3706.
- Gordon I et al 2017 J. Quant. Spectrosc. Radiat. Transfer 96 139.
- Ba Y et al 2013 J. Quant. Spectrosc. Radiat. Transfer 130 62.
- Cottaz C et al 2000 J. Mol. Spectrosc. 203 285.
- Gomez L, Jacquemart D, Lacome N and Mandin J-Y 2010 J. Quant. Spectrosc. Radiat. Transfer 111 2256.
- Maki A G, Mellau G C, Klee S, Winnewisser M and Quapp W 2000 J. Mol. Spectrosc. 202 67.
- Maki A G, Quapp W and Klee S 2000 J. Mol. Spectrosc. 171 420.
- Coxon J A and Hajigeorgiou P 2004 J. Chem. Phys. 121 2992.
- Hamann S, Börner K, Burlacov I, Spies H-J and Röpcke J 2015 J. Phys. D: Appl. Phys. 48 34.
Published February 27, 2020 • ©2020 The Author(s). Published by IOP Publishing Ltd.; Plasma Sources Science and Technology, Volume 29, Number 3. This is an open-access article under the CC BY license (creativecommons.org/licenses/by/3.0). The article was edited to conform to the style of Thermal Processing magazine. The original article is available at: iopscience.iop.org/article/10.1088/1361-6595/ab6e58


 general practice for CQI-9 and AMS2750E")


