


The heat treatment of steel changes its microstructure, its hardness, and its tensile strength. These issues are of utmost importance as they are closely related to its uses and applications. This article is an experiment, conducted at the university laboratory of physical metallurgy. It assesses the abovementioned issues in the cases of various steel samples, each of which undergoes a different type of heat treatment. Using the appropriate methodology and techniques, various conclusions are drawn. The main objective of this article is to explain this methodology.
1 Introduction
In order to be made appropriate for various uses and applications, steel has to undergo various procedures such as quenching, tempering, and annealing. Those procedures of heat treatment change the microstructure of steel. Its grade (hypoeutectoid, hypereutectoid, etc), determined by its content in carbon, is of utmost importance.
The measurement of hardness and tensile strength poses an important issue as regards the heat treatment of steel, so that various types of steel can be produced, depending on their future use.
This work is an experimental procedure that was conducted at the laboratory of physical metallurgy of the National Technical University of Athens, Greece. It is a case study on the measurement of hardness and tensile strength of steel. It is important to note that it was carried out under laboratory conditions, concerning the time sets and temperature used in the procedures. Through the use of the appropriate methodology, namely the use of the T-T-T diagram, the hardness/tensile strength conversion chart and obtaining the objective functions, the article draws conclusions on various steel samples, each of which undergoes heat treatment under different conditions, such as a different cooling rate and cooling temperature or a different tempering temperature. Consequently, the article does not discuss any innovations; it aims to explain the methodology and techniques that are applied in the various stages of heat treatment of steel.
 2 Experimental Procedure
2.1 Microstructure
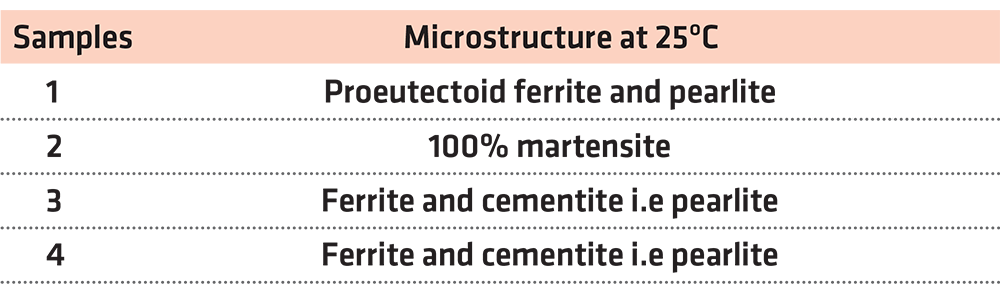
The first experiment focuses on the microstructure of steel. We had four hypoeutectoid steel samples with a 0.53% carbon content. The first sample did not undergo any treatment, and it retained its initial properties. The rest of the steel samples were placed in a furnace in 900°C for 15 minutes in order to undergo austenitizing. After being heated, the second sample underwent rapid cooling in a water container. The third sample was left to cool at room temperature for approximately 20 minutes. Finally, the fourth sample was left in the furnace thats door had been left half open in order to drop the temperature from 900°C to 600°C for about 20 minutes and then it underwent rapid cooling in water.
After the completion of the abovementioned procedure, we conducted a test to measure the hardness of the four samples. The findings of the test are presented in Table 1.

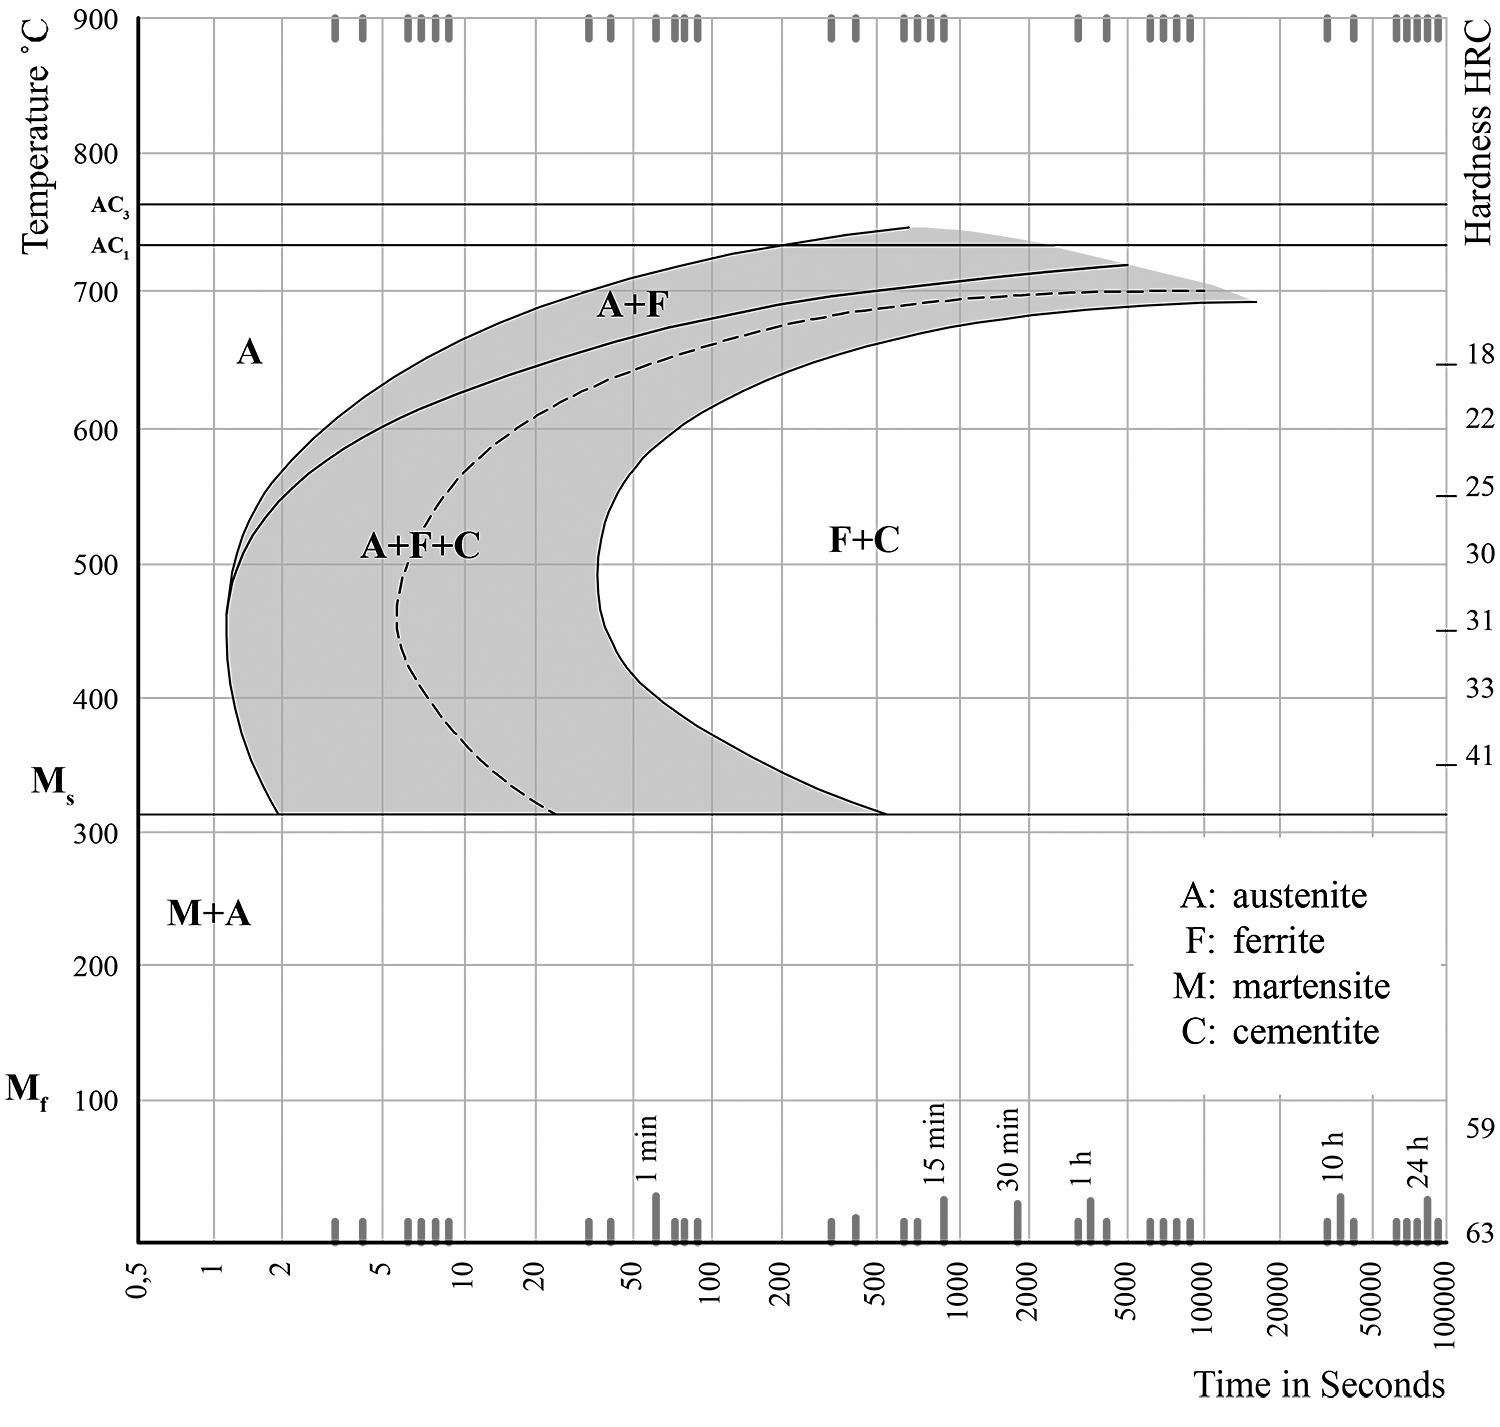
The results of our test shall now be explained through the aid of the T-T-T diagram and any possible deviations shall be justified. (Figure 1)
1st steel sample
As we have already mentioned, the first sample did not undergo any procedure, and it retained its original properties as well as its initial microstructure. In other words, a transformation of austenite to martensite or any other transformation whatsoever was not observed. To be more specific, since the case in point is about hypoeutectoid steel with a 0.53% carbon content, its microstructure should be proeutectoid ferrite and pearlite.
2nd steel sample
The second sample was cooled rapidly from 900°C, so we observe a martensitic transformation. The hardness of the sample is estimated at 59 (HRC). Therefore, it is below the Mf in the T-T-T diagram. This means that all the austenite has been transformed into martensite. Therefore, the final microstructure is 100% martensite.
3rd steel sample
The third sample was left to cool slowly at room temperature. Its hardness measures 27 (HRC), and, according to the T-T-T diagram, it is within the F+C region. In other words, the sample consists of ferrite and cementite, i.e. pearlite. The cooling process was slow, and the austenite had not been transformed into martensite.
4th steel sample
In this case as well, the cooling process was slow, and the conditions were not appropriate for a martensitic transformation. Austenite transforms into ferrite and cementite, i.e. pearlite. Any further cooling, even a rapid one, formed. According to the T-T-T diagram, for HRC = 22, we are in the F+C region. To put it another way, the sample consists of ferrite and cementite.
The above mentioned are presented in the T-T-T diagram that concerns the transformation phase of the 2nd, the 3rd, and 4th steel samples during heat treatment.
2.1.1 Results and Discussion
Consequently, we reach the conclusions presented on Table 2.
It is observed that only rapid cooling causes martensitic transformation (2nd sample). The slower the cooling process, the more the reduction in hardness without the occurrence of martensitic transformation (3rd and 4th sample). Martensitic transformation occurs only in the case of the first rapid cooling (2nd sample vs. 4th sample). Bear in mind that, through the use of an electron microscope, we will proceed to analyze the microstructure of the samples.
2.2 Hardness and Tensile Strength
The second experiment intends to measure the hardness and the tensile strength of steel. A diagram depicting the changes in hardness and tensile strength of four steel samples of 0.53% C in relation to their tempering temperature shall be constructed. The findings we collected during tempering shall be compared and further explained.
For this part of the experiment, four samples of hypoeutectoid steel with 0.53% carbon content were placed in the furnace and heated at 900°C for 15 minutes. Afterwards, the samples were cooled in water containers.
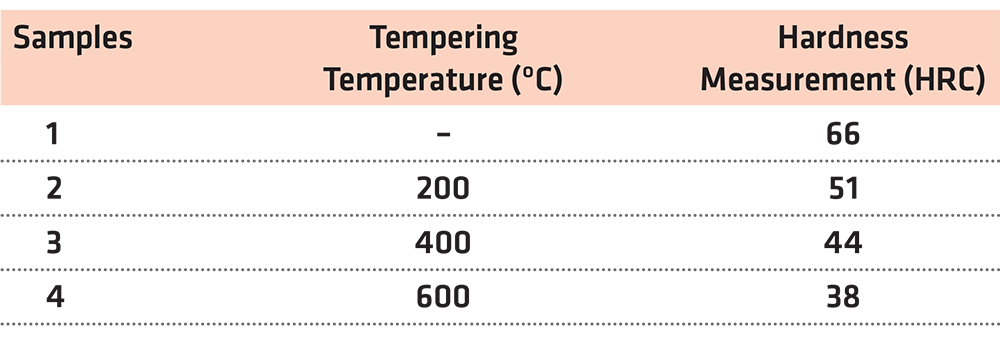
Following heat treatment, the first sample was kept as a point of reference. The second steel sample was placed in a furnace in 200°C for 1 hour while the third steel sample was placed in a furnace in 400°C for 1 hour. Finally, the fourth steel sample was placed in a furnace in 600°C for 1 hour. Afterwards, the samples were left to cool in water containers.
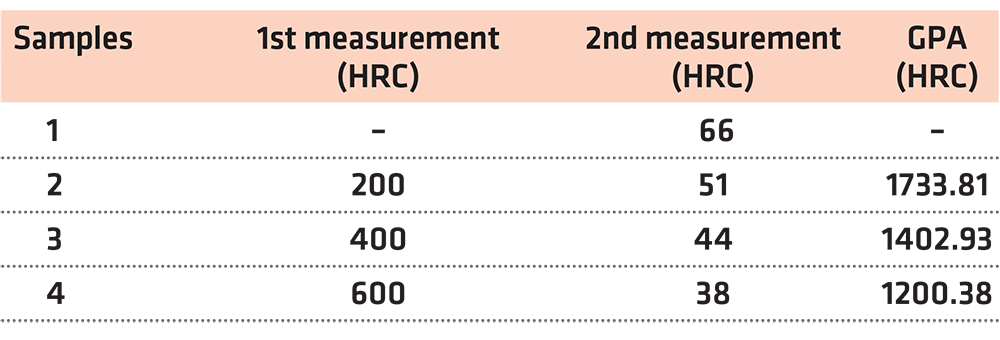
After the abovementioned procedures, the hardness of the four samples was measured. The findings of this test are presented in Table 3.
In order to find the tensile strength of the samples that is equivalent to their hardness measurements, we shall go to the table depicting the hardness/tensile strength conversion chart (DIN EN ISO 18265).
In the case of hardness HRC = 66
There is no equivalent tensile strength to a HRC = 66 hardness.
In the case of hardness HRC = 51
The closest value on the table is the HRC = 51.1. In this case, we take into account the three values above and the three values below our initial one, and we create a diagram and the objective function. (Table 4) (Figure 2)
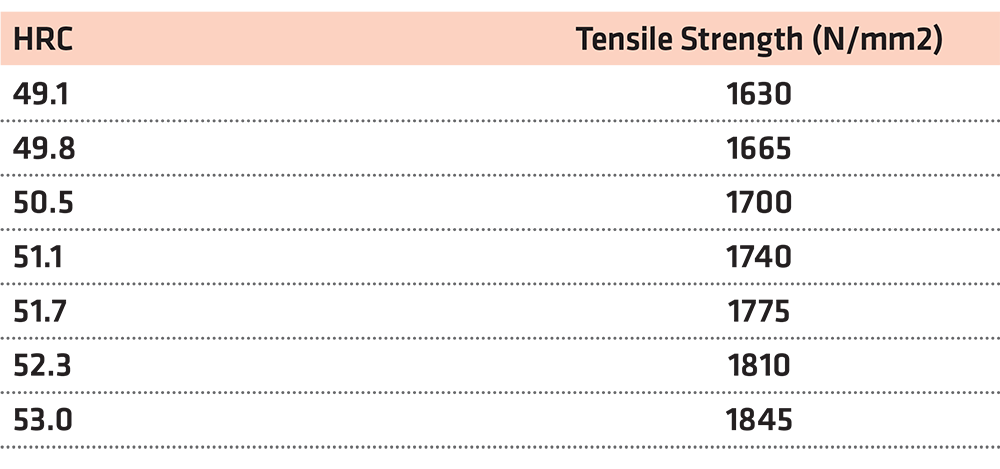
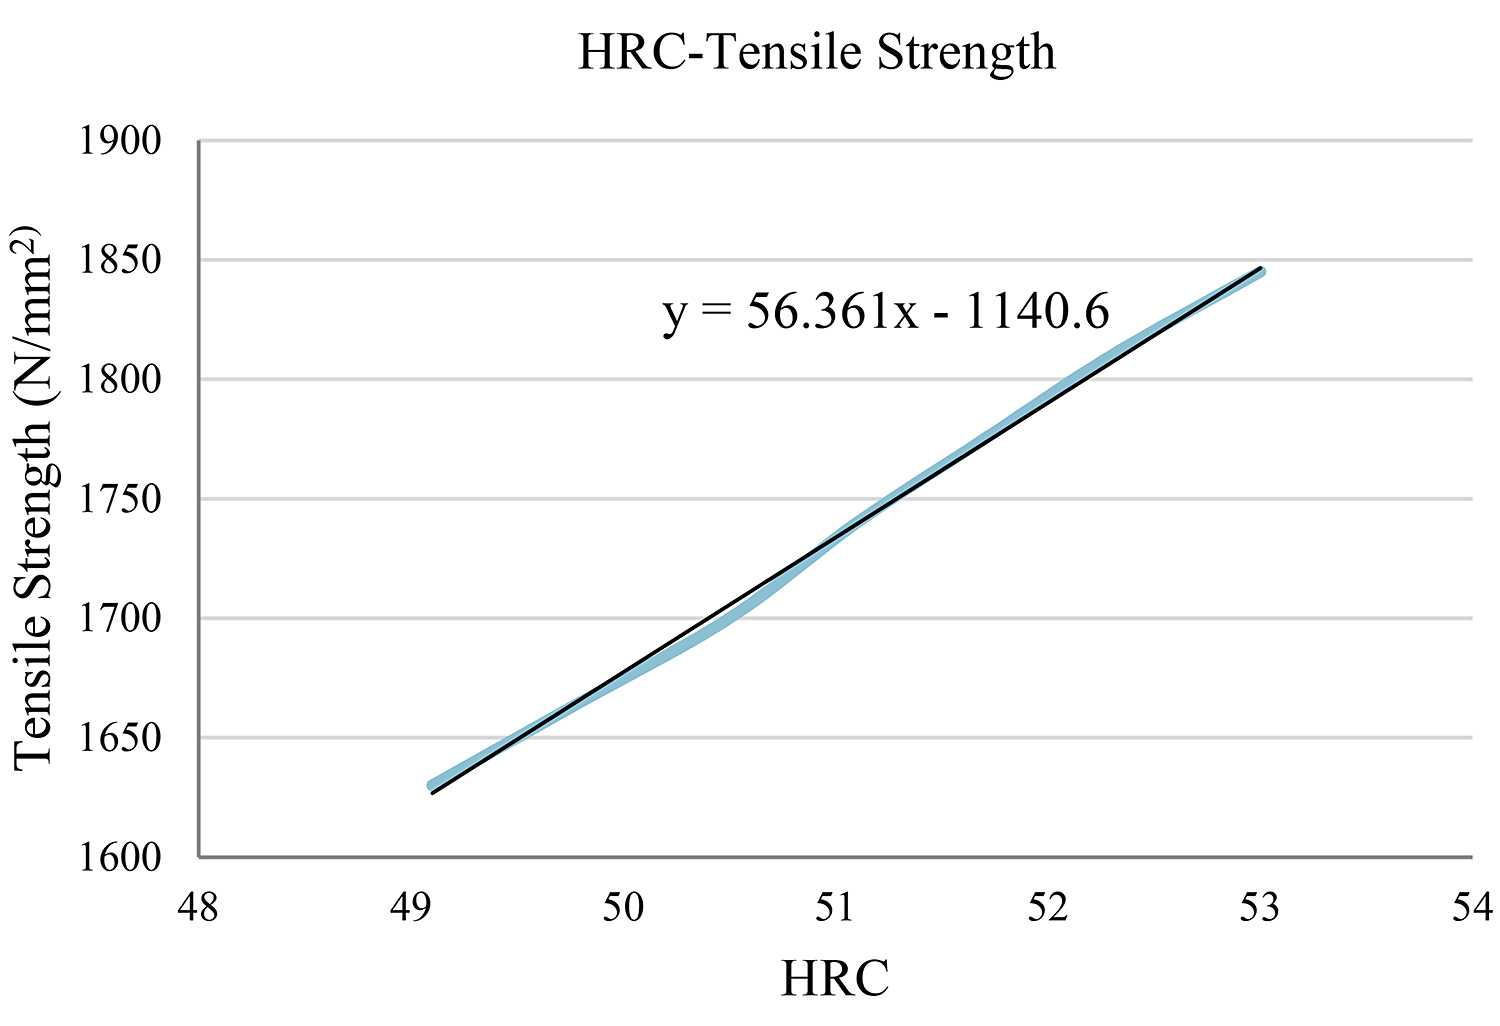
Using the function y = 56.361x – 1,140.6 for x = 51, we reach the conclusion that the tensile strength is y = 1,733.81N/mm2.
In the case of hardness HRC = 44
In this case, we work in the same way. Here, the closest value on the table is HRC = 44.5. (Figure 3) (Table 5)
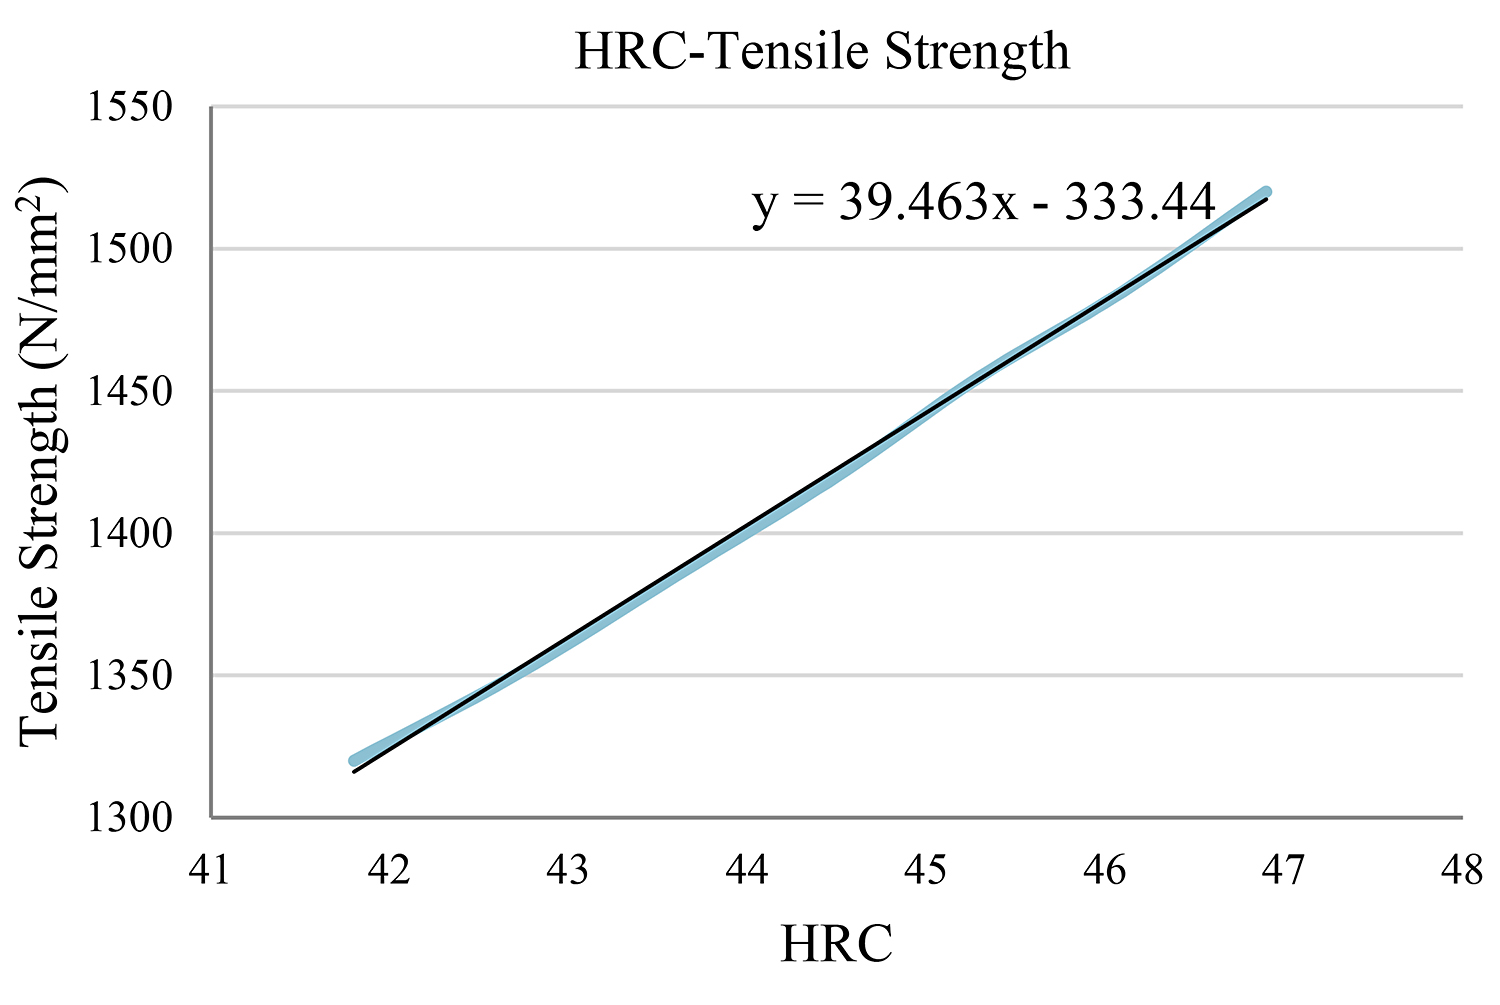
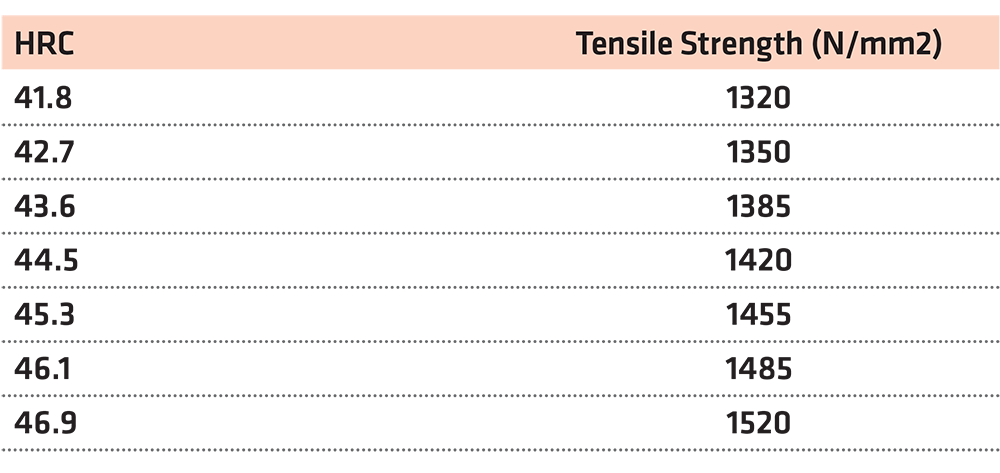
Using the function y = 39.463x – 333.44 for x = 44, we reach the conclusion that the tensile strength is y = 1,402.93N/mm2.
In the case of HRC = 38
Similarly, in this case, the closest value on our table is HRC=37.7. Therefore, using the three values below and above this one, we are able to obtain the objective function. (Table 6) (Figure 4)
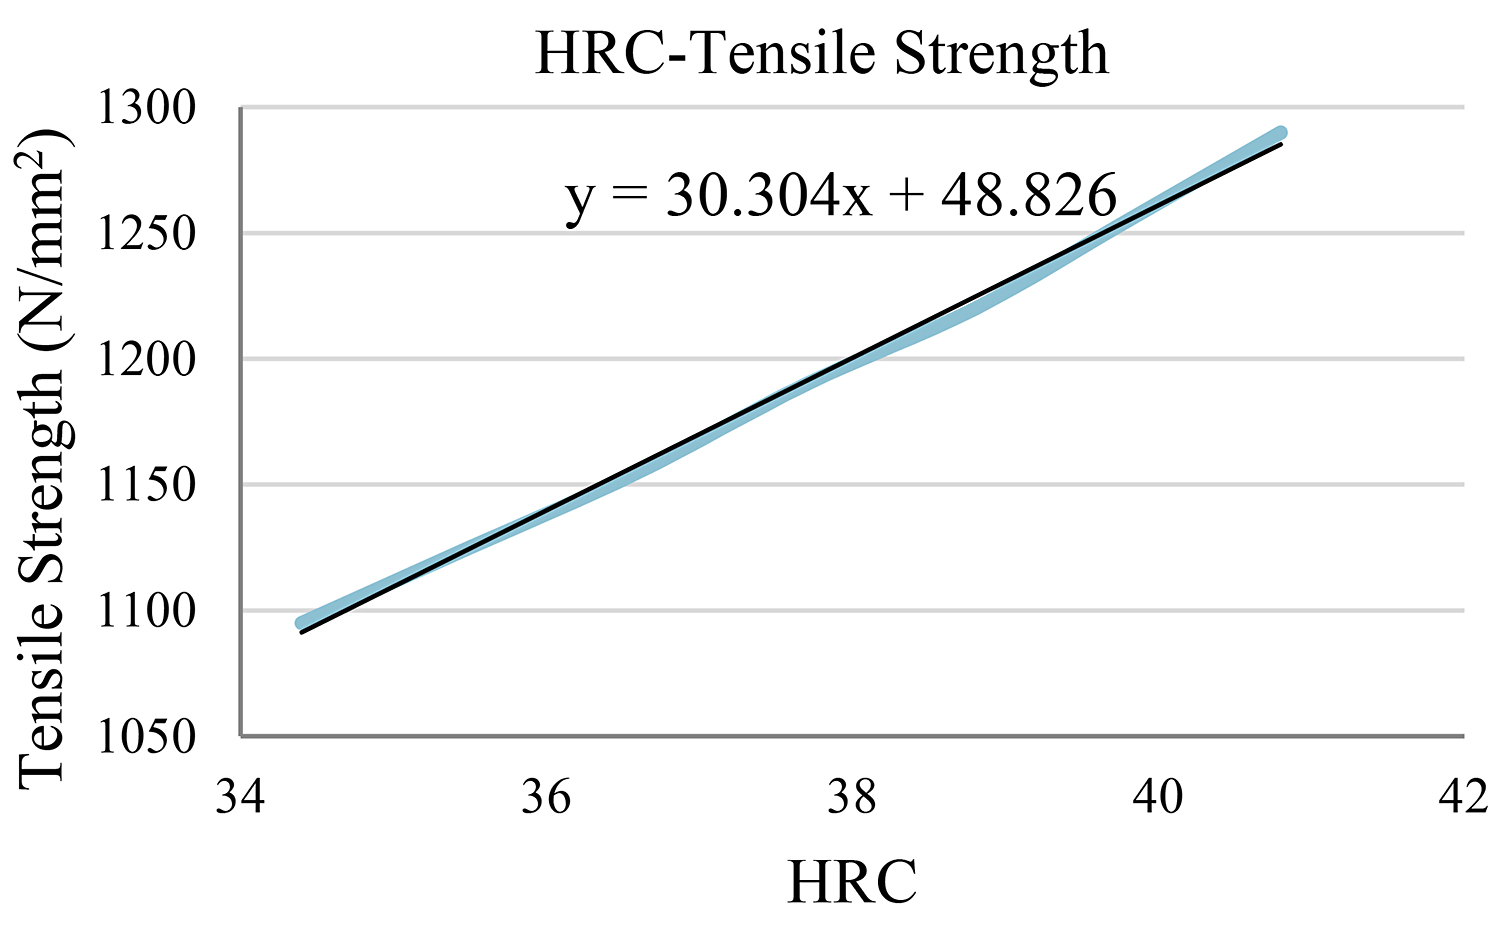
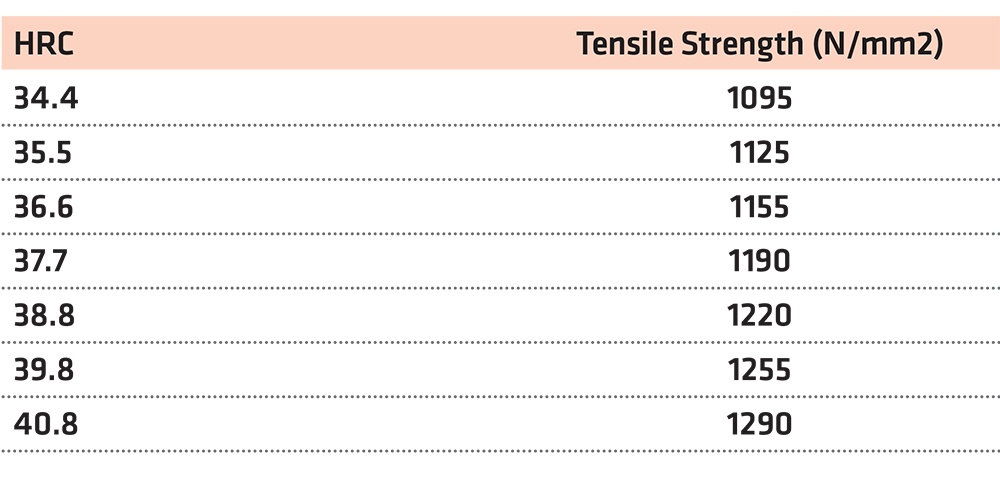
Using the function y = 30.304x + 48.826 for x = 38, the tensile strength is y = 1,200.38N/mm2.
Bearing in mind the above-mentioned, we reach the conclusions presented in Table 7.
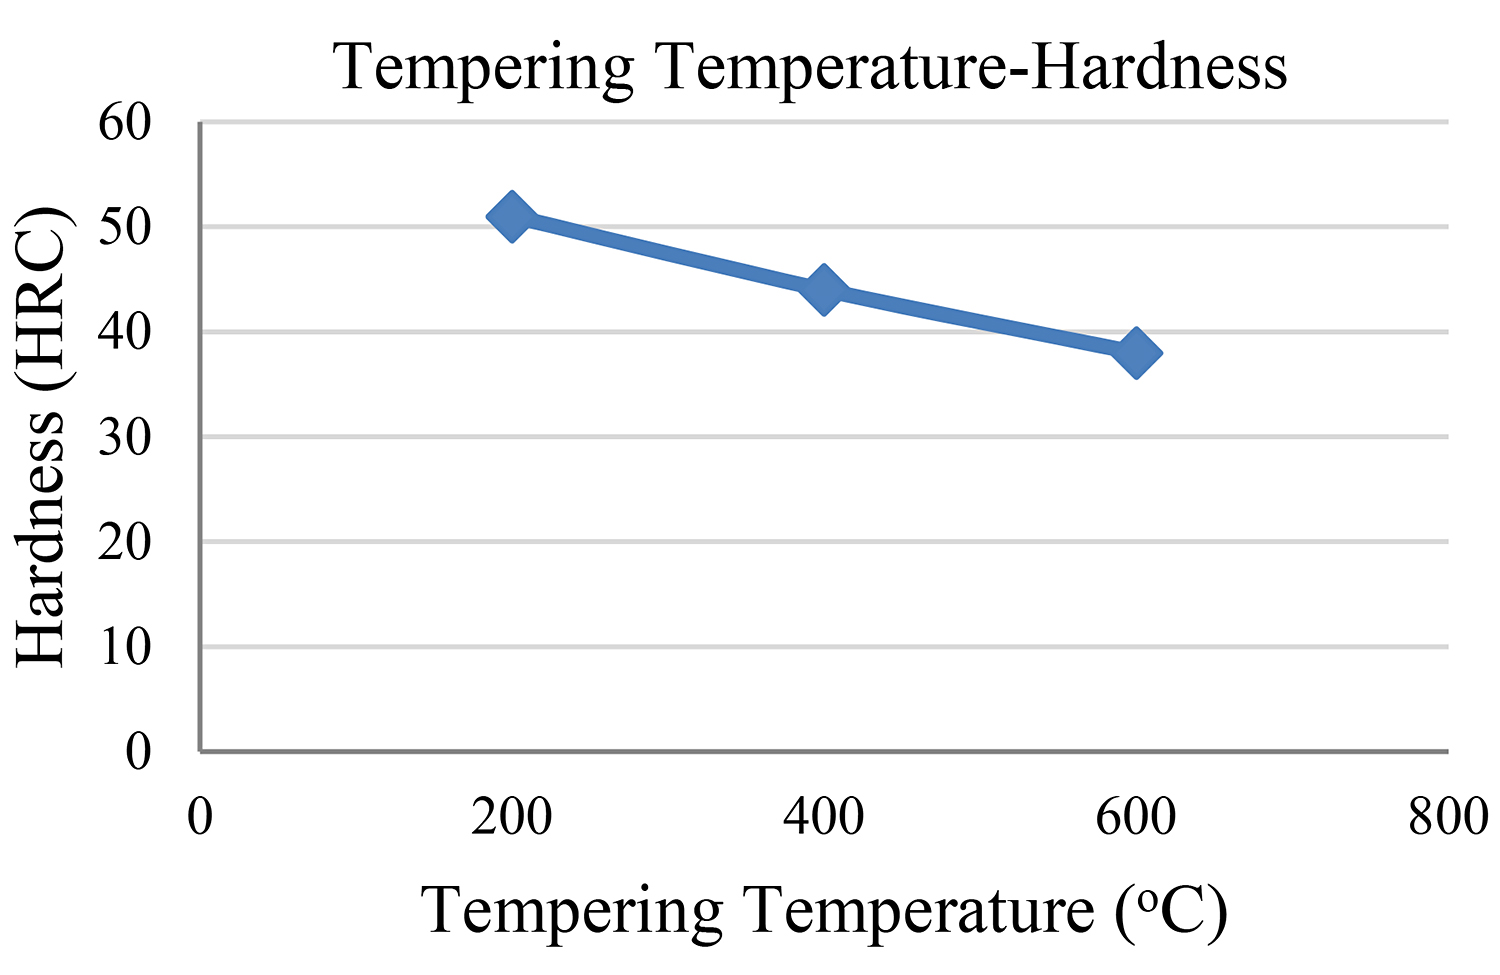
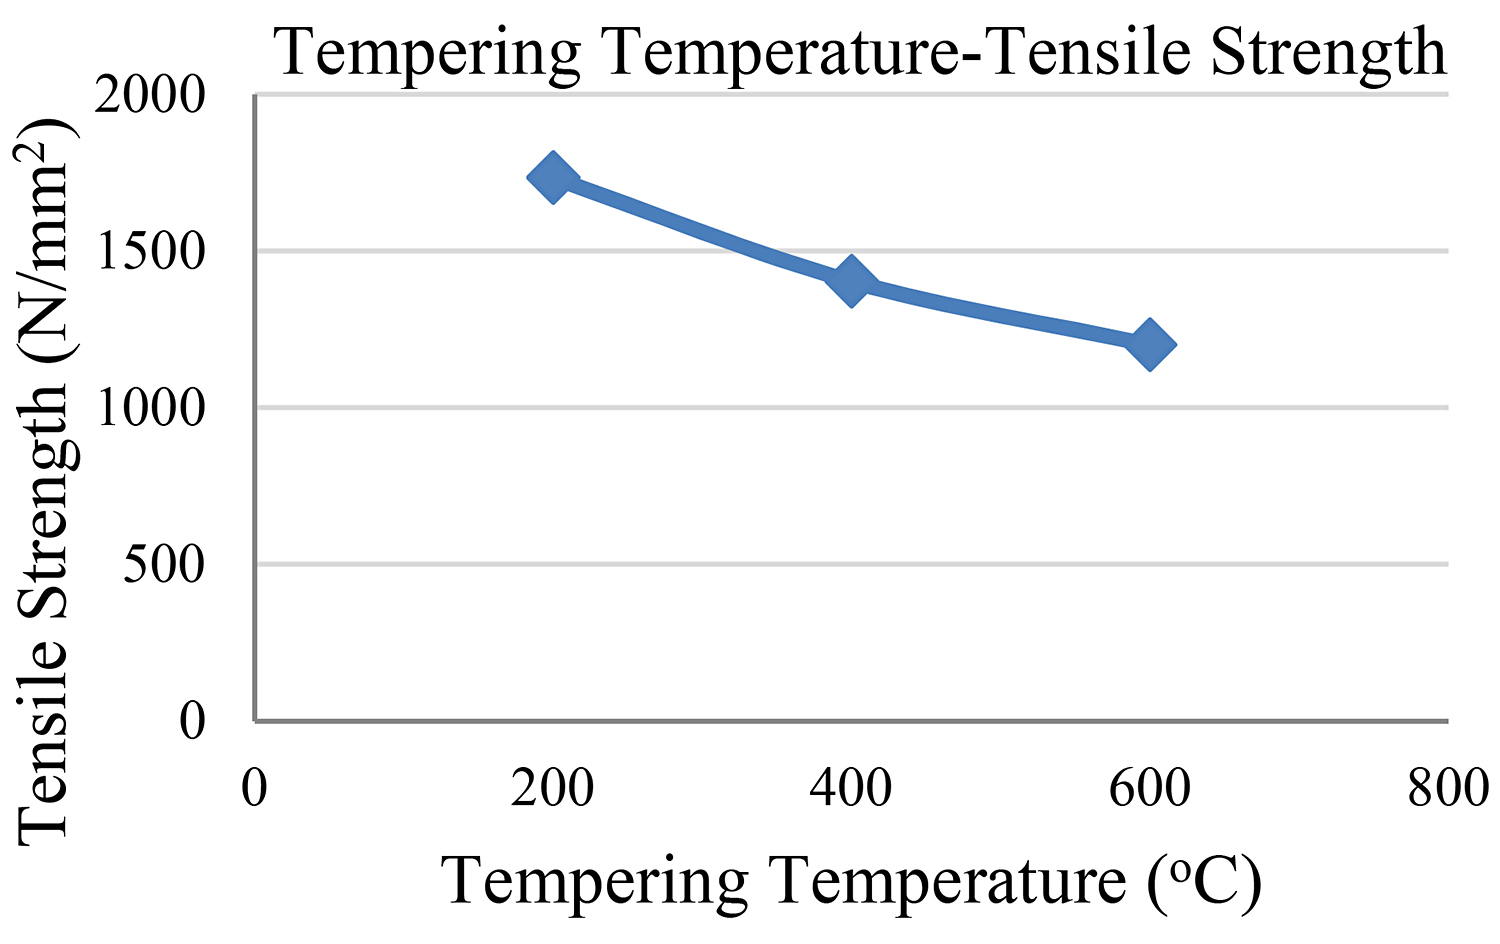
The abovementioned findings concerning all four steel samples are depicted in Figures 5 and 6.
3 Results and Discussion
Bearing in mind the findings of our experimental study, we reach the conclusion that the second sample — the one with the 200°C tempering temperature — showed the highest measurement of tensile strength. The third sample followed as regards its tensile strength while the fourth sample shows the lowest measurement of tensile strength.
It makes perfect sense that our initial sample shows the highest hardness measurements as well as the lowest ductility measurement.
It is observed that the higher the tempering temperature, the lower the reduction in both hardness and tensile strength. We must also bear in mind that the tempering time remained the same (1 hour) in the cases of all samples so that hardness would not be influenced by the time factor.
References
- Laboratory of Physical Metallurgy. (n.d.). Heat Treatment of Steel. Athens, Greece: School of Mining and Metallurgical Engineering, National Technical University of Athens.
- Laboratory of Micromachinery and Manufacturing Modeling. (n.d.). Heat Treatment of Steel. Chania – Crete, Greece: Department of Production Engineering and Management, Technical University of Crete.
- Papadimitriou, G. D. (1993). Physical Metallurgy II – The Alloys. Athens, Greece: National Technical University.
Copyright for this article is retained by the author, with first publication rights granted to the Journal of Materials Science Research.
This is an open access article (https://doi.org/10.5539/jmsr.v6n2p63) distributed under the terms and conditions of the Creative Commons Attribution (CC BY) license (https://creativecommons.org/licenses/by/4.0/). The article has been edited to conform to the style of Thermal Processing magazine.


 general practice for CQI-9 and AMS2750E")


