


Three-dimensional printing is a useful and common process in additive manufacturing. The advantage of additive polymer technology is its rapidity and design freedom. Polymer materials’ mechanical properties depend on the process parameters and the chemical composition of the polymer used. Mechanical properties are very important in product applicability. The mechanical properties of polymers can be enhanced by heat treatment. Additive-manufactured PLA’s mechanical properties and structure can be modified via heat treatment after the 3D printing process. The goal of this research was to test the effect of heat treatment on the mechanical and structural parameters of additive-manufactured PLA. This was achieved via the FDM processing of standard PLA tensile test specimens with longitudinal and vertical printing orientations. After printing, the test specimens were heat-treated at 55°C, 65°C and 80°C for 5 hours and after being held at 20°C for 15 hours. The printed and heat-treated specimens were tested using tensile tests and microscopy. Based on the test results, we can conclude the optimal heat treatment process temperature was 65°C for 5 hours. Under the heat treatment, the test specimens did not show any deformation, the tensile strength increased by 35 percent and the porosity of the PLA structure decreased.
1 Introduction
Additive manufacturing is an advanced manufacturing process used to rapidly prepare prototype components, innovate a new geometry, or replace parts. PLA is a very useful and common polymer material widely used for the additive manufacturing process. PLA is a biodegradable and biocompatible thermoplastic polymer [1,2]. Melt polycondensation in PLA processing can be carried out without organic materials or a solvent. This method is simple, making the technology cheap, but the sensitivity of the reaction conditions is a major problem [3,4]. PLA is considered a bioplastic because it is produced from materials derived from renewable biomass products. The thermal, mechanical, and biodegradation characteristics of lactic acid polymers are known [5,6]; they are made up of lactic acid units, which are small organic acids similar to those found in many of the foods we encounter every day — think sourdough bread, yogurt, soy sauce, and, of course, corn. Anything with glucose in it can theoretically be converted into lactic acid molecules. Among other things, their low glass transition temperature makes PLA parts easy to melt and manipulate, and, therefore. easy to 3D print [7]. However, this low glass transition value is also the reason why PLA parts are relatively less resistant to ambient temperatures.
 Additive manufacturing, also known as 3D printing, has been in use in the industry for about 30 years and, in recent years, has been used for rapid prototyping and small-batch production of plastic and metal products. The additive manufacturing technologies (FDM, EBF, DMLS, EBM, SHS, SLS, PP, LOM, SLA, DLP) use different but essentially similar processes to produce a three-dimensional shape. FDM is a complex additive manufacturing process with a large number of technical parameters that influence product quality and material properties, and the combination of these parameters is often difficult to understand [7,8]. The printing parameters, such as printing orientation, layer thickness, raster angle, raster width, air gap, infill density, and pattern and feed rate, have a substantial effect on the quality of FDM-printed parts [9,10,11,12].
The machine builds the spatial object layer by layer. The starting point is always a virtual model, which the target software converts into interpretable instructions before printing [8]. These technologies are mainly used in rapid prototyping, where production times can be reduced from weeks to one to two days. Rapid prototyping can quickly complete the development phase, allowing the tool to be made for mass production or even 3D printed. Increasingly, 3D printing is being used for small batches or one-off items for the final product. FDM printers process plastic fibers wound on a spool by melting them and then printing them layer-by-layer on a printing platform [7,8,9,10,11,12]. Thanks to the compatibility of materials and their user-friendliness, FDM printers are among the most popular 3D printers on the market. Among the process parameters that are most relevant to the mechanical properties is the printing direction [7,13]. The mechanical parameters of additive-manufactured polymers can be enhanced with heat treatment after the printing process [14,15,16,17,18,19,20,21,22,23,24,25]. The material properties of 3D-printed samples can be characterized via material testing [26,27]. Several researchers have conducted tensile tests to determine FDM-printed and heat-treated specimens’ mechanical properties, measuring the increase in UTS (32%) by annealing the specimens at 90°C for 1 hour [25].
Polymer additive technology is widely used in many areas today, such as the aerospace, automotive, food, and healthcare industries [28]. PLA is a biodegradable polymer useful for several applications, and this material can be composted.
This study aimed to find a cheap and suitable process and material for the rapid fabrication of laboratory devices. The dimensions of the device were determined considering the geometry of the tested specimen. The choice of material was primarily based on the need to choose a material with low density and adequate strength, due to the manual handling required for this study. The aim was to identify the specifications of a complex technology that give the best result using the chosen material quality and production technology.
2 Materials and Methods
2.1 3D Printing of the Test Specimens
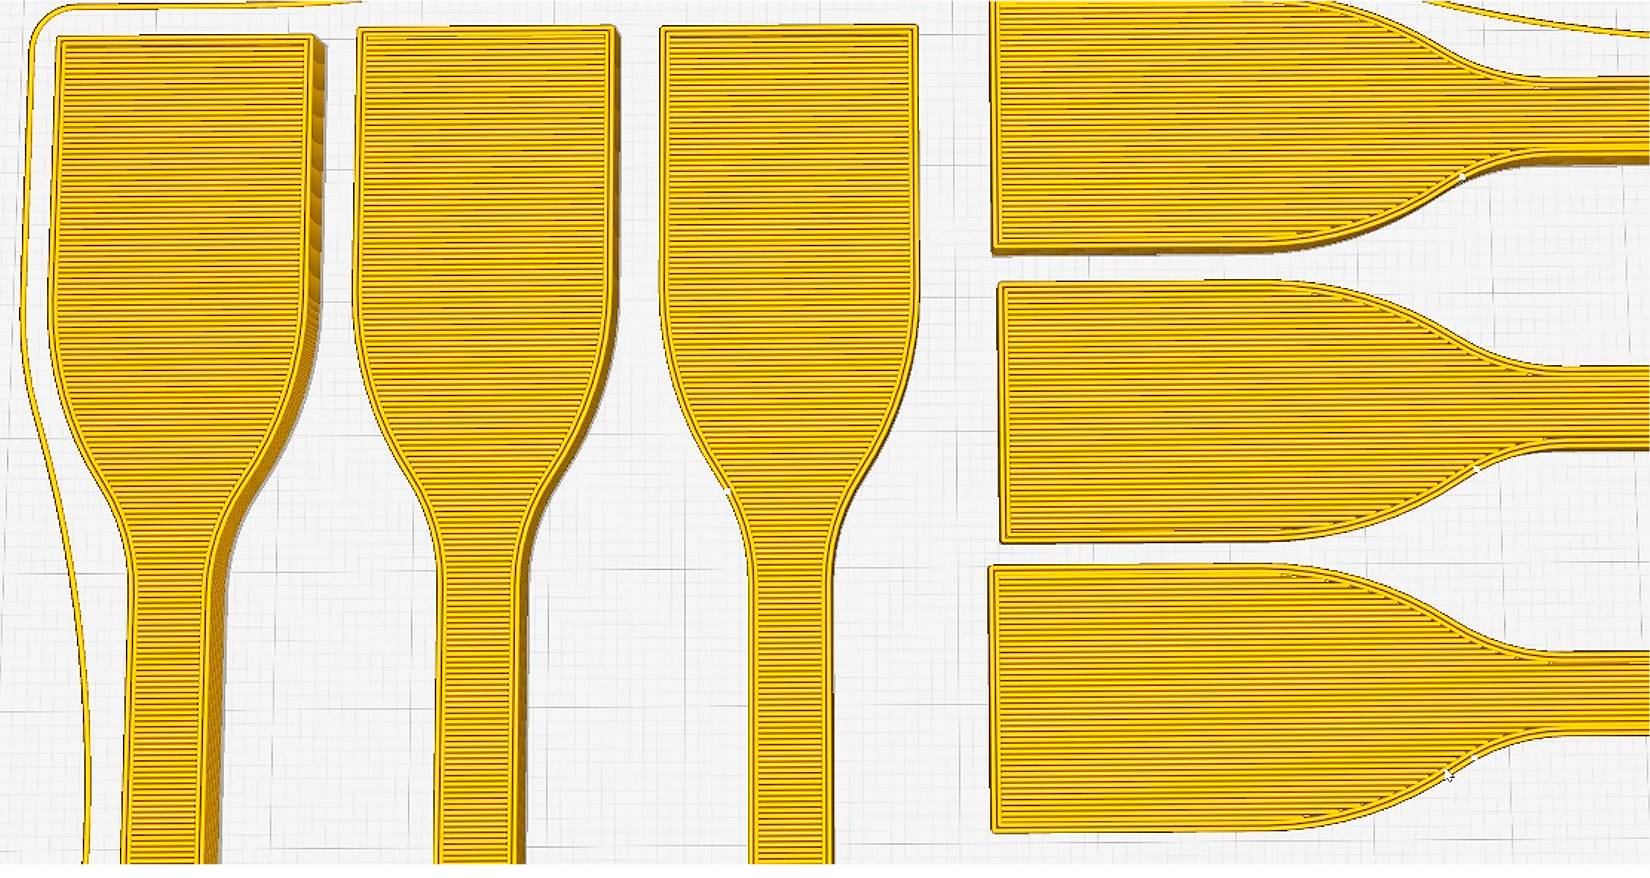
The test specimens were prepared via the FDM process, and the printer used was the Ultimaker S5 Pro Bundle (Ultimaker, Utrecht, The Netherlands) with the Ultimaker Cura 5.0 software (Ultimaker, Utrecht, The Netherlands). The equipment used operated with efficient air filtration and humidity control. The filament material used was an Ultimaker PLA (RAL 1003) (Ultimaker, Utrecht, The Netherlands) with a 2.85 ± 0.10 mm diameter and 1.24 g/cm3 density on the base of the technical datasheet of the filament. The used printer’s maximal power was 600 W, and the position precision in X-Y-Z axes was 6.9 µm, 6.9 µm, and 2.5 µm. The layer resolution supported by Makerbot (Ultimaker, Utrecht, The Netherlands) was 20-600 µm. The used PLA filament’s ultimate tensile strength (UTS) was 49.5 MPa. The geometry of the printed specimens was suited to the ASTM D638 IV standard tensile test specimen (length 115 mm, width 6 mm and thickness 3.6 mm). The test samples were printed in vertical and longitudinal orientations. The test samples’ orientations on the printer table are shown in Figure 1.
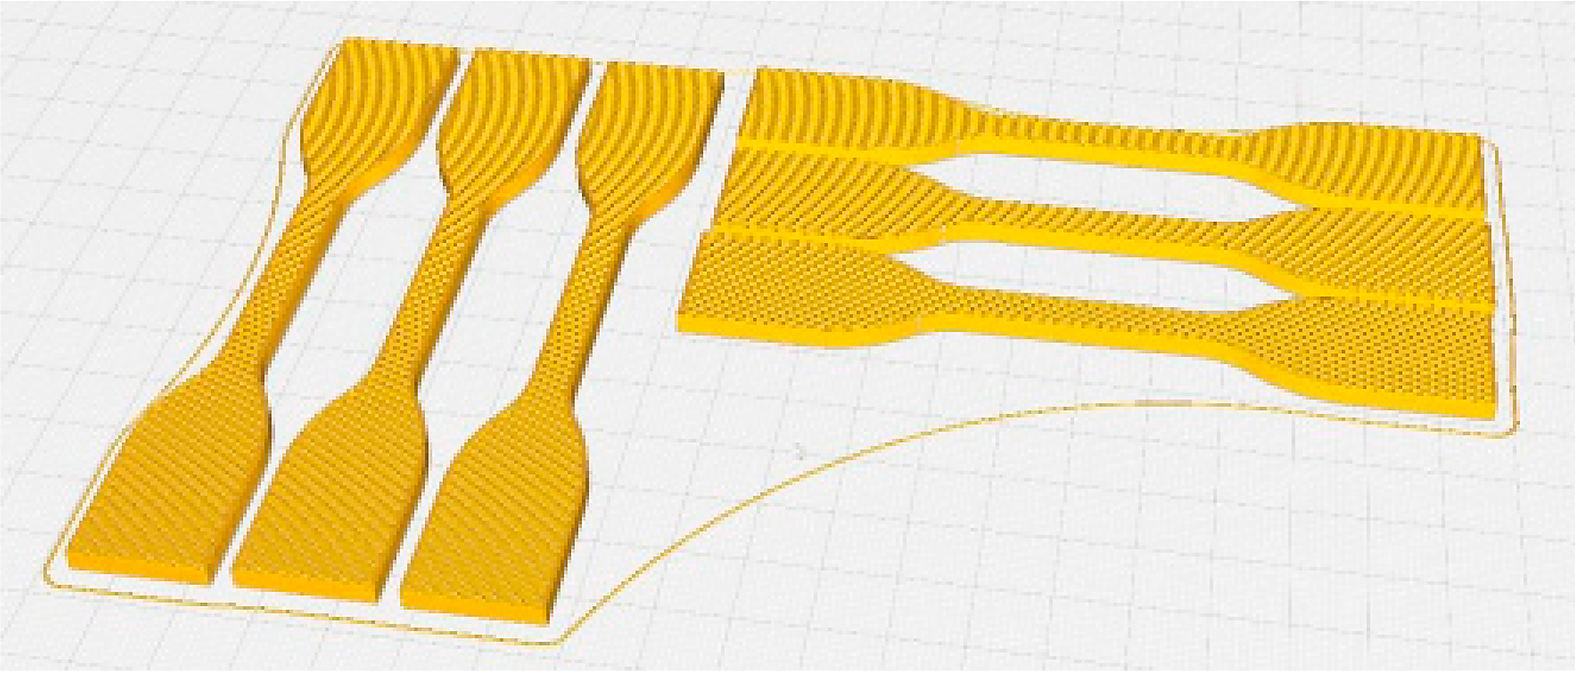
The test samples were printed without support. The work table was preheated to 60°C, and the extruder melted the PLA filament at 200°C. The printing speed was 35 mm/min, and the prepared layer thickness was 0.2 mm. Printing parameters were chosen according to the filament and printer manufacturer’s recommendations. All specimens were made with 22 layers with constant orientation. The printing time for three vertically and three horizontally orientated specimens was 4.5 hours. Vertical orientation refers to a position perpendicular to the test specimen’s length, and the horizontal orientation corresponds to the test specimen’s length (Figure 2).
The cooling time of the test specimens after printing was 15 hours. The cooling process was carried out in open air at room temperature (20°C) in standard humidity conditions.
2.2 Heat Treatment Process
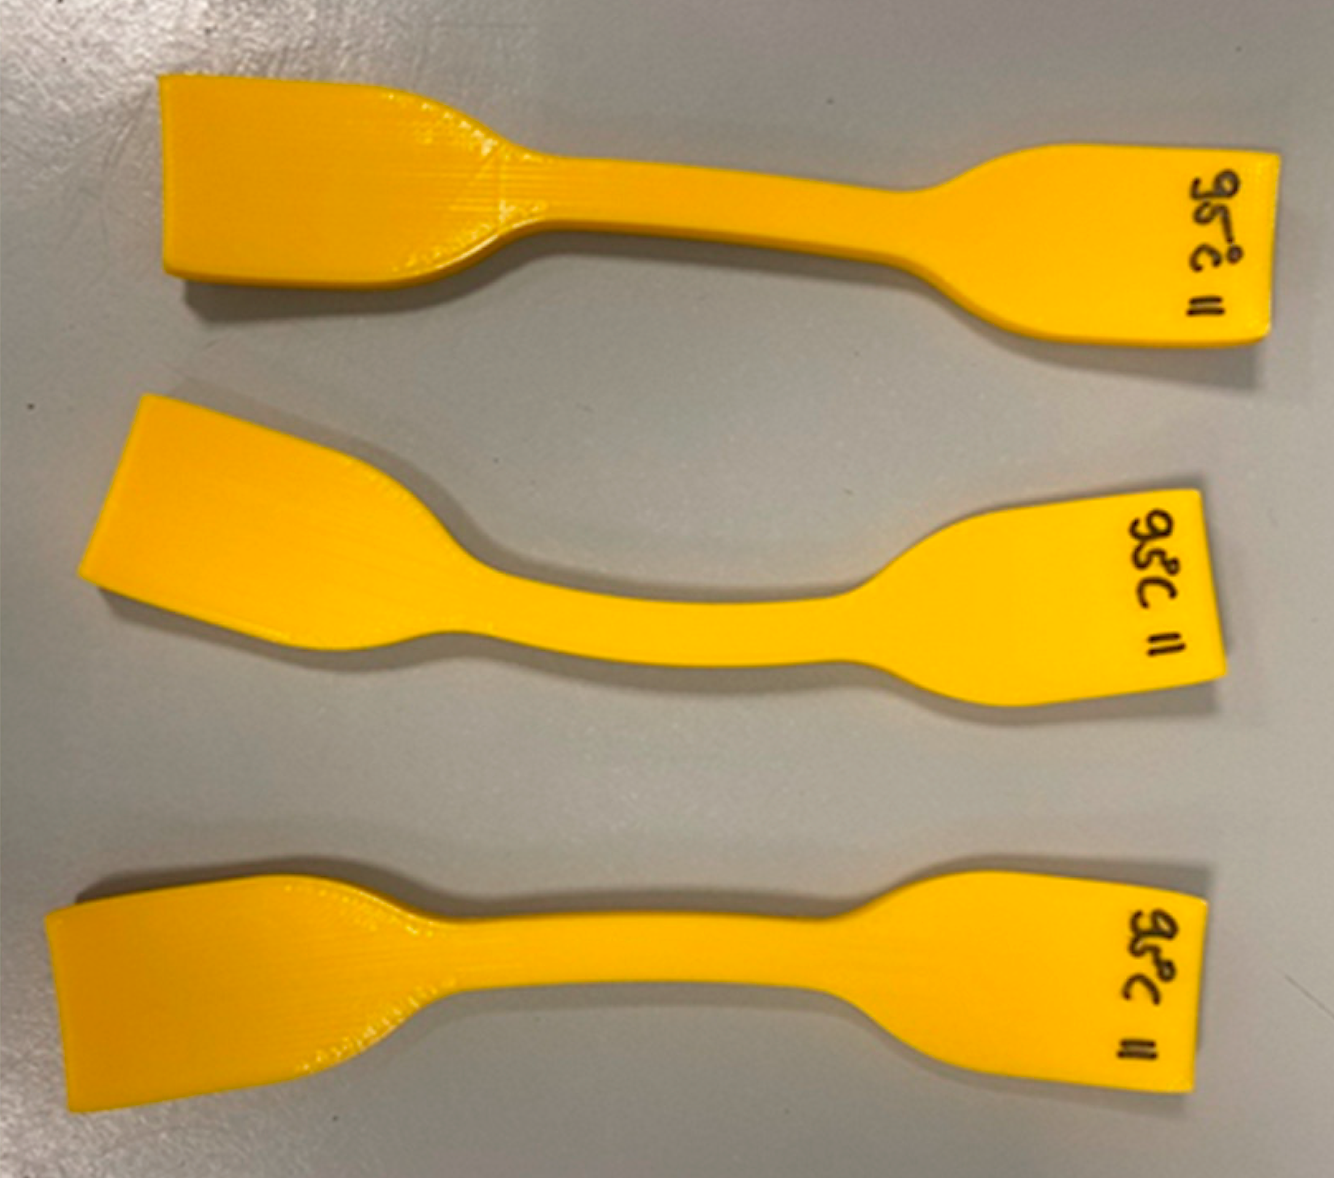
The heat treatment was carried out for 15 hours and took place in a precision furnace preheated to a standard temperature. The heat treatment temperatures were 55°C, 65°C, 80°C, and 95°C. Cooling was carried out in the open air at room temperature for all specimens for 15 hours. After the cooling period, all test specimens were tested via visual inspection and size control using a caliper. After the heat-treatment process, the specimens heat-treated at 95°C were significantly deformed. The heat-treated test specimens’ deformation can see in Figure 3. The other heat-treated specimens did not show any deformation and kept their original geometry and sizes. The deformed specimens were not examined further.
2.3 Tensile Test
The tensile test was conducted using a mechanical testing machine. We measured the maximal force (Fmax) and determined the tensile strength using Equation 1.
 where S0 is determined using Equation 2:
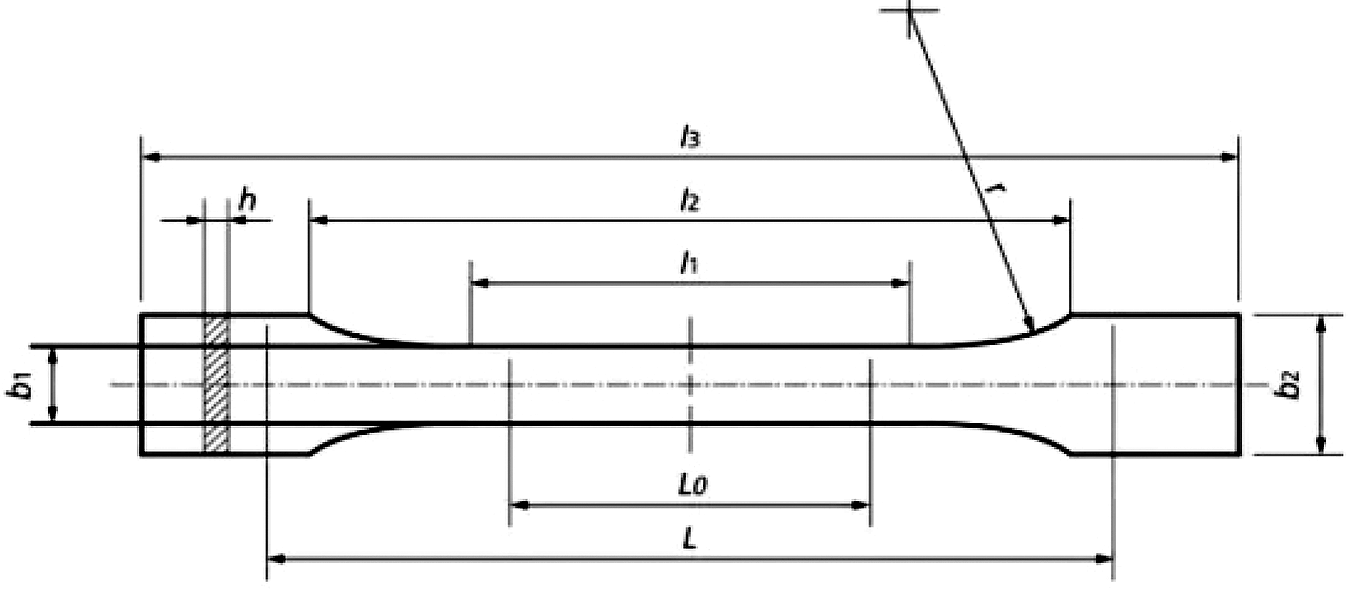
 where b1 is the width and h is the thickness of the test specimen. The design of the standard test specimen is shown in Figure 4.
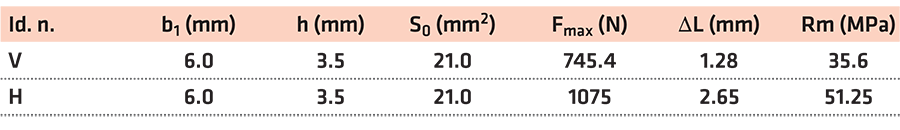
A tensile test was carried out on the printed test specimens to determine their tensile strength as a function of the orientation. Five specimens in both orientations were tested. The results (vertical orientation, V, horizontal orientation, H) of the tests are shown in Table 1. The tensile test was carried out at room temperature in climatized environments.
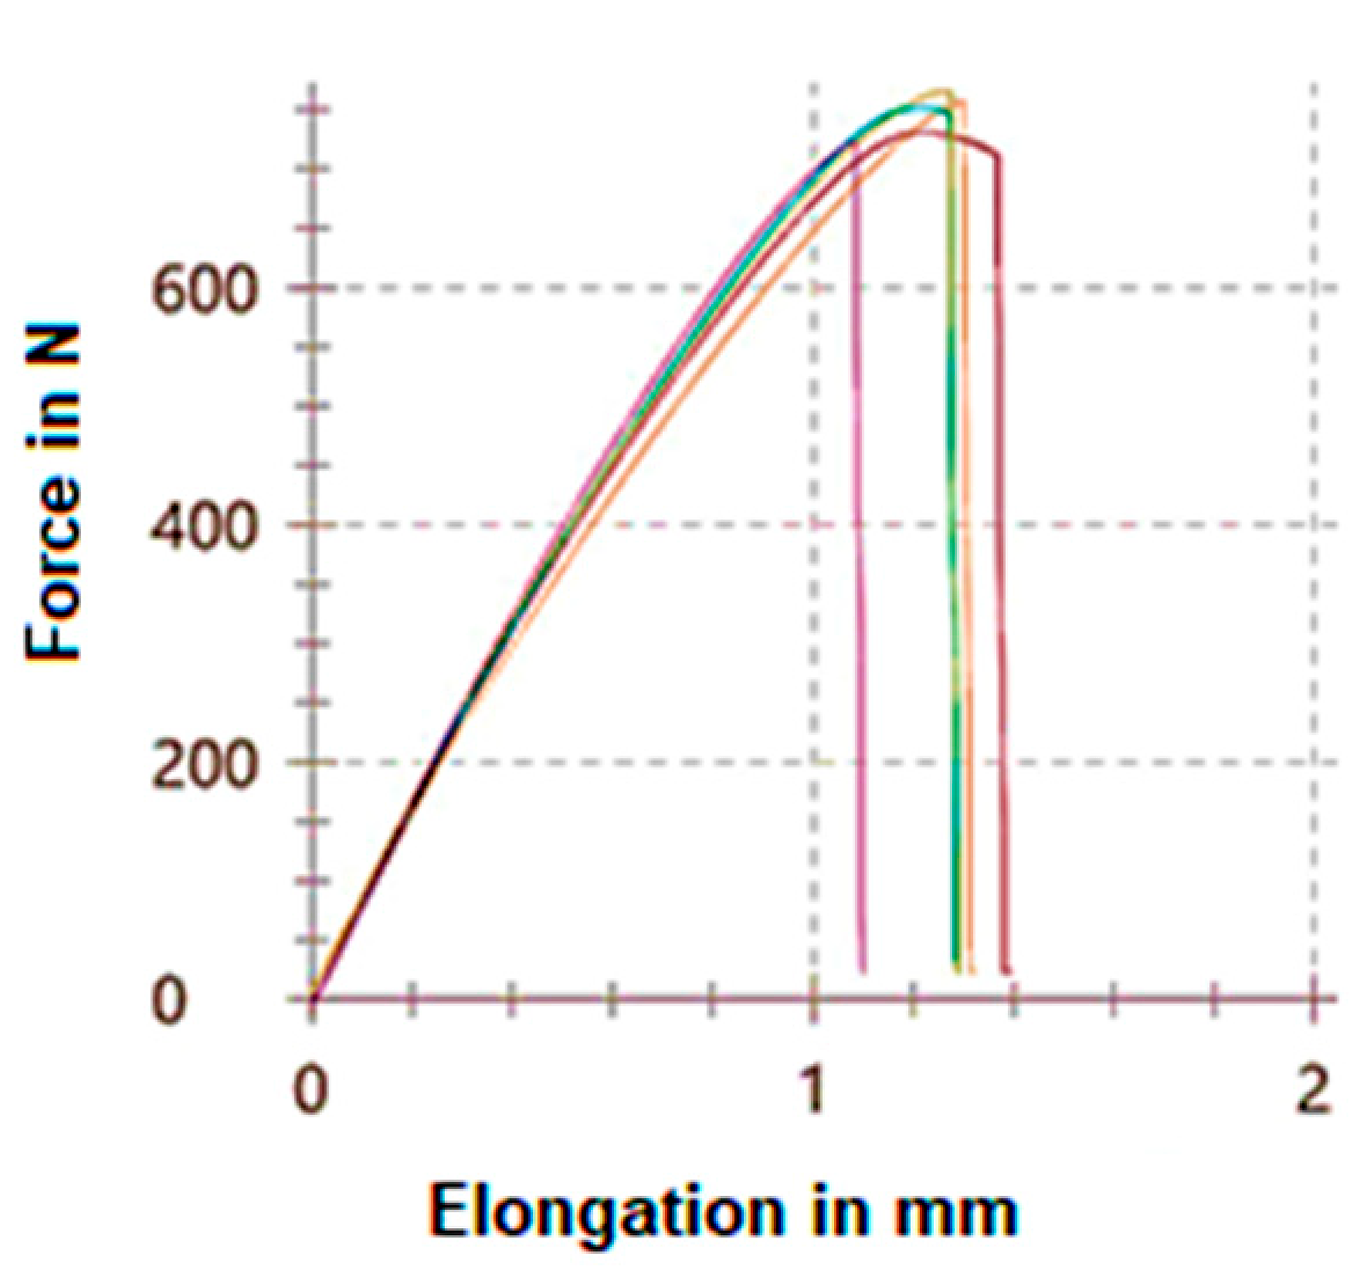
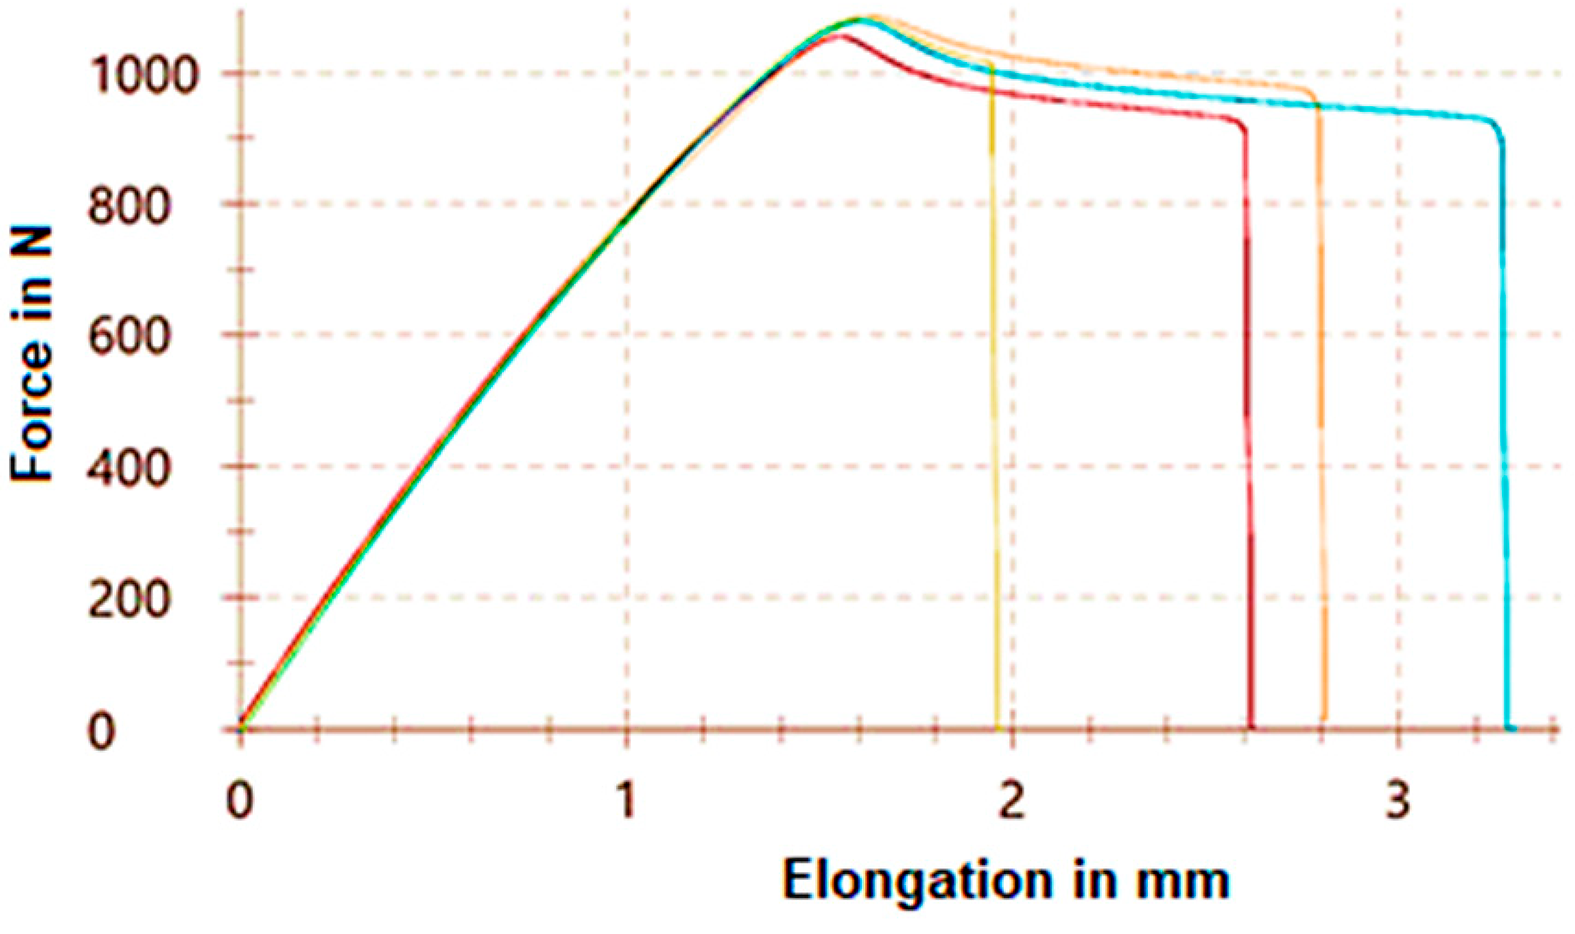
The tensile curves determined in the case of the vertically orientated test specimens are shown in Figure 5 and the horizontally orientated test specimens in Figure 6.
It can be concluded the tensile test results depended on the test specimens’ printing orientation. In the case of the horizontal orientation, the average tensile strength was 51.25 MPa, and in the case of the vertical printing orientation, it was 35.6 MPa. These tests were conducted to determine the printed specimens’ tensile strength as a function of the printing orientation.
2.4 Microscopy
The printing efficiency was tested using an Olympus DSX 1000 (Olympus Corporation, Tokyo, Japan) microscope. The cross-sections of the vertically and horizontally orientated and heat-treated test specimens were tested. The samples were prepared for microscope observation via metallographic preparation, grounding, and polishing. The cross-sections of the horizontally and vertically orientated test specimens are shown in Figure 7. The crossing direction was perpendicular to the printing direction of the test specimens.
2.5 Shore D Test
The hardness of the specimens was determined using a Shore D tester. The test was conducted at room temperature according to ISO 868. The technical datasheet of the filament gives 83 (D Shore) as a characteristic value of the 3D-printed state, as determined using a durometer (Innovatest SHD0002, Innovatest Europe BV, Maastricht, The Netherlands). There was no reference value for the direction of printing.
3 Results and Discussions
The goal of the experiments was to determine the heat-treated specimens’ tensile strength and structure as a function of the heat treatment in the case of both printing orientations. The heat treatment was carried out as described above at 55°C, 65°C, 80°C, and 95°C. The latter temperature, 95°C, led to deformation (see Figure 3) of the specimens; these were not examined further.
3.1 Heat-Treated Specimens’ Tensile Test Results
The other specimens’ tensile test results are summarized in Table 2. The labels in the table below are explained as follows: The first digit shows the printing orientation, where V is vertical and H is horizontal; the second digit, h, indicates these specimens were heat-treated; and the third digit is the temperature of the heat treatment in °C.
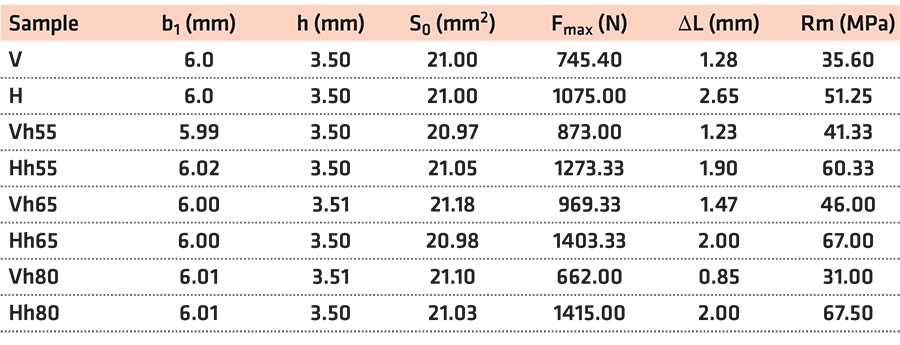
Table 2 summarizes the tensile test results of the printed and heat-treated specimens. Based on the UTS results in the case of the PLA and printing process parameters used, the heat treatment at 65°C led to the best performance for the vertically printed specimens and the heat treatment at 80°C led to the best results for the horizontally printed specimens. Between the 65°C and 80°C heat treatments, in the case of the horizontally printed specimens, there was a 0.5 MPa difference in UTS.
Numerous research reports suggest the reason PLA’s mechanical properties are enhanced as a function of heat treatment is the improvement in the crystallinity of PLA. This refers to heat treatments conducted between 90°C and 100°C [29,30].
3.2 Tensile Test Resulted in Ruptured Surfaces
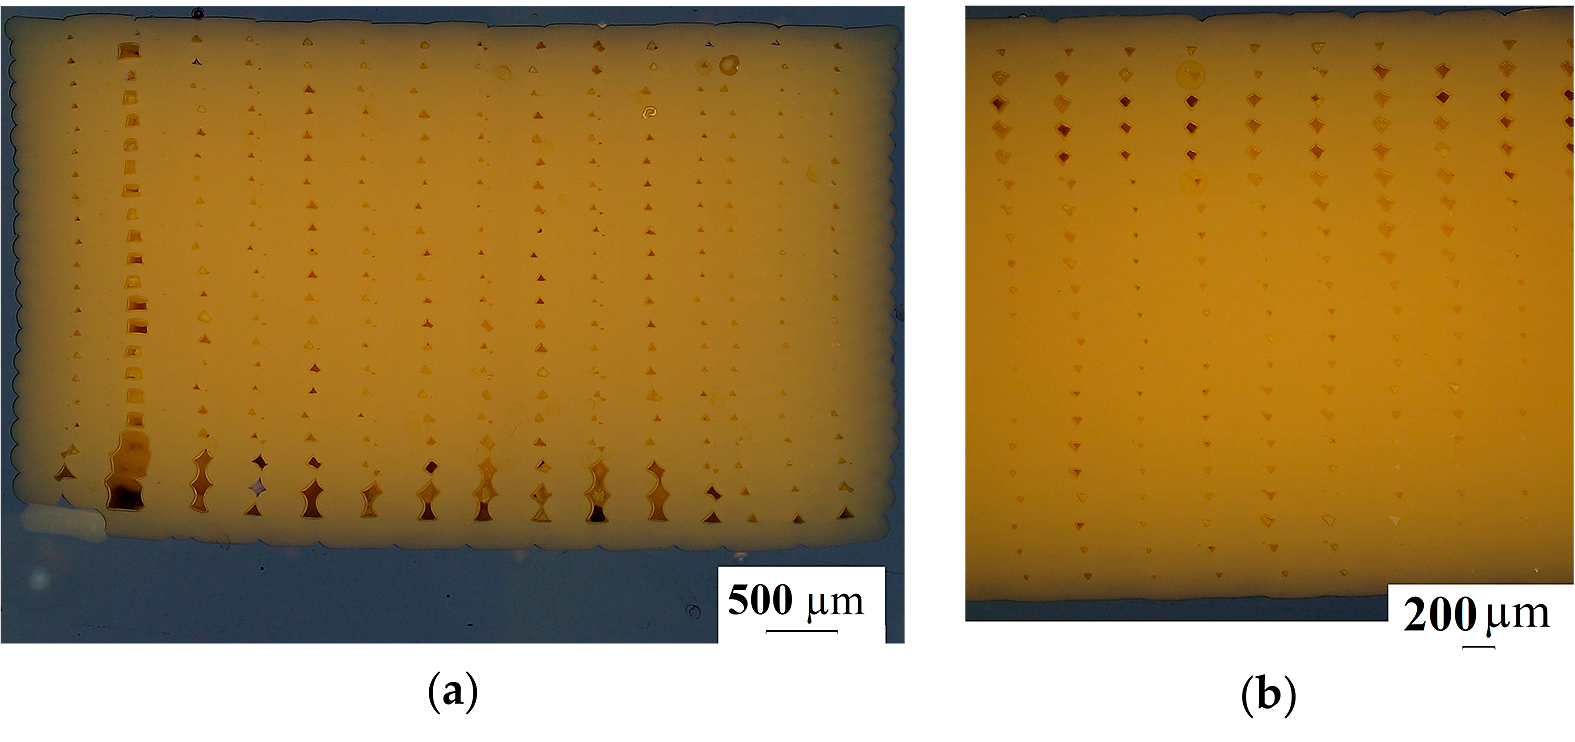
After the tensile test, the specimens’ surfaces were examined via visual inspection and microscopy. The microscopy test showed differences as a function of the printing direction and the heat treatment in the extent of damage to specimens’ surface. Only the printed specimens and those heat-treated at 65°C were tested because, according to the tensile test results, the vertically printed specimens showed the highest UTS. Figure 8 shows the vertically printed specimens’ ruptured surface.
The ruptured surfaces of the horizontally printed specimens are shown in Figure 9, where Figure 9a shows the non-heat-treated specimen and Figure 9b shows the heat-treated specimen.
The ruptured surfaces show the heat treatment effects. The surfaces had some brittle fractures (Figure 9c).
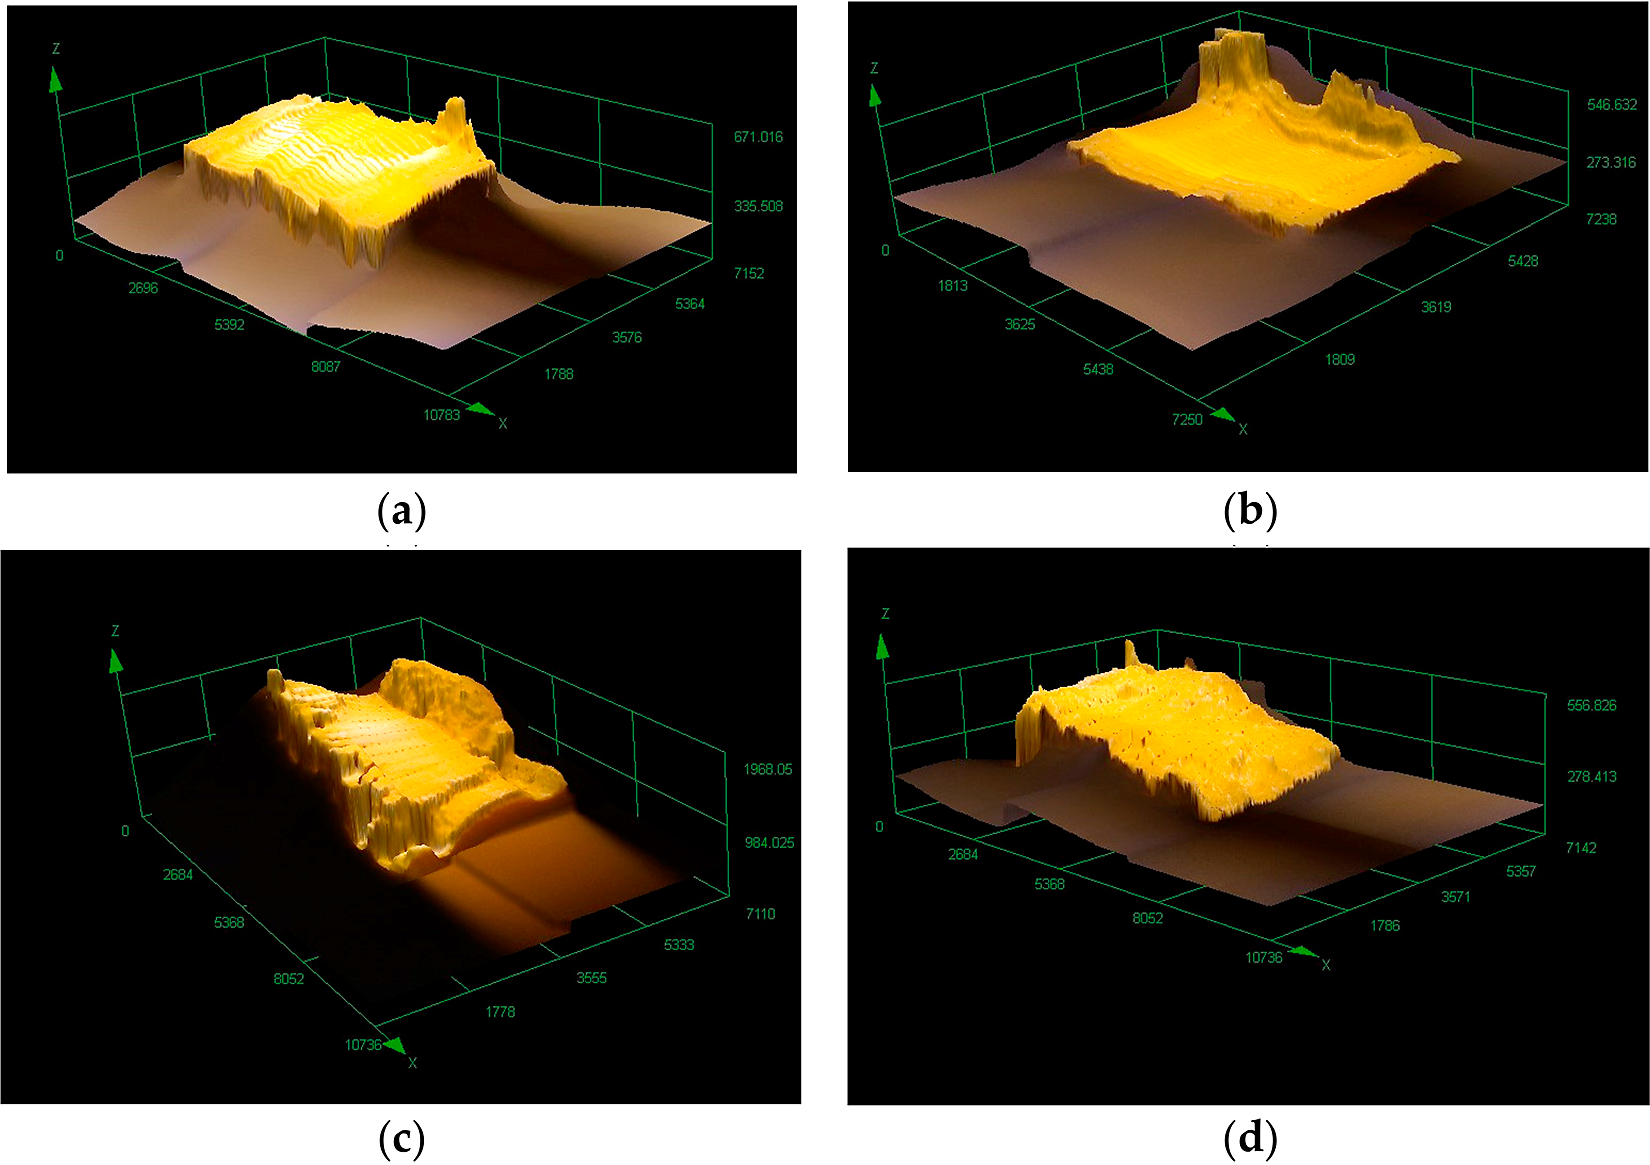
The 3D pictures of the ruptured surfaces better show the difference between the heat-treated and non-heat-treated specimens (Figure 10). The heat treatment temperature was 65°C.
3.3 Microscopy of the Specimen Cross-Section
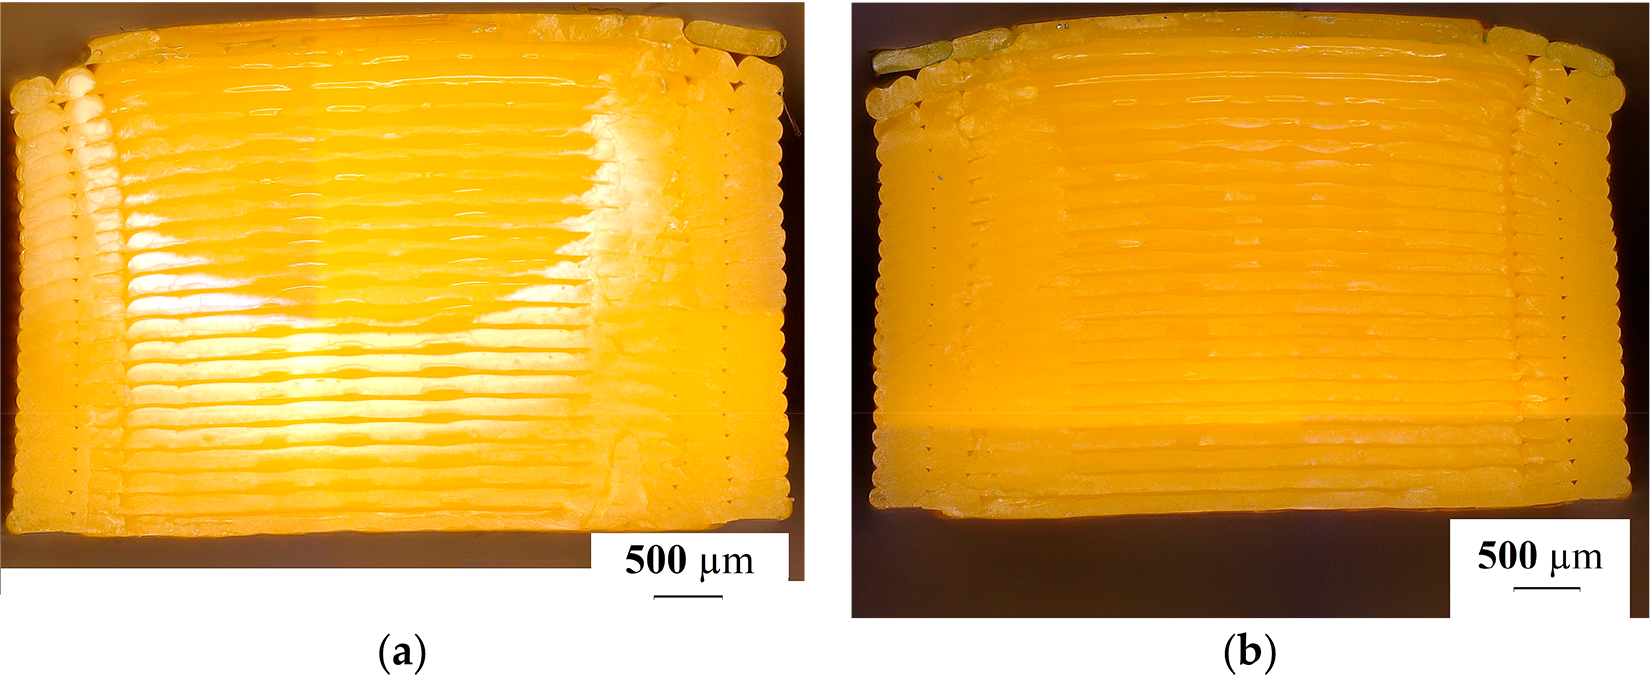
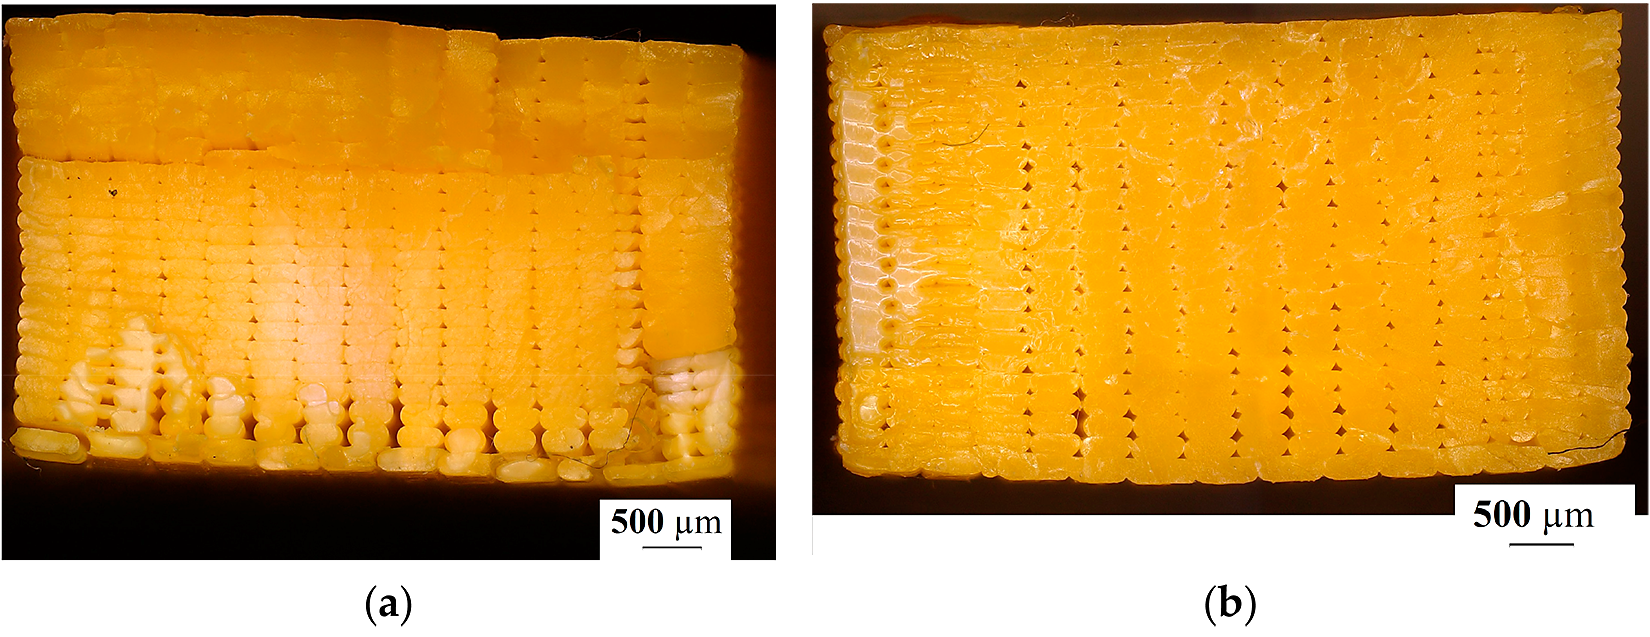
The microscopy results of the printed and the heat-treated test specimens’ cross-section are shown in Figure 11. Samples from both horizontally printed and vertically printed specimens were cut in two directions for microscopic examination. The printed and heat-treated specimens’ cross-sections were tested.
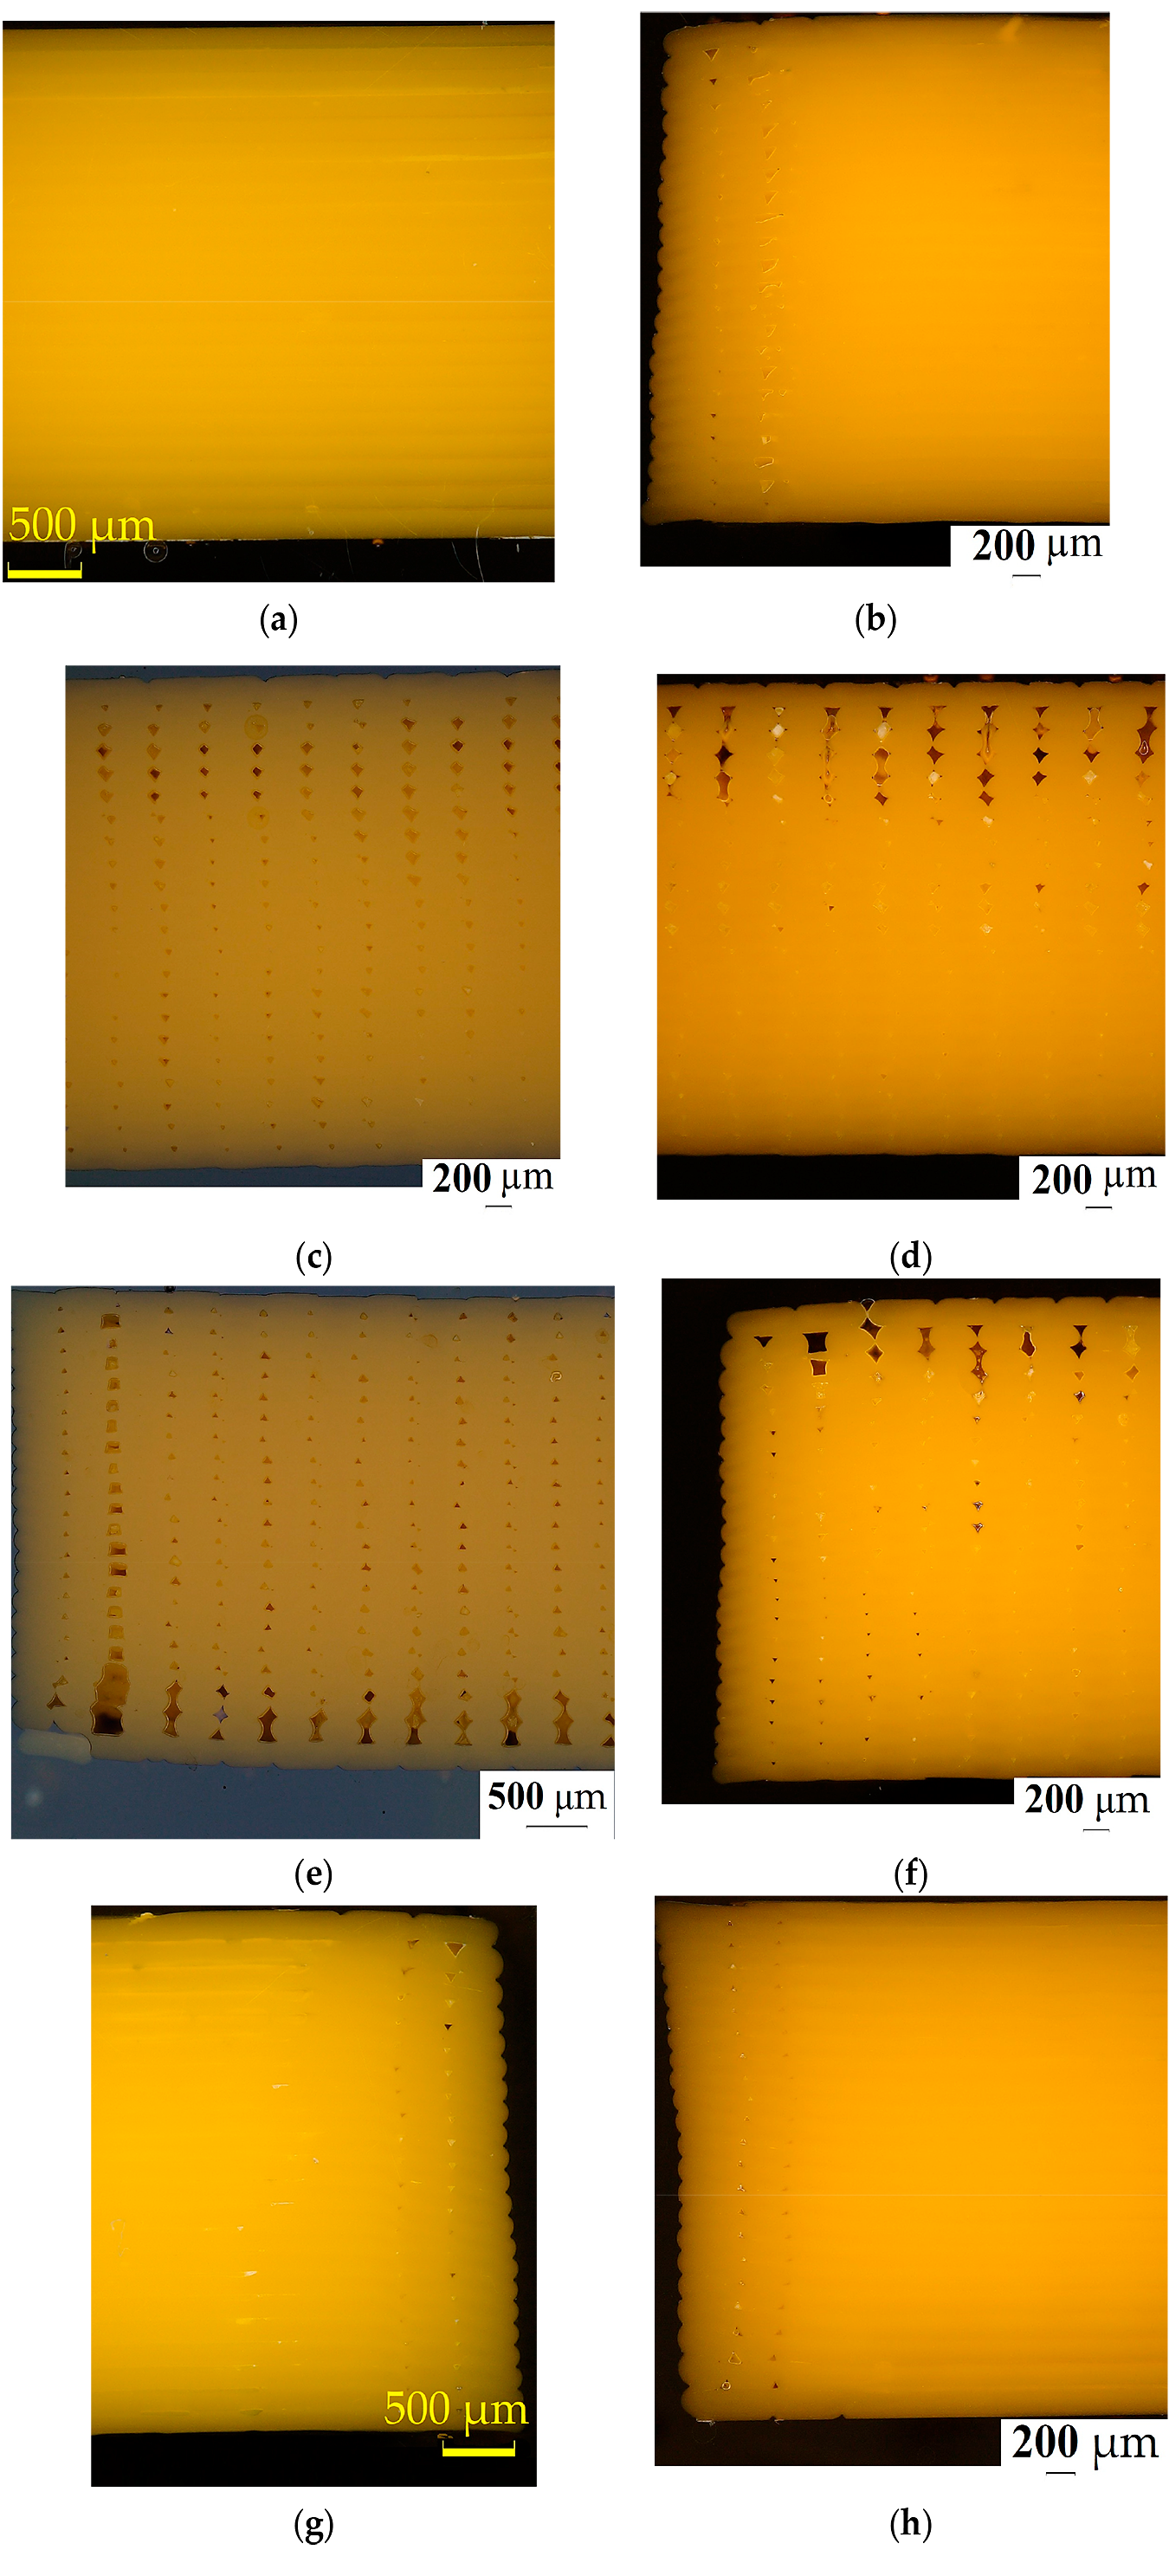
Figure 11 shows the structure of the printed and heat-treated specimens as a function of the printing orientation and the cross-section cut direction. It can be seen that the heat treatment decreased the porosity of the samples. In the case of the printed samples’ cross-sections, we can see the porosity was different between the top side and the back side of the specimens. During the printing process, the temperature was different in each layer. To achieve suitable mechanical properties and the lowest porosity possible in a printed structure, polymerization needs to be maintained, which requires suitable temperature and environmental properties.
3.4 Shore D Hardness Tests
The Shore D test results are collected in Table 3. The test was carried out on the parallel and perpendicular cross-sections of the seven horizontally and vertically printed specimens heat-treated at 65°C.

The average hardness in the case of all specimens was in harmony with the datasheet data and with the literature [31]. The heat treatment at 65°C led to a decrease in hardness compared to the hardness value after printing. The applied heat treatment resulted in softening of the PLA.
4 Conclusions
Mechanical properties’ dependence on the printing direction is well understood. In the introduced experimental study, the results confirm this fact. The tensile test results are in harmony with the literature data; the printed tensile specimens showed a variable UTS as a function of the printing orientation [31]. This work is devoted to developing a heat-treatment process able to enhance the mechanical properties of 3D-printed PLA products. The heat-treatment process modified the UTS in the case of both vertical and horizontal printing directions. The heat treatment at 65°C led to the greatest increase in the UTS of the vertically printed specimens. In the case of the horizontally printed specimens, all heat treatments increased the UTS (Table 2).
Based on the visual and microscopy tests of surface rupture after the tensile test, we can see fractures in the surface (Figure 9 and Figure 10).
The microscopy tests of the printed specimens heat-treated at 65°C showed relevant differences in the structure of the specimens. Figure 11 shows the printed and heat-treated specimens, where it can be seen that, after the heat treatment, the porosity decreased in all test specimen structures. The size of the test specimens was controlled by using a caliper, so there was not a measurable difference before and after the heat treatment in the case of the treatments at 55°C, 65°C, and 80°C. We can conclude that the heat treatment at 95°C caused deformation (Figure 3). The increase in the UTS could be explained by the improvement in the crystallinity as the literature suggests, but on the basis of the experimental results, this cannot be fully concluded because the crystalline fraction was not determined in this study. The effectiveness of the heat treatment, which is in harmony with the literature, is likely to be due to the reduction in stress as a result of the heat treatment [25,32]. All test specimens contained 22 layers, each of which stayed at a different temperature during the printing process for different durations of time.
It can be declared that heat treatment is a suitable method for increasing the mechanical properties of PLA after the 3D printing process. The printing orientation of PLA is the most relevant factor influencing the UTS, but this can be increased by a suitable heat treatment.
Author Contributions
Conceptualization, M.S. and M.J.; methodology, T.A.K.; validation, Z.N.; formal analysis, M.S. and M.J.; investigation, M.J.; data curation, M.S.; writing — original draft preparation, T.A.K.; editing and visualization, Z.N.; supervision, L.T.; project administration, L.T. All authors have read and agreed to the published version of the manuscript.
Institutional Review Board Statement
Not applicable.
Informed Consent Statement
Not applicable.
Data Availability Statement
The data used for the research are available upon request.
Acknowledgments
The authors would like to express their gratitude to Robert Bosch Electronic Ltd., Hatvan, Hungary, for the technical support.
Conflicts of Interest
The authors declare no conflict of interest.
References
- Chang, J.-H.; Chen, M.J.; Farris, R.J. Effect of Heat Treatment on the Thermal and Mechanical Properties of a Precursor Polymer: Polyhydroxyamide. Polymer 1998, 39, 5649-5654.
- Coppola, B.; Cappetti, N.; Di Maio, L.; Scarfato, P.; Incarnato, L. 3D Printing of PLA/Clay Nanocomposites: Influence of Printing Temperature on Printed Samples Properties. Materials 2018, 11, 1947.
- Gao, Q.; Lan, P.; Shao, H.; Hu, X. Direct Synthesis with Melt Polycondensation and Microstructure Analysis of Poly(L-Lactic Acid-Co-Glycolic Acid). Polym. J. 2002, 34, 786-793.
- Büşra, K.; Smith, J.P.; Patrick, J.; Fairclough, A.; Kamran, M. Additive Manufacturing of High-Density Carbon Fibre Reinforced Polymer Composites. Addit. Manuf. 2022, 58, 103044.
- Mohamed, O.A.; Masood, S.H.; Bhowmik, J.L. Optimization of Fused Deposition Modelling Process Parameters: A Review of Current Research and Future Prospects. Adv. Manuf. 2015, 3, 42–53.
- Mehta, R.; Kumar, V.; Bhunia, H.; Upadhyay, S.N. Synthesis of Poly(Lactic Acid): A Review. J. Macromol. Sci. Part B Polym. Rev. 2005, 45, 325-349.
- Chacón, J.M.; Caminero, M.A.; García-Plaza, E.; Núñez, P.J. Additive Manufacturing of PLA Structures Using Fused Deposition Modelling: Effect of Process Parameters on Mechanical Properties and their Optimal Selection. Mater. Des. 2017, 124, 143-157.
- Tymrak, B.M.; Kreiger, M.; Pearce, J.M. Mechanical Properties of Components Fabricated with Open-Source 3-D Printers under Realistic Environmental Conditions. Mater. Des. 2014, 58, 242-246.
- Casavola, C.; Cazzato, A.; Moramarco, V.; Pappalettere, C. Orthotropic Mechanical Properties of Fused Deposition Modelling Parts Described by Classical Laminate Theory. Mater. Des. 2016, 90, 453-458.
- Wu, W.; Geng, P.; Li, G.; Zhao, D.; Zhang, H.; Zhao, J. Influence of Layer Thickness and Raster Angle on the Mechanical Properties of 3D-Printed PEEK and A Comparative Mechanical Study between PEEK and ABS. Materials 2015, 8, 5834-5846.
- Domingo-Espin, M.; Puigoriol-Forcada, J.M.; Garcia-Granada, A.-A.; Llumà, J.; Borros, S.; Reyes, G. Mechanical Property Characterization and Simulation of Fused Deposition Modelling Polycarbonate Parts. Mater. Des. 2015, 83, 670-677.
- Mishra, S.B.; Abhishek, K.; Satapathy, M.P.; Mahapatra, S.S. Parametric Appraisal of Compressive Strength of FDM Build Parts. Mater. Today Proc. 2017, 4, 9456-9460.
- Ayatollahi, M.R.; Nabavi-Kivi, A.; Bahrami, B.; Yazid Yahya, M.; Reza Khosravani, M. The Influence of In-Plane Raster Angle on Tensile and Fracture Strengths of 3D-Printed PLA Specimens. Eng. Fract. Mech. 2020, 237, 107225.
- Ferracane, J.L.; Condon, J.R. Post-Cure Heat Treatments for Composites: Properties and Fractography. Dent. Mater. 1992, 8, 290-295.
- He, P.; Jia, D.; Lin, T.; Wang, M.; Zhou, Y. Effects of High-Temperature Heat Treatment on the Mechanical Properties of Unidirectional Carbon Fiber Reinforced Geopolymer Composites. Ceram. Int. 2010, 36, 1447-1453.
- Kim, H.S.; Jang, J.U.; Lee, H.; Kim, S.Y.; Kim, S.H.; Kim, J.; Yang, B.J. Thermal Management in Polymer Composites: A Review of Physical and Structural Parameters. Adv. Eng. Mater. 2018, 20, 180020.
- Kim, K.W.; Han, W.; Kim, B.S.; Kim, B.J.; An, K.H. A Study on EMI Shielding Enhancement Behaviours of Ni-Plated Cfs-Reinforced Polymer Matrix Composites by Post-Heat Treatment. Appl. Surf. Sci. 2017, 415, 55-60.
- Liang, J.Z. Effects of Heat Treatment on the Electrical Conductivity of HDPE/CB Composites. Polym. Test. 2017, 62, 219-224.
- Liao, Y.; Liu, C.; Coppola, B.; Barra, G.; Di Maio, L.; Incarnato, L.; Lafdi, K. Effect of Porosity and Crystallinity on 3D Printed PLA Properties. Polymers 2019, 11, 1487.
- Rahaman, M.S.; Ismail, A.F.; Mustafa, A. A Review of Heat Treatment on Polyacrylonitrile Fiber. Polym. Degrad. Stab. 2007, 92, 1421-1432.
- Sanatgar, R.H.; Campagne, C.; Nierstrasz, V. Investigation of the Adhesion Properties of Direct 3D Printing of Polymers and Nanocomposites on Textiles: Effect of FDM Printing Process Parameters. Appl. Surf. Sci. 2017, 403, 551-563.
- Serra, T.; Planell, J.A.; Navarro, M. High-Resolution PLA-Based Composite Scaffolds Via 3-D Printing Technology. Acta Biomater. 2013, 9, 5521-5530.
- Song, Y.; Li, Y.; Song, W.; Yee, K.; Lee, K.W.; Tagarielli, V.L. Measurements of the Mechanical Response of Unidirectional 3D-Printed PLA. Mater. Des. 2017, 123, 154-164.
- Wang, X.; Wang, Q.; Gao, L.; Jia, Y. Effect of Heat Treatment on Curing Uniformity of Fiber Composite Laminates. Polym. Polym. Compos. 2017, 25, 29-34.
- Jayanth, N.; Jaswanthraj, K.; Sandeep, S.; Mallaya, N.H.; Siddharth, S.R. Effect of Heat Treatment on Mechanical Properties of 3D Printed PLA. J. Mech. Behav. Biomed. Mater. 2021, 123, 104764.
- Szabó, L.; Deák, G.; Nyul, D.; Kéki, S. Flexible Investment Casting Wax Patterns for 3D-Printing: Their Rheological and Mechanical Characterizations. Polymers 2022, 14, 4744.
- Zhao, Y.; Chen, Y.; Zhou, Y. Novel Mechanical Models of Tensile Strength and Elastic Property of FDM AM PLA Materials: Experimental And Theoretical Analyses. Mater. Des. 2019, 181, 108089.
- Shahrubudin, N.; Lee, T.C.; Ramlan, R. An Overview on 3D Printing Technology: Technological, Materials, and Applications. Procedia Manuf. 2019, 35, 1286-1296.
- Simmons, H.; Tiwary, P.; Colwell, J.E.; Kontopoulou, M. Improvements in the Crystallinity and Mechanical Properties of PLA by Nucleation and Annealing. Polym. Degrad. Stabil. 2019, 166, 248-257.
- Saeidlou, S.; Huneault, M.A.; Li, H.; Park, C.B. Poly(Lactic Acid) Crystallization. Prog. Polym. Sci. 2012, 37, 1657-1677.
- Zeng, Y.-S.; Hsueh, M.-H.; Lai, C.-J.; Hsiao, T.-C.; Pan, C.-Y.; Huang, W.-C.; Chang, C.-H.; Wang, S.-H. An Investigation on the Hardness of Polylactic Acid Parts Fabricated via Fused Deposition Modeling. Polymers 2022, 14, 2789.
- Ji, L.B.; Zhou, T.R. Finite Element Simulation of Temperature Field in Fused Deposition Modeling. Adv. Mater. Res. 2010, 9–101, 2585-2588.
© 2023 by the authors. Licensee MDPI, Basel, Switzerland. This article is an open access article (https://www.mdpi.com/2073-4360/15/6/1587) distributed under the terms and conditions of the Creative Commons Attribution (CC BY) license (https://creativecommons.org/licenses/by/4.0/). It has been edited to conform to the style of Thermal Processing magazine.


 general practice for CQI-9 and AMS2750E")


