


In this column, we will start to discuss the application of Quench Factor Analysis (QFA) to predicting properties of quenched and aged aluminum.
Quench Factor Definition
Quantifying quenching, and the cooling effect of quenchants, has been extensively studied [1] [2] [3] [4]. The first systematic attempt to correlate properties to the quench rate was performed by Fink and Wiley [5] for thin (0.064”) sheet. A TimeTemperatureTensile Property curve was created and was probably the first instance of a TTP diagram for aluminum. It was determined that the critical temperature range for 75S is 400°C to 290°C. This critical temperature range was later confirmed [6]. At quench rates exceeding 450°C/sec., the maximum strength and corrosion resistance were obtained. At intermediate quench rates of 450°C to 100°C/sec., the strength was lowered (using the same age treatment), but the corrosion resistance was unaffected. Between 100°C/sec and 20°C/sec, the strength decreased rapidly, and the corrosion resistance was at a minimum. At quench rates below 20°C/sec, the strength decreased rapidly, but the corrosion resistance improved.
 One method that quantifies the quench path and material kinetic properties is called the “Quench Factor” and was originally described by Evancho and Staley [7]. This method is based on the integration of the area between the Time-Temperature-Property Curve and the quench path.
Historically, the average quench rate has been used to predict properties and microstructure after quenching [1] [2] [3]. However, average quench rates are not sufficient to provide accurate property data and serve as a predictive tool [7]. Quench Factor Analysis was developed to quantitatively predict properties. This quench factor depends on the rate of precipitation during quenching. The rate of precipitation during quenching is based on two competing factors: supersaturation and diffusion. As temperature is decreased during quenching, the amount of supersaturation increases, providing increased driving force for precipitation. In addition, at the beginning of quenching, the temperature is high, increasing the rate of diffusion. The Avrami precipitation kinetics for continuous cooling can be described by [7]:
 Where ζ is the fraction transformed, k is a constant, and τ is defined as the quench factor, or:
 t is the time, and Ct is the critical time. The collection of Ct points, also known as the C-Curve or Time -Temperature-Property curve, is like the TTT curve for continuous cooling.
In general, the Ct function is described by [8]:
 (3)
(3)
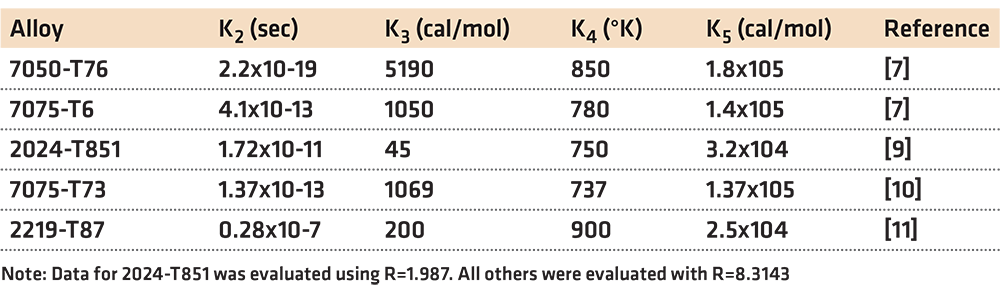
where Ct is the critical time required to precipitate a constant amount of solute, K1 is a constant that equals the natural logarithm of the fraction that was not transformed during quenching, and K1 = ln(0.995). K1 is chosen that for τ > 1, a decrease in properties is observed. K2 is a constant related to the reciprocal of the number of nucleation sites, and K3 is a constant related to the energy required to form a nucleus. K4 is a constant related to the solvus temperature, K5 is a constant related to the activation energy for diffusion, R is the universal gas constant, and T is the temperature in °K.
To determine the parameters K1, K2, K3, K4, and K5, it is first necessary to have the C-Curve. C-Curve data is scarce, and of limited availability. Table 1 shows some previously published data.
To obtain the overall quench factor, Q, the incremental quench factor values are summed progressively as the probe or part is cooled through the precipitation range, normally about 800-300°F (425 – 150°C) [8]. Mathematically, this is shown by:
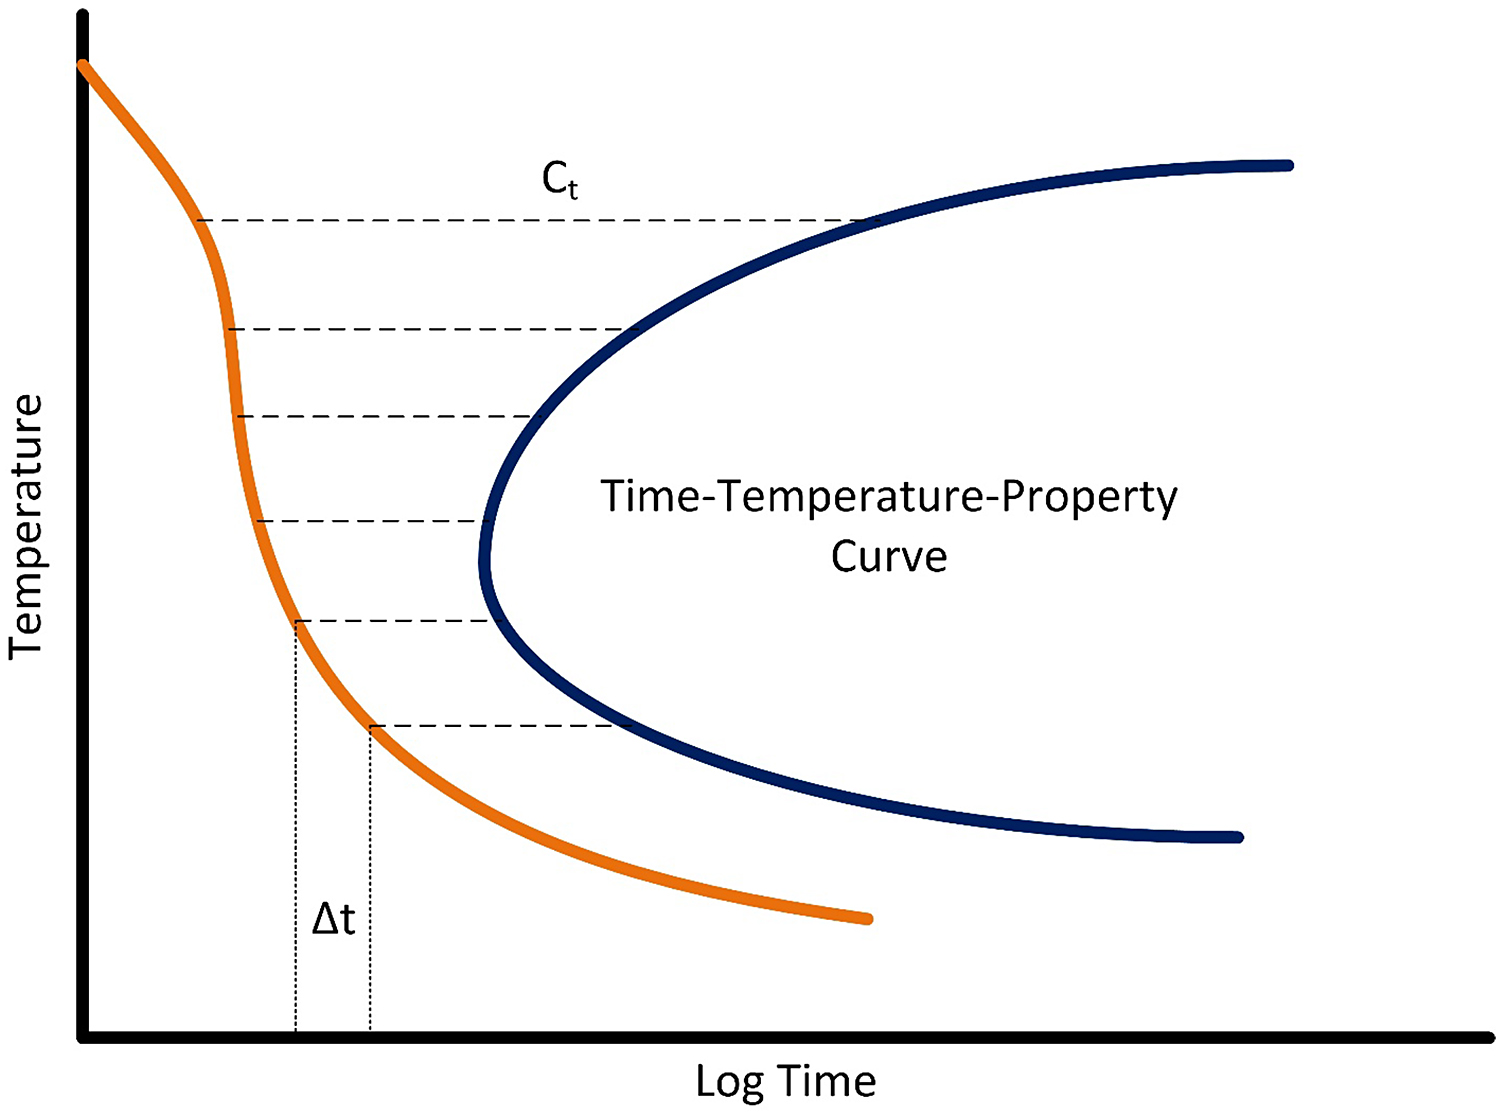
 where C1…Cn are the critical times of the C-Curve, and ∆t1… ∆tn are the incremental times described by the quench path. But, to do this integration, the C-curve must be known. This is shown schematically in Figure 1.
Typically, it is necessary to measure the quench path of several sheets of material, and then measure the properties after processing. The quench factor is determined for each quench path and associated with the measured properties. Typically, hardness and tensile properties have been used [12]. Properties are then related to the quench factor by the equation:
 where p is the property of interest, pmax is the maximum property attainable with infinite quench rate, and K1 is -0.005013 (natural log of 0.995).
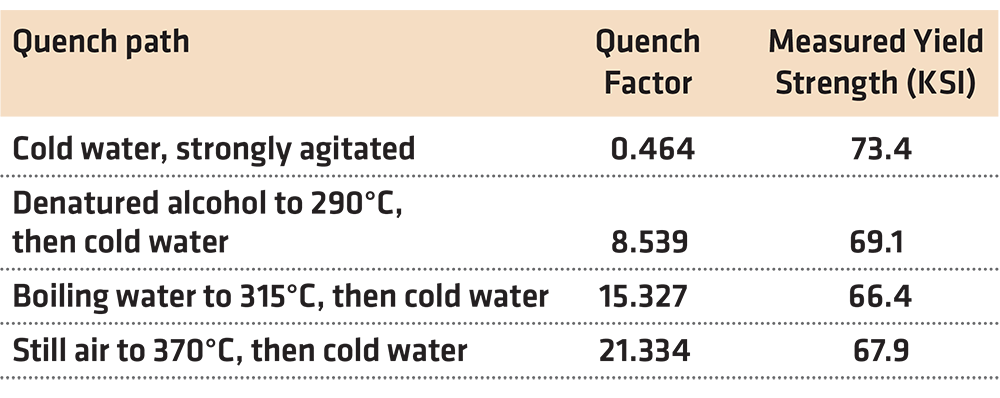
There are two difficulties with this method. First, it is necessary to know the specific quench path that the part experienced. This is often difficult to measure and requires specialized equipment to achieve repeatable results [12]. Secondly, it is also necessary that the C-Curve is known with sufficient precision. As indicated previously, this data is often not available for the specific conditions of interest. The lack of having detailed information regarding the C-Curve has limited the applicability of the use of the quench factor. Examples of measured Quench Factors are shown in Table 2.
Conclusion
In this column, we have defined the Quench Factor, and indicated needed data to properly calculate the Quench Factor. In the next column, methods of determining the Ct curve of an aluminum alloy will be shown, as well as the Quench Factor will be shown.
Should you have any questions regarding this, or any other column, please contact the writer or editor.
References
- M. A. Grossman, Metals Progress, vol. 4, p. 373, 1938.
- H. Scott, “Quenching Mediums,” in Metals Handbook, Cleveland, ASM, 1948, p. 615.
- F. Wever, Archiv fur Eisenhuttenwesen, vol. 5, p. 367, 1936.
- L. Dakins, Union Carbide.
- W. L. Fink and L. A. Wiley, “Quenching of 75S Aluminum Alloy,” Trans. AIME, vol. 175, p. 414, 1948.
- H. Suzuki, M. Kanno and H. Saitoh, “The influence of hot working on quench sensitivity of Al-Zn-Mg-Cu alloy containing transition Elements,” Keikinzoku, vol. 33, no. 7, pp. 399-406, 1983.
- J. W. Evancho and J. T. Staley, “Kinetics of Precipitation in Aluminum Alloys During Continuous Cooling,” Met. Trans., vol. 5, pp. 43-47, January 1974.
- C. E. Bates and G. E. Totten, Heat Treatment of Metals, vol. 4, p. 89, 1988.
- L. K. Ives, L. Swartzendruber, W. J. Boettinger, M. Rosen, S. D. Ridder, F. S. Biancaniello, R. C. Reno, D. B. Ballard and R. Mehrabian, “Processing/Microstructure/Property Relationships in 2024 Aluminum Alloy Plates,” 1983.
- C. E. Bates, “Quench Factor-Strength Relationships in 7075-T73 Aluminum,” in Proc. Int. Conf. on Long-Term Storage Stabilities of Liquid Fuels, San Antonio, TX, 28 July – 01 August 1986.
- L. Swartzenruber, W. Boettinger and I. Ives, “Nondestructive Evaluation of Nonuniformities in 2219 Aluminum Alloy Plate – Relationship to Processing,” National Bureau of Standards, 1980.
- C. E. Bates, “Recommended Practice for Cooling Rate Measurement and Quench Factor Calculation,” Warrendale, PA, 1987.
- J. E. Hatch, Aluminum: Properties and Physical Metallurgy, Metals Park, OH: American Society for Metals, 1984.


 general practice for CQI-9 and AMS2750E")


