


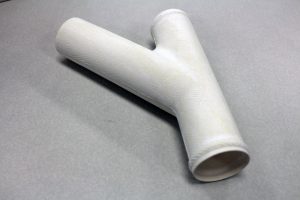
Temperature uniformity is the temperature variation (usually expressed as ± degrees) within the qualified furnace work zone (Figure 1) with respect to a set point temperature. A TUS (temperature uniformity survey) is a test or series of tests where calibrated field test instrumentation and sensors are used to measure temperature variation within the qualified furnace work zone before and after thermal stabilization. Prior to the first use of a furnace, an initial TUS should be performed. After this, periodic tests should be run based on the furnace class and type. Furnaces may have multiple operating ranges, meaning they may need to have TUS’s performed more frequently.
AMS2750E now allows a second thermocouple within 0.38” of the control thermocouple to be logged onto the chart recorder; this is an alternative to digitally transmitting the actual control sensor. The digital transmission method is still the most accurate, and helps with conformance to the SAT (system accuracy test).
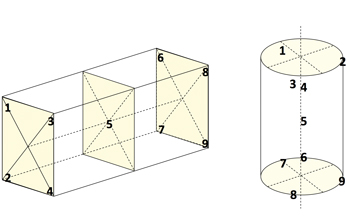
For work zones with volumes less than 3 ft³:
- Box: Four TUS sensors should be located at the four corners and one in the center (Figure 2)
- Cylinder: TUS sensors should be located 90 degrees apart, one in the center.
For work zones with volumes greater than 3 ft³:
- Box: Eight TUS sensors should be located at the corners and one in the center.
- Cylinder: Three TUS sensors should be located on the periphery of each end, 120 degrees apart—one in the center and two in the qualified work zone.
Performing a TUS is relatively straightforward. Typically, you will start a survey prior to the first sensor reaching the lower tolerance level. Doing so will show that the furnace is coming up to temperature, not exceeding the high threshold and, most importantly, stabilizing for at least 30 minutes. It’s important to note when collecting data that the data acquisition device is recording at least once every two minutes.
Once the furnace has stabilized, no sensor can go above or below the threshold limit for that furnace class.
One thing to keep in mind is that stability is identified in different ways. According to AMS2750E specification.
For unloaded furnaces: If temperature readings of any TUS sensor exhibit an upward or downward trend (continuously higher highs or lower lows), the test period should be extended as necessary until the trend is no longer evident.
For loaded furnaces: If a survey load is used during the TUS, some survey thermocouples may continue to rise in temperature and slowly approach the set temperature. This rise in temperature of survey TC toward the SP temperature meets the requirement for stabilization. In other words, a loaded furnace may exhibit a continual increase/decrease in temperature during its 30-minute cycle.
Remember, you need a separate recording device capable of meeting AMS2750E Field Test Instrument standards of +/- 1ºF or .6 ºC.
The report needs to style the following:
- Furnace ID name and number
- Survey date and time start
- Survey date and time stop
- Name of technician performing survey
- Survey result
- Testing company detail
- Testing company signature
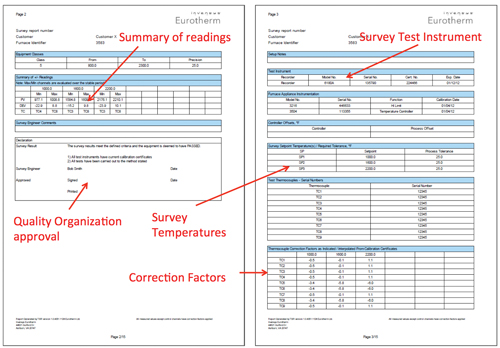
The report needs to show the following data:
- Summary of readings
- Quality organization approval
- Survey temperatures
- Correction factors
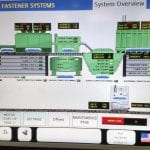
- List survey test instrumentation (Figure 3)
The report needs to identify the following:
- Sensor & location identification
- Time and temperature profile
Once you gather the required data and are ready to look at the results, it’s time to examine what exactly you are looking for, and what it’s going to tell you. The TUS results can tell us a lot. Here are a few questions to ask:
- Did any test, control, or recording sensors exceed upper temperature uniformity tolerance?
- Were all temperatures held until stabilized?
- Did data collection continue for a minimum of 30 minutes?
- Did all surveyed thermocouples remain within the desired temperature range and not drift above or below max/min temperature?
If any of these conditions were not met, it is imperative to look at the data to see why they weren’t met, then correct the problem and run the survey again.
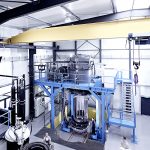
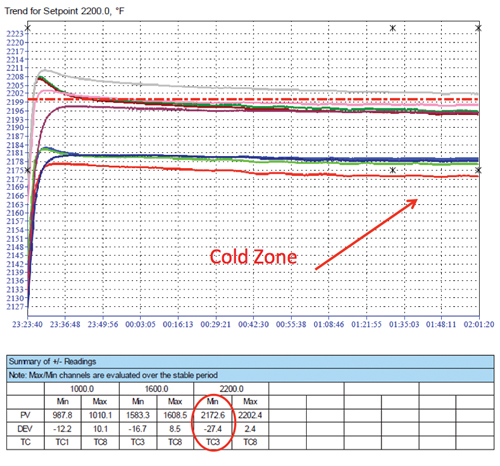
The report tables and the profile give a good overview of the heating rate in each part of the work zone, including the time to stabilize, ultimate hot and cold spots, and variation from the setpoint (Figure 4). One way to compare electronic records is to utilize the conditional formatting within Excel. This will show the pattern of heating and stabilization, and it’s easy to compare with prior reports to see if any major changes are occurring or if there is a pattern of degradation. This method requires a working knowledge of Excel and the ability to export a csv file from your data recorder.
An alternative method is to use reporting software. One example is Dream Reports from Invensys Eurotherm. The tamperproof files can be read directly into the reporting software, and individual reports can be customized to show conditional formatting or compared with a set “golden batch” (ideal TUS trace).
Once the report is setup, it may run for different surveys and the information can be compared.
The purpose of this test on the Invensys Eurotherm Nanodac is to estimate the maximum error when reading the thermocouple types listed in the AMS2750D standard, type T,R,B,E,J,K,N, and S. This is then tested with the worst case calculated drift for the K-type thermocouple. The temperature profile of the environmental chamber is then cycled as below with a programmer. The time for each section is 12 hours and cycles from 25°C to 35°C then to 15°C. The overall worst case drift at was at 15°C and was equal to 1200.6°C (highest reading) – 0.14°C (mv source drift) = 1200.46°C. The worst case from the table below is (0.035*1200°C)/100)+0.29°C=0.71°C. The nanodac reads less than the worst case estimated error.
The nanodac thermocouple inputs meet the requirement of the AMS2750D requirements of not drifting by more than 1.1°C over a period of three months, with the condition that the retest temperature is within the specified range of 25°C ±10°C. This has been supported by worst-case experimental results that have drifted less than the worst case calculation.
To enable more accurate TUS results, use cutback to minimise overshoots. This also can be automatically set by running an autotune on the process. Cutback high ‘CBH’ and cutback low ‘CBL’ are values that modify the amount of overshoot or undershoot that occur during large step changes in PV (for example, under startup conditions). They are independent of the PID terms, which means that the PID terms can be set for optimal steady state response and the cutback parameters used to modify any overshoot that may be present.
Cutback involves moving the proportional band towards the cutback point nearest the measured value whenever the latter is outside the proportional band and the power is saturated (at 0 or 100% for a heat only controller). The proportional band moves downscale to lower the cutback point and waits for the measured value to enter it. It then escorts the measured value with full PID control to the setpoint. In some cases it can cause a “dip” in the measured value as it approaches setpoint as shown, but generally decreases the time needed to bring the process into operation.
If cutback is set to “auto” the cutback values are automatically configured to 3*PB.
Cut back can be used for furnaces that have a large temperature difference between loading and the desired setpoint – it takes into account some of the inertia of the heating system and protects from overshoot.
Gain Scheduling – In some processes the tuned PID set may be very different at low temperatures from that at high temperatures from that at high temperatures from that at high temperatures particularly in control systems where the response to the cooling power is significantly different from that of the heating power. Gain scheduling allows a number of PID sets to be stored and provides automatic transfer of control between one set of PID values and another.
Gain scheduling is basically a look-up table that can be selected using different strategies or types; Auto-tune will tune to the active scheduled PID set. Different PID’s can also be set dependant on programmer segment (you may want to have a different control methodology when soaking at temperature to ensure stability to the ramp segment when you want to minimize the time to temperature without overshoot).
Failure of TC1 auto transfer to TC2 – particularly useful if you have a system with a resident SAT sensor or 2nd control sensor linked to the recorder (and linked back to control) – AMS2750E. When controlling the time cycle for a heat treatment load:
- Manually, the operator uses a clock and time load and must check charts to see when furnace achieved temperatures
- Semi-automatic, furnace has cycle timer that sounds an alarm, time-triggered when close or at setpoint
- Automatic (providing redundant backup to the operator), timer built into controller and triggered as desired. This can be triggered from a load or in-situ sensor that actually takes part temperature and starts soaking when this is within a set deviation of the setpoint. Alarms can be added in case the furnace heating system malfunctions and the temperature is not reached – a maximum time to reach temperature is programmed and if exceeded then will alarm and take action if necessary.
Redundant Control
Atmosphere control for carburizing typically uses a carbon sensor or oxygen probe, although Lambda Probes are now being used for certain applications. This architecture could be used to satisfy CQI-9 requirements for logging and checking carbon levels.
Additional Inputs
With multiple inputs, you can monitor control and load TC’s not only for monitoring purposes but for such applications like a “segment wait” function where the setpoint program will wait to advance to the next segment until the part TC has reached SP.


 general practice for CQI-9 and AMS2750E")


