


A vast majority of steel gears are heat treated in order to obtain the desirable properties of a final product such as a high wear resistance and a long fatigue life. There are numerous heat treating techniques available today. Which one is chosen depends on many factors including the required hardening pattern, allowable distortion, post-heat-treatment machining, energy consumption, and production line requirements [1].
One of the widespread techniques is induction hardening of gears, usually associated with high flexibility and controllability allowing the minimization of the final product distortion and the possibility to control, to a certain extent, the distribution of the residual stress [2]. Despite the apparent flexibility, adjustment of the induction heating parameters is a challenging problem originating from the complexity of the hardened gear’s geometry, highly non-linear steel properties in the range of heat treatment, and complex nature of the electromagnetic interaction in the system. The complexity is magnified even further if the optimization of stress distribution or distortion of the component is considered as a goal function. The analytical models are significantly limited in this case, whereas numerical simulations are of great importance. Numerous impressive investigations have been done in the last couple of decades, simulating the induction hardening of gears [3–7]. Some of the published works include the mechanical effects [8, 9].
One of the actual problems today is to verify the existing models and compare the simulation results with reliable and comprehensive experimental data. It looks promising to use the recently published papers concentrating on the experimental investigation of induction hardening of an aeronautic gear [10, 11]. Alongside in-process measurement of the isotherms [10], the exhaustive measurement of the residual stress with a novel technique is available [11]. Larregain’s et al. work has been already used for verification of magneto-thermal computations, and the results have been published as two master theses [12, 13].
This paper concentrates on a coupling of the commercial software package Cedrat Flux 3D v12 [14] for electromagnetic and thermal simulations with an open source package EDF Code Aster v12.2 [15] for the following phase transformations and stress-strain computations of the induction hardening of the aeronautic gear. Obtained simulation results are compared with the experimental published results [10, 11].
Experimental case
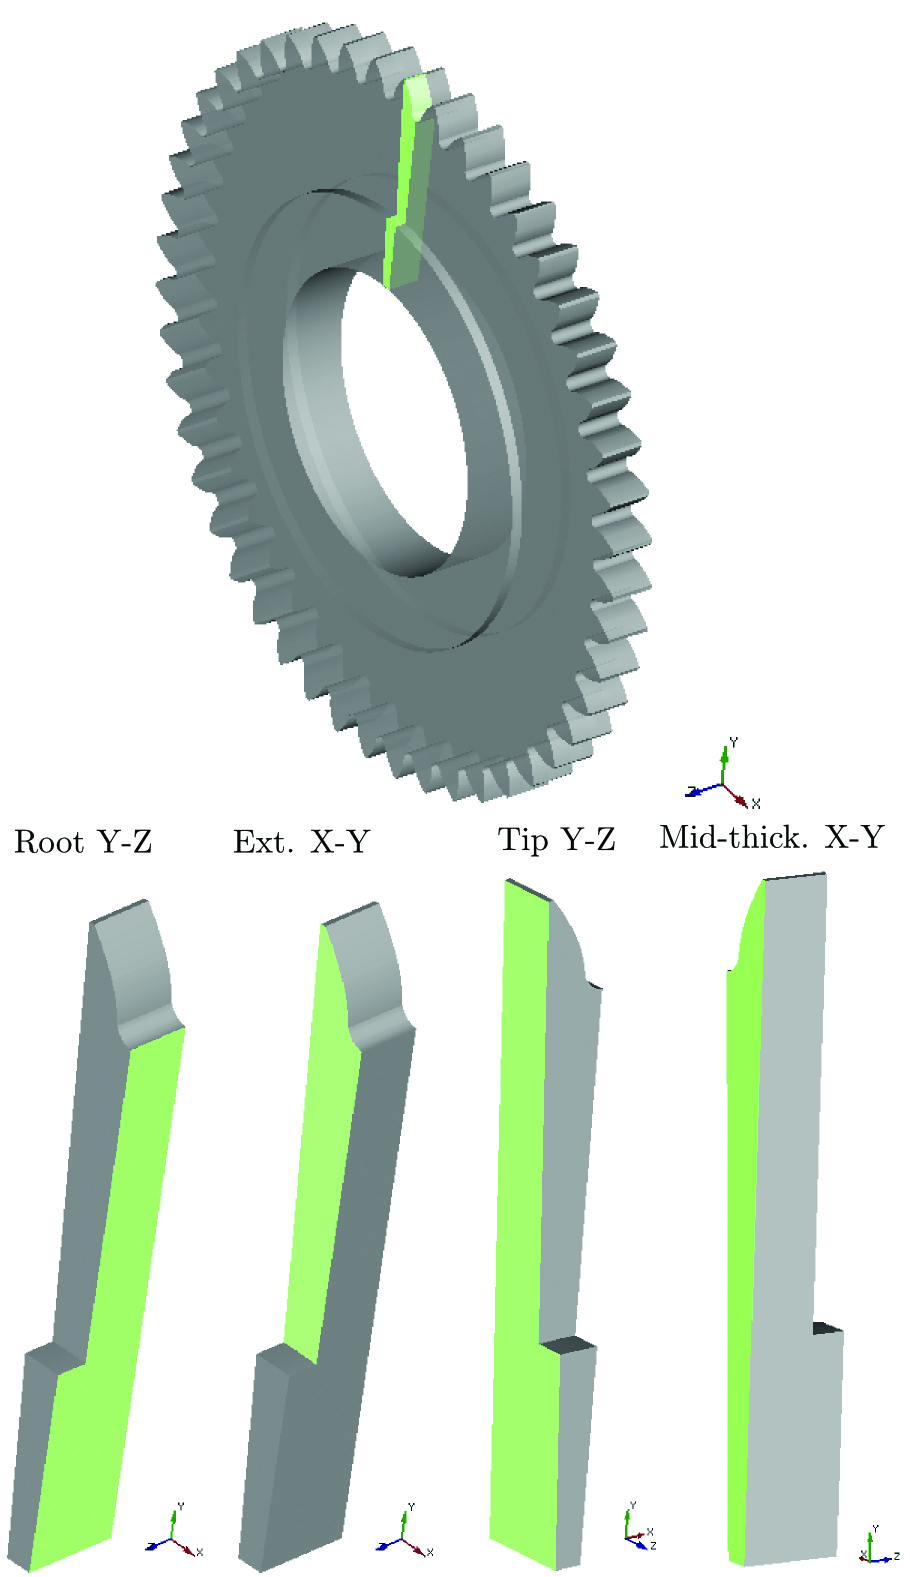
The geometry, material, and process parameters for simulation have been adopted from the original experimental investigations [10, 11]. As shown in Figure 1, only a quarter of the gear tooth is enough for the following procedure due to the symmetry of the geometry. The number of teeth is 48, therefore, the sector of 3.75° represents the features of gear shape entirely. Figure 1 introduces the designations of the geometry planes being used further as a reference and presentation of the simulation results.
The material of the gear is steel AMS 6414 (similar to AISI 4340) [11]. Prior to induction heat treatment, the material is quenched and tempered (Q&T) to a homogeneous initial hardness of 415 ±24 HV microstructure.
Case B from the Savaria’s et al. paper was chosen for simulation since the same induction heat treatment parameters and geometry have been used previously in Larregain’s et al. work for in-process measurement of isotherms [10, 11]. In the selected case, the induction coil of 110 mm inner diameter and a 6 mm thickness was connected to a generator, designed by EFD Induction AS, with dual simultaneous medium and high frequencies. The gear was preheated with medium frequency (10 kHz, 15.75 kW generator power) in 4.5 seconds. After a short dwell of 0.2 seconds, a final high frequency shot (190 kHz, 99 kW) was run. After heating, the gear was rapidly quenched with a water and liquid polymer spray solution (12 percent).
Shortly after the induction hardening, the gear was tempered in a furnace at 150°C for two hours.
Approach to simulation
Magneto-thermal simulations
A simulation flow chart is shown in Figure 2. Firstly, magneto-thermal computations have been run in Cedrat Flux 3D v12 [14]. Dependency of electric conductivity and magnetic permeability on temperature have been taken into account. Electromagnetic and thermal properties for low-alloyed medium carbon steel have been adopted for simulation. Symmetry boundary conditions have been exposed on the planes: Root Y-Z, Tip Y-Z, and Mid-thick. X-Y (see Figure 1). The geometry also includes the coil, surrounding air, and an infinite box.
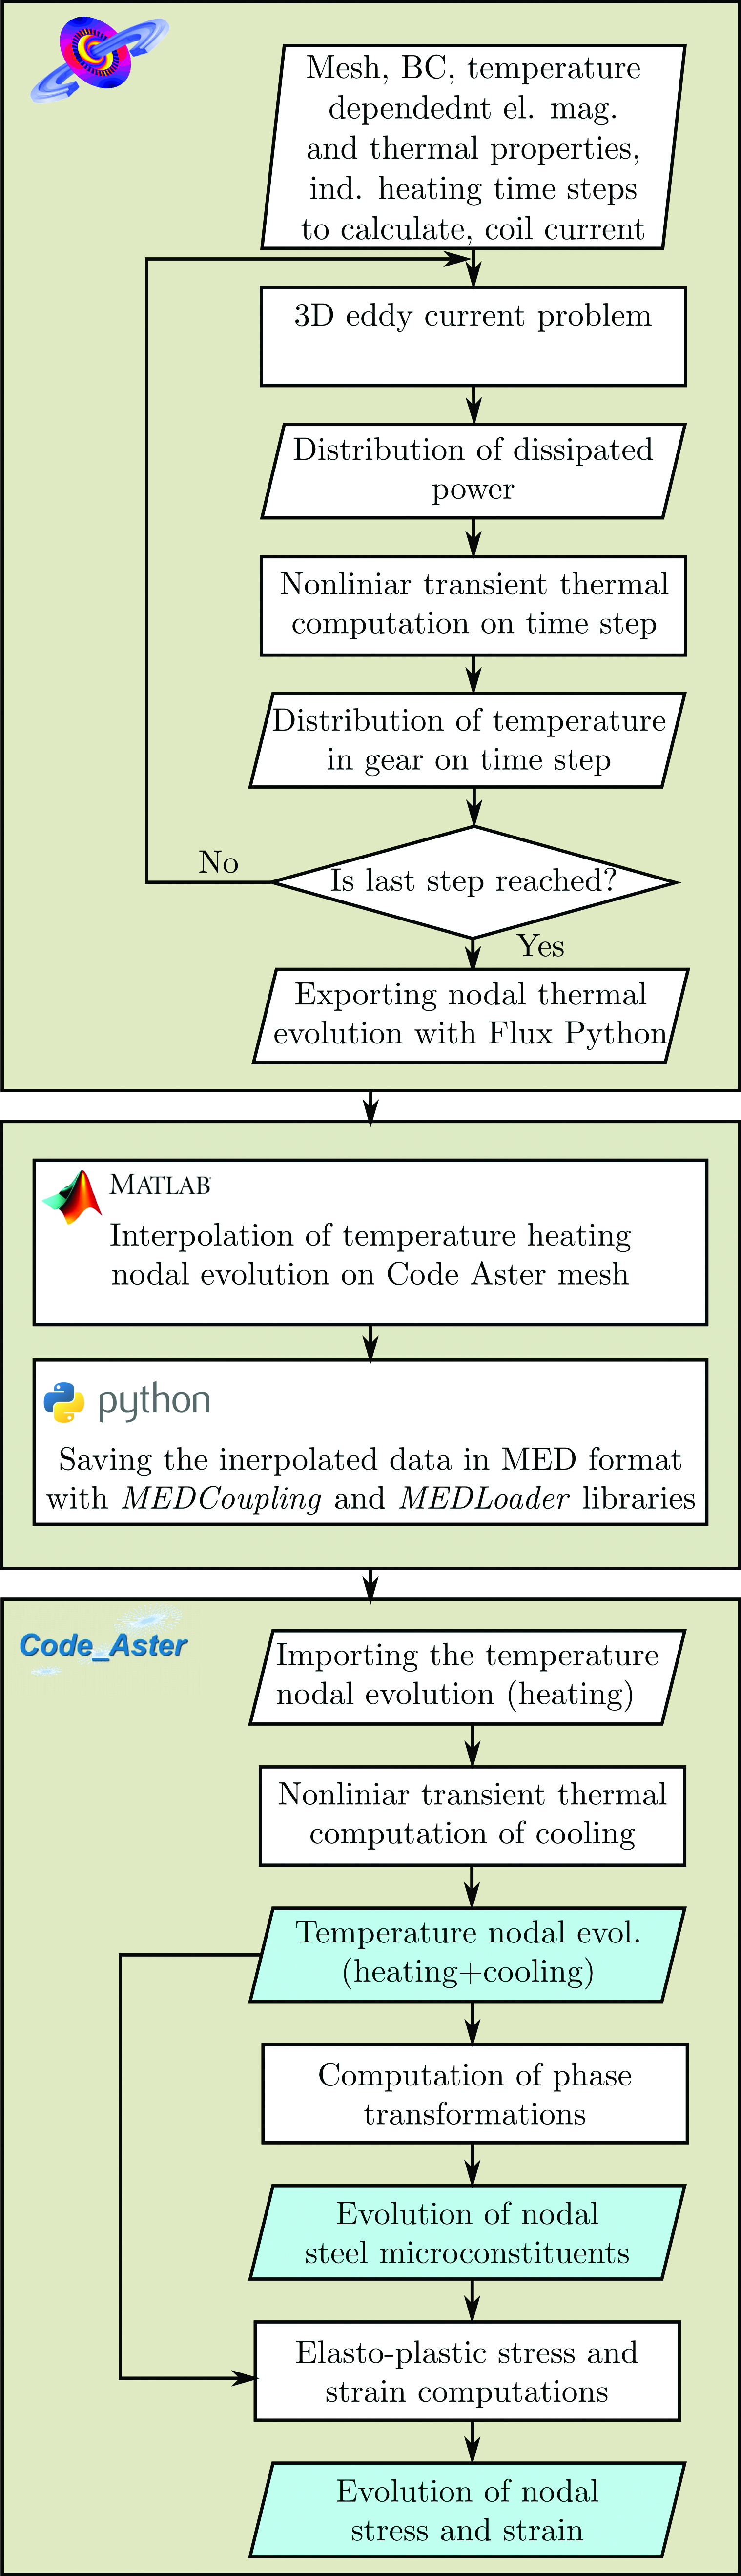
As a result of simulation, nodal evolution of temperature at the induction heating stage is obtained and exported for post-processing using Flux Python.
Coupling of Cedrat Flux and Code Aster
The finite element meshes used for the electromagnetic and mechanical computations are optimized taking into account the physics of simulated phenomena. The high frequencies used for induction heating in this case require the FEM electromagnetic problem to be created with a very fine mesh. Characteristic length not exceeding 0.1 mm is used for the regions closest to the surface. The total number of nodes used in the current investigation for discretization of the gear domain in Cedrat Flux 3D was 341429. The discretization density can be reduced for the phase transformation and stress-strain simulation. At the same time, the distribution of element sizes should be more uniform in this case as high stress is not limited by the hardening region due to mechanical integrity of the gear. The total number of nodes used in Code Aster simulation is 72021. In order to use the result of electromagnetic simulation, the nodal temperature evolution must be interpolated to a mesh used for a computation of the subsequent cooling, phase transformations, stress, and strain. This operation has been done in the Mathworks MATLAB environment [16]. The result of interpolation (projection) was exported then to a MED format as it is supported by Code Aster [17].
Phase transformations and stress-strain simulation
The resulting MED-file was imported by Code Aster. The last time step of induction heating simulation has been used for subsequent quenching calculation as initial temperature distribution. A concatenated list of nodal temperature evolutions during induction heating and quenching is input data for phase transformation computation. One can see that Code Aster runs metallurgical computations in a post-processing mode. In other words, no modification of thermal material properties caused by phase transformations are possible [18]. Therefore, latent heat of transformation should be included as a part of heat capacity.
The parameters of an austenitization model have been fitted to obtain the same hardening pattern as shown in referenced experimental works [10, 11]. The measured data indicates that the transformation is completed in a temperature range 704-816°C. See Figure 11 in Reference [10]. A simple austenitization model with constant Ac1 and Ac3 temperatures has been accepted due to a lack of experimental data. The model does not take into account an influence of heating rate on transformation kinetics. Adjustment of the model parameters results in Ac1 = 740°C and Ac3 = 760°C. The obtained apparent transformation range looks implausible from the metallurgical point of view, substantially because of its narrowness. Despite that, as it will be possible to see later, utilization of the apparent Ac1-Ac3 values allowed to obtain the hardening pattern conform to that observed in the experiments. Further investigations on reverse transformation to austenite of Q&T AMS 6414 steel is required to enrich the model with effects from taking the heating rate into account.
Resulting nodal evolution of temperature and micro-constituents, alongside mesh and boundary conditions, are the initial data for stress and strain computations. As in the magneto-thermal simulations, the symmetry boundary conditions have been imposed on the planes: Root Y-Z, Tip Y-Z, and Mid-thick. X-Y (see Figure 1). The model takes into account the transformation plasticity, von Mises classic plasticity, and isotropic hardening (relation META_P_IL_PT) is applied [19].
Material properties for the gear being used for the simulations correspond to Ck45 steel [20]. The initial Q&T structure is described by martensite properties. The very high yield limit of martensite drops down drastically during the final shot because of the transformation to soft austenite. This shows up as the source of the model’s significant non-linearity.
Results
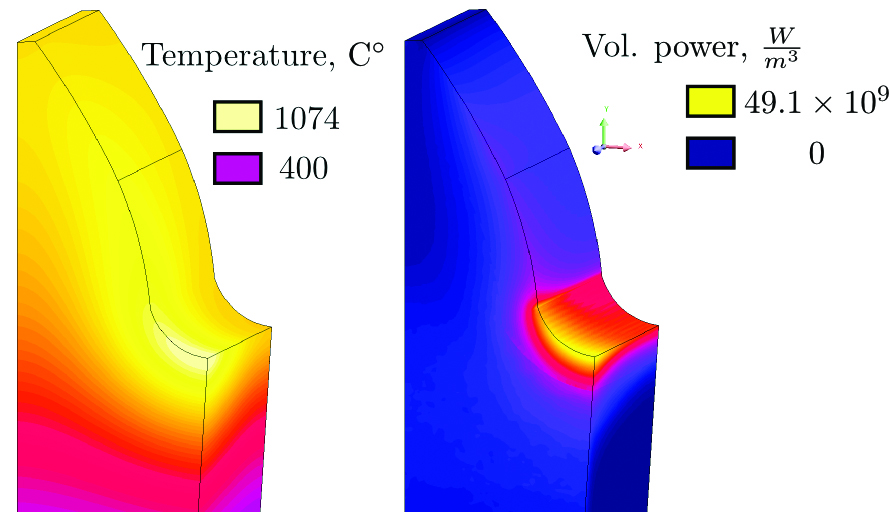
Despite the high frequency of 190 kHz used for the final shot, the peak of volumetric power is located in the root of the gear, as shown in Figure 3. This type of the power distribution is observed through the process and confirmed by similar simulations [12, 13]. The peak is shifted to the exterior plane due to the configuration of the magnetic field generated in the system. Such power distribution results in significant asymmetry in a Z-direction underlining the importance of full 3D-simulation in this case.
A comparison of the simulated surface isotherms with ones obtained in Larregain’s et al. experiment is shown in Figure 4. Note that simulated and experimental tooth shapes are slightly different — the tooth flank of simulated geometry is more convex. Apparently, this deviation is conditioned by a chosen method of CAD gear model construction according to the specified parameters.
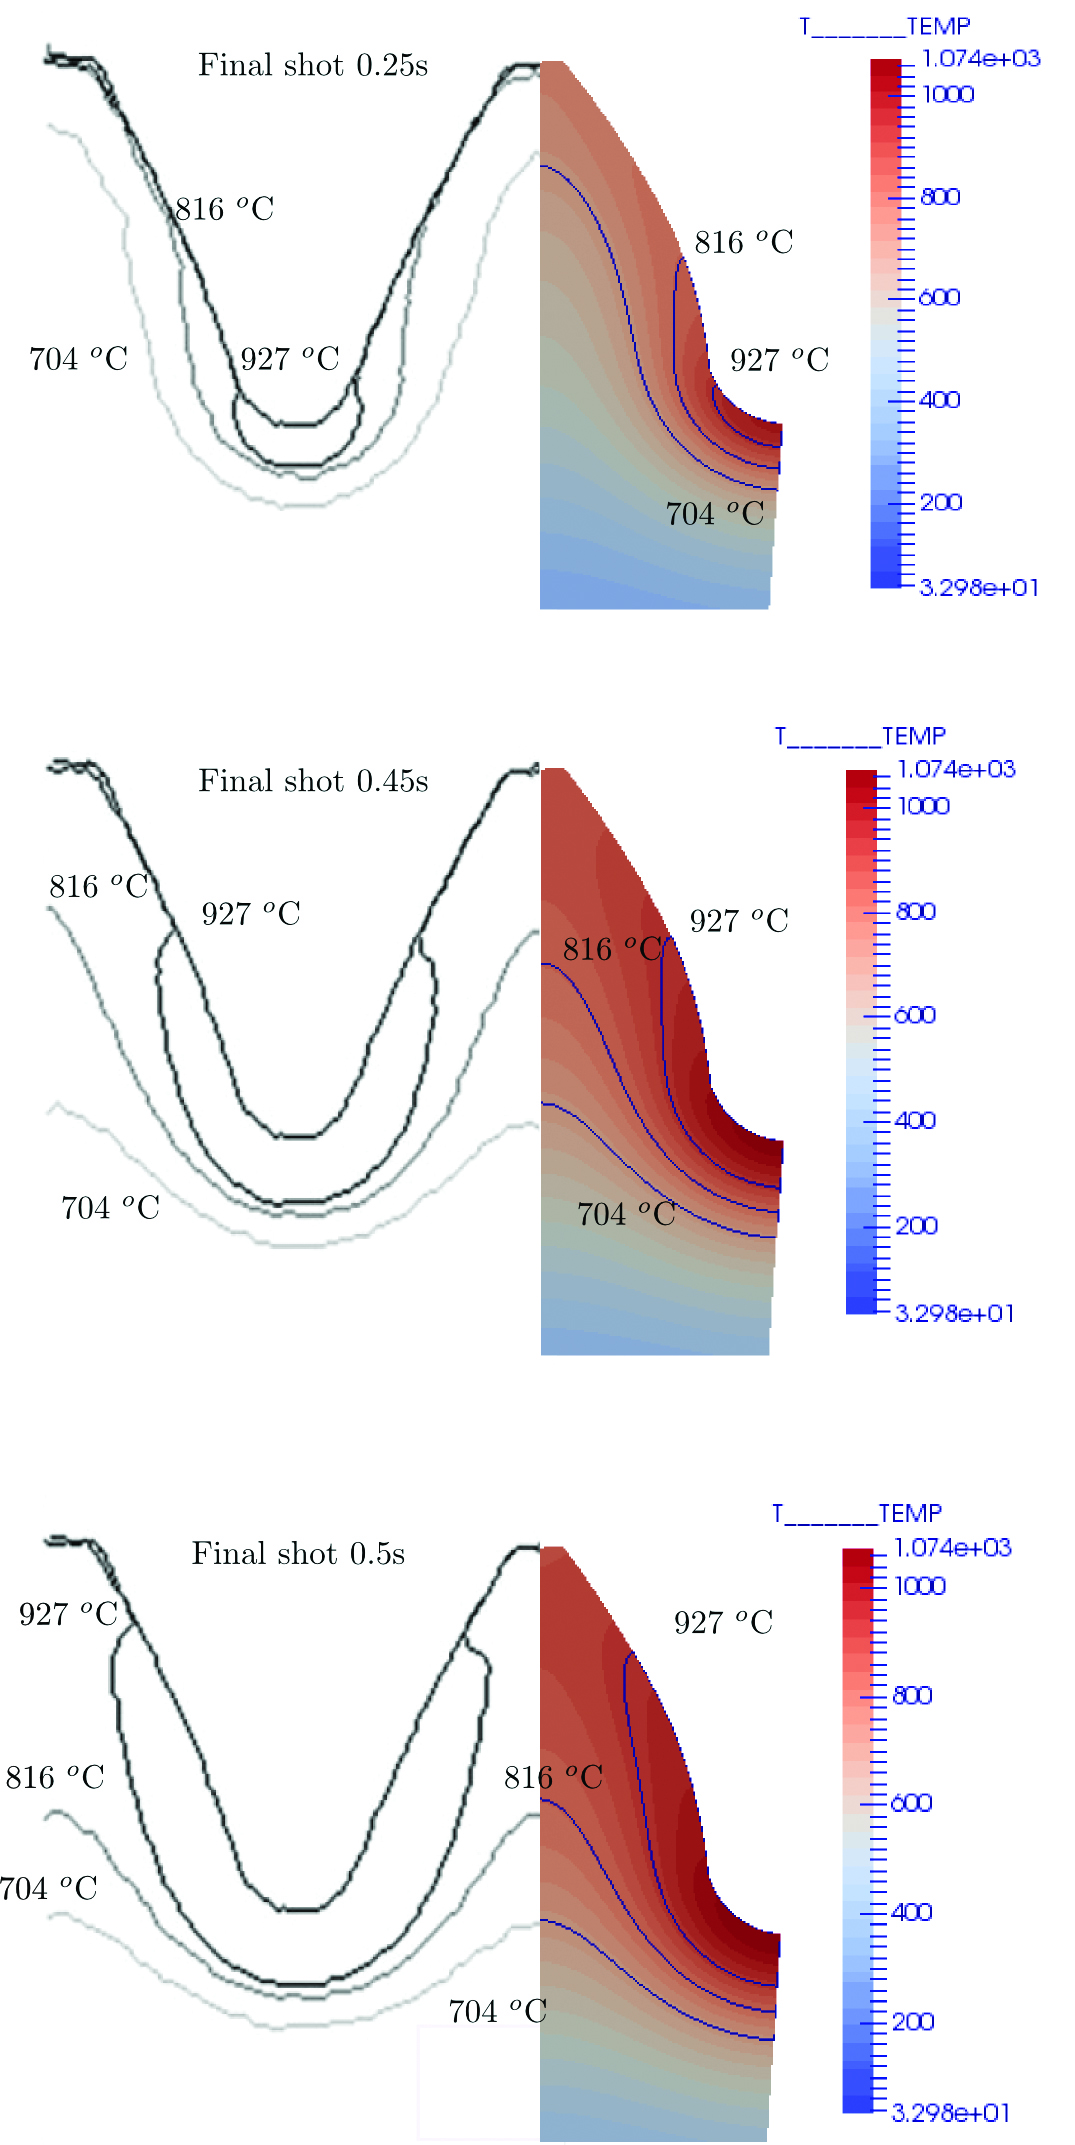
Conformity of in-process isotherms with simulated results is acceptable. No serious deviation is visible, except for the gradient in the temperature range of 704-927°C. It appears that simulation shows a shallower gradient, especially in the root area. A possible cause of that is the magnetic properties of the steel and the way they are treated in computation. Fine tuning of the AMS 6416 steel properties should be done in future work.
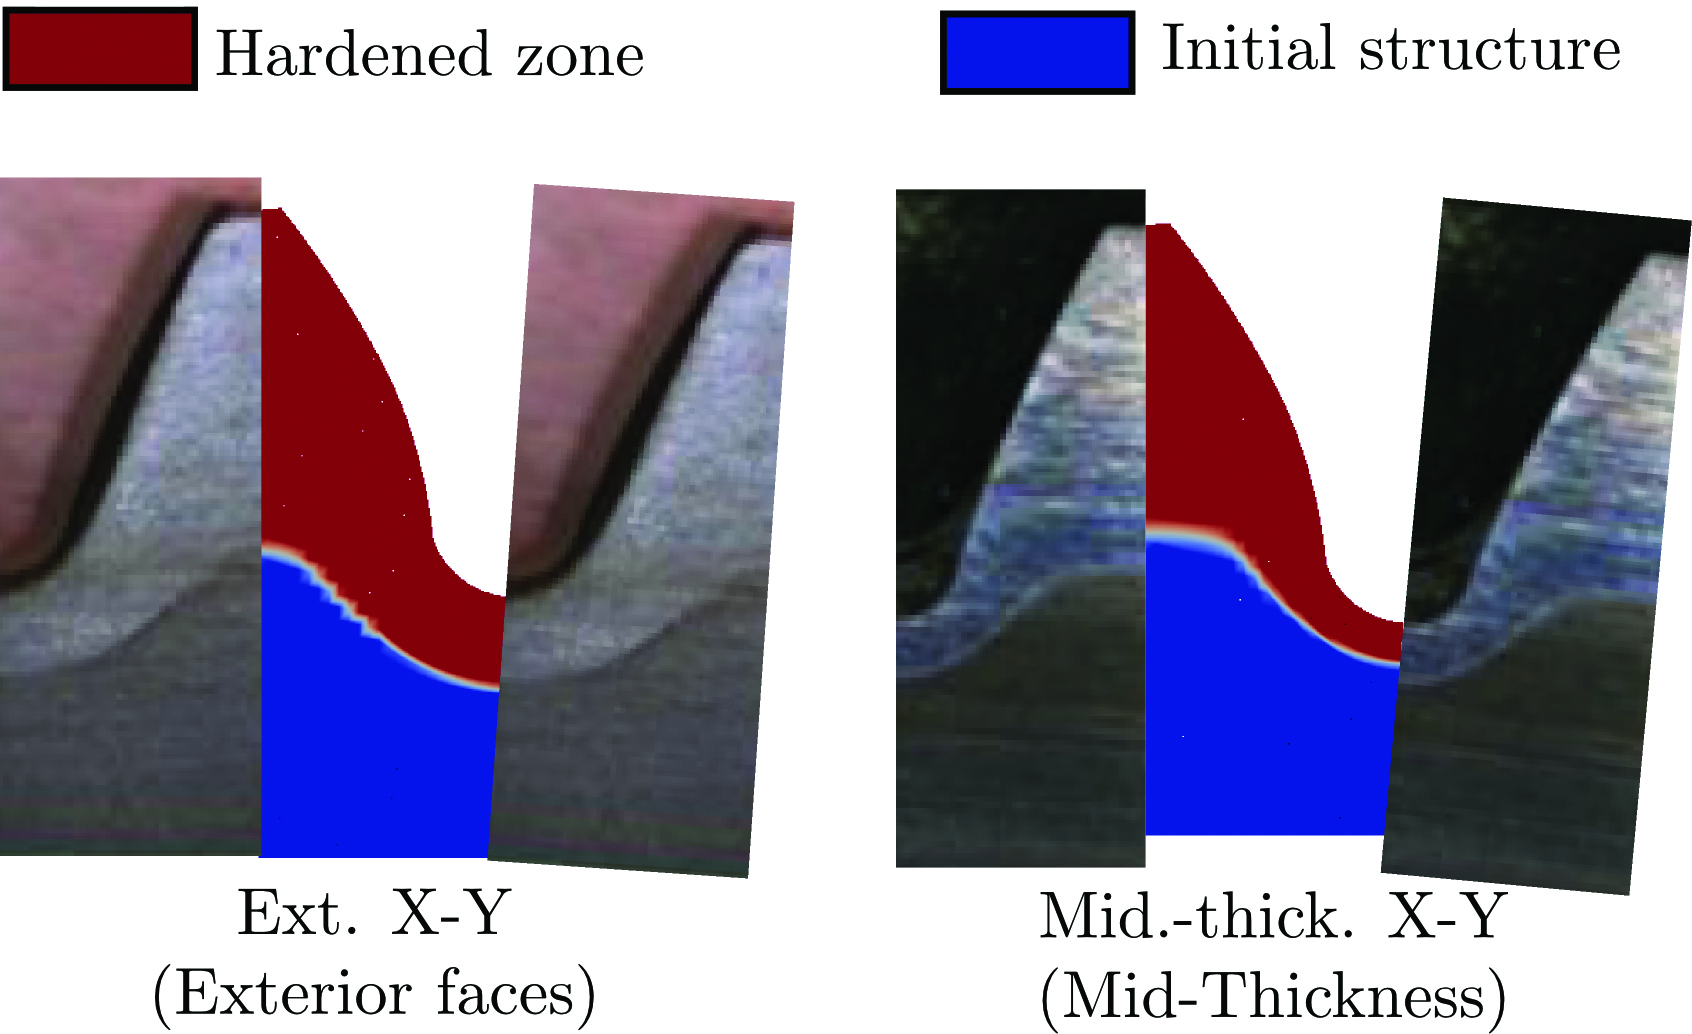
The comparison of simulated hardening pattern with the etched part is shown in Figure 5. An excellent match can be seen for the exterior surface, whereas the mid-thickness pattern is slightly shallower in the simulation.
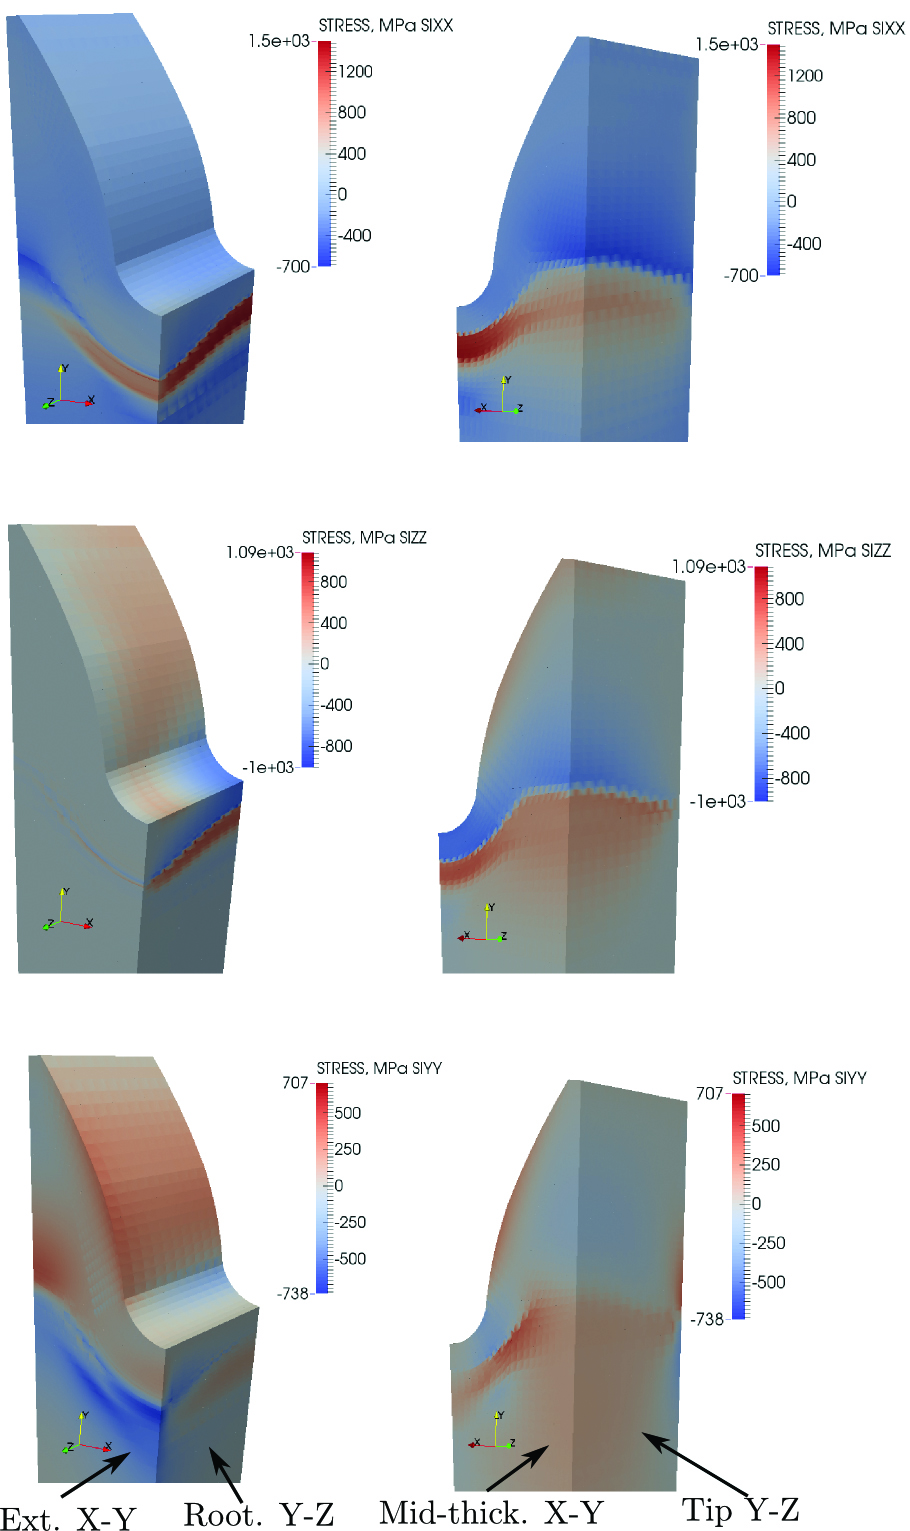
The simulated distribution of residual stress is shown in Figure 6. A very high tensile peak of σx and σy can be seen in the transition zone down the root area with a maximum value in the mid-thickness plane. A tensile peak of such magnitude is possible due to the accepted yield limit of Q&T microstructure corresponding to the yield limit of martensite.
Distribution of σy and σz along the tooth surface is rather complex. Moderate compression can be seen at the root area starting from the mid-thickness plane. The compression gradually turns into a moderated tension moving both up to the tooth flank and toward the exterior faces along the root. The distribution of stress at the pitch area is more uniform.
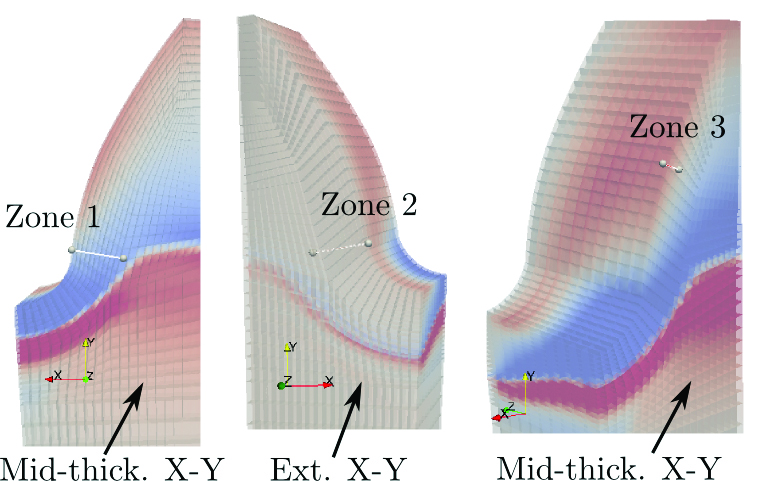
The result of the residual stress simulation was compared with experimental measurements done by Savaria et al. on a final part after grinding [11]. The same locations as in the original work have been defined in a geometric model. The locations and in-depth direction of measurement are shown in Figure 7. (See Figure 4 in [11] for definition and comments in the original work.) The measured axial component of stress tensor (stresses σZ1 and σZ3 accordingly for zones 1 and 3) corresponds to axis Z in the current work. The orientation of the measured component B in the original work is nearly parallel to axis Y in the current investigation. Therefore, the Y-component of stress is exported from the simulation and the pairs σB1-exp — σY1-sim, σB2-exp — σY2-sim, and σB3-exp — σY3-sim are to be compared.
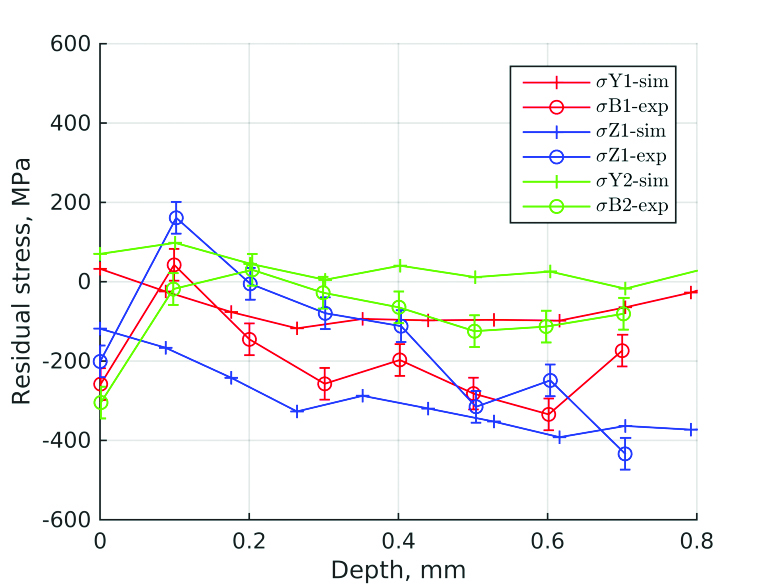
Figure 8 shows the experimental and simulation data for zones 1 and 2. In contrast to simulation, the experimental distributions σB1-exp, σZ1-exp, and σB2-exp have the drop toward the more compressive stress at the very surface. As it was explained in the original work, this drop can result from the grinding operation applied after induction hardening and before stress measurement.
It is accepted that the measurements are affected by the grinding down to a depth of 0.1 mm. It is worth noting that zones 1 and 2 are located in a stress transition area (from tension to compression) as shown in Figure 6. The actual values of stress distribution obtained from simulation are very sensitive to zone position, especially for zone 1. Taking into account that fact and accuracy of measurement (±40 MPa), one can see an acceptable conformity of experimental result and simulation.
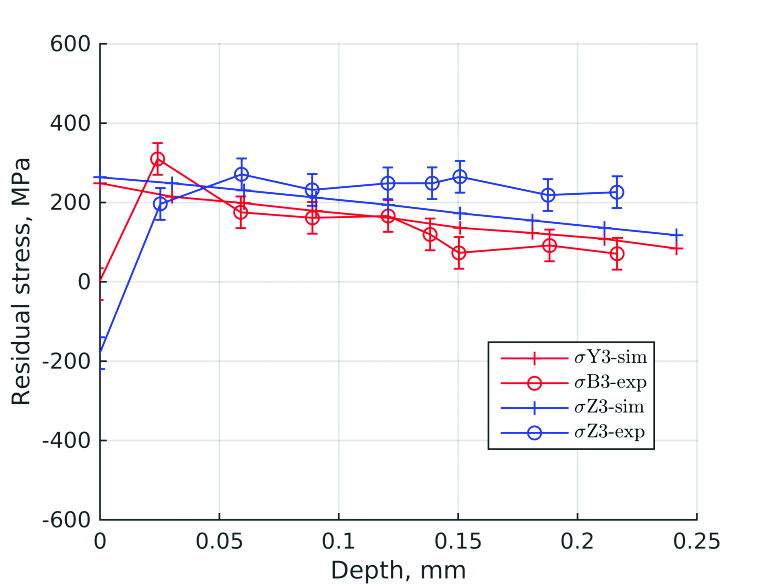
The simulation result fits the experimental data even better if zone 3 is considered (see Figure 9). Again, the surface stress drop in experimental lines σB3-exp and σZ3-exp can be related to grinding operation. The rest of the results obtained from simulations are in a good agreement with experimental measurements. In contrast to zones 1 and 2, zone 3 is located in the area with a stable stress distribution and not as sensitive to location of measurement.
Conclusion and further work
Despite the accepted simplifications, the simulation results appear to reflect the real distribution of residual stress in the investigated spur gear after the induction hardening process. It makes it possible to consider the optimization of stress distribution by varying the process parameters using the provided approach to simulations.
As the part of future work, fine tuning of material parameters should be done. In particular, the parameters identification of the austenitization model dependent on the heating rate is of great interest. In addition, more accurate electromagnetic, thermal, and mechanical properties of Q&T AMS 4340 steel (or similar) is an open question.
Finally, the experimental work done by Savaria et al. contains the results for three other combinations of process parameters including the dual-frequency processes. Reconstruction of these experiments in numeric simulations is the short-term target, as it allows fine tuning of the simulation tools being used on a daily basis at EFD Induction.
Acknowledgments
The authors are grateful to Dr. Vincent Savaria and Professor Philippe Bocher for providing the details of their work.
References
- Nicholas Bugliarello et al. “Heat Treat Process For Gears.” In: Industrial Heating (1995).
- Valery Rudnev. “Induction hardening of gears and critical components.” In: Gear Technology (2008), pp. 58–63.
- E. Wrona, B. Nacke, and D. Resetov. “3DModelling of the Transient Heating Process for Induction Surface Hardening.” In: MEP-International Scientific Colloquium Modelling for Electromagnetic Processing, Hanover. 2003, pp. 119–123.
- Dietmar Höomberg, Thomas Petzold, and Elisabetta Rocca. “Analysis and simulations of multifrequency induction hardening”. In: Nonlinear Analysis: Real World Applications 22 (2015), pp. 84–97.
- Alessandro Candeo et al. “Multiphysics modeling of induction hardening of ring gears for the aerospace industry.” In: Magnetics, IEEE Transactions on 47.5 (2011), pp. 918–921.
- Thomas Petzold. “Modelling, analysis and simulation of multifrequency induction hardening.” Ph.D. thesis. Technische Universität Berlin, 2014.
- Steffen Klonk. “Numerical modelling of induction heating for complex geometrical parts.” Ph.D. thesis. Ecole Nationale Supérieure des Mines de Paris, 2013.
- Zhichao Li and B. Lynn Ferguson. “Controlling gear distortion and residual stresses during induction hardening.” In: American Gear Manufacturers Association Technical Paper, 11FTM25 (2011).
- D. Hömberg et al. “Simulation of multifrequency-induction-hardening including phase transitions and mechanical effects.” In: WIAS Preprint 1975 (2014).
- Benjamin Larregain et al. “Method for accurate surface temperature measurements during fast induction heating.” In: Journal of materials engineering and performance 22.7 (2013), pp. 1907–1913.
- Vincent Savaria et al. “Measurement and correction of residual stress gradients in aeronautical gears after various induction surface hardening treatments.” In: Journal of Materials Processing Technology 220 (2015), pp. 113–123.
- Damiano Mingardi. “Numerical models for induction hardening of gears.” MA thesis. Universita Degli Studi Di Padova , 2013.
- Lorenzo Ciccarone. “Models and tests of induction contour hardening process.” MA thesis. Universita Degli Studi Di Padova, 2014.
- Cedrat. Flux – electromagnetic and thermal finite element software. 2015. url: http://www.cedrat.com/en/software/flux. html.
- EDF R&D. Code Aster – Analysis of structures and thermomechanics for studies and research. url: http://www.code-aster. org/V2/UPLOAD/DOC/Presentation/ plaquette_aster_en.pdf (visited on 06/30/2015).
- MATLAB. 8.4.0.150421 (R2014b). The MathWorks Inc., 2014.
- Open Cascade, EDF, and CEA. MED data model. 2015. url: http://www.salomeplatform.org/user-section/about/med (visited on 06/30/2015).
- Jean Angles. Notice dutilisation pour des calculs thermo-métallo-mécaniques sur des aciers. 2012. url: http://www. code-aster.org/V2/doc/v11/fr/man_u/ u2/u2.03.04.pdf.
- Jean Angles. Modélisation élasto (visco) plastique prenant en compte des transformations métallurgiques. 2012. url: http://www. code-aster.org/V2/doc/v11/fr/man_r/ r4/r4.04.02.pdf.
- Hubertus Josephus Maria Geijselaers. “Numerical simulation of stresses due to solid state transformations: the simulation of laser hardening.” Ph.D. thesis. University of Twente, Enschede, 2003, p. 142.


 general practice for CQI-9 and AMS2750E")


