


Concern about global warming motivates the reduction of greenhouse gas emissions from manufacturing, but the environmental impact of the whole powder metallurgy production chain has not been assessed yet. This paper traces the flow of energy and material through the major powder-metallurgy processes from liquid steel to final products and assesses the efficiency of both energy and material use. The results show there is significant opportunity for reducing energy and material requirements in delivering products. Specific opportunities such as avoiding lasers in additive manufacturing or minimizing heat losses in powder sintering are proposed and evaluated.
1. Introduction
Powder metallurgy processes provide opportunities that are not available when using material in the conventional form: Melting is not required in order to form complex components, and the rapid solidification typical of powder production allows for use of highly alloyed compositions. Concern about global warming has led to agreement on national and international targets to reduce greenhouse gas (GHG) emissions [1]. Industry is responsible for 35 percent of all energy/process emissions [2, p. 13]. Emissions from steel powder metallurgy are currently only a small portion of industrial emissions but may become more significant with the rapid growth of processes such as metal additive manufacturing. Wohlers and Associates [3, p. 123], for example, reported that material sales increased 49 percent between 2013 and 2014. This paper therefore aims to assess the total impact of production processes associated with powdered steel in order to identify opportunities for reducing the environmental impact of powder metallurgy.
Several previous studies have considered aspects of the environmental impact of steel powder processes. The energy inputs of press and sintering processes, which account for approximately 90 percent of the mass of products made with ferrous powder [4], have been quantified in detail by Bocchini [5]. By analyzing case studies, Bocchini [5] was able to propose measures such as reducing heat losses in sintering to reduce the process’ environmental impact. Three decades later, Kruzhanov and Arnhold [6] evaluated the energy consumption of press and sintering combined with water atomization and assessed their efficiency. They concluded that the two processes are three times more energy intensive than their theoretical minimum. Compared to the other powder metallurgy processes, press and sintering have been well characterized regarding their energy and material efficiencies.
Additive manufacturing is the only process other than press and sintering whose environmental impact has been studied in the literature. Huang et al. [7] have considered the environmental impact of additive manufacturing within the complete lifecycle of metallic aircraft components and concluded that, if it is used to the full potential, emissions from civil aviation in the United States could be reduced by approximately 6 percent. Additive manufacturing allows for more design freedom than conventional processes, thus enabling further optimization of components. Faludi et al. [8] calculated the emissions at different stages of one particular additive manufacturing process: selective laser melting. They considered the whole production chain and verified the additive process is most energy intensive. Faludi et al. [8] proposed that GHG emissions could be reduced most effectively by using the machine at full capacity and turning it off when not in use. The environmental impact of additive manufacturing has had more attention from researchers than any other powder metallurgy process while making the powder — which is also important — has been ignored.
No previous studies consider the environmental impact of the whole powder metallurgy production chain — from powder production to final application. Furthermore, the energy and material efficiencies of processes such as hot isostatic pressing and gas atomization have not previously been quantified. However, at a larger scale, Cullen et al. [9] have mapped the flow of all steel across the whole supply chain leading to identification of a set of measures that could allow delivery of the same final services from less material production. This approach provides the inspiration for this paper, in which an assessment will be made of all the major powder metallurgy processes in order to explore whether there are equivalent measures for reducing the GHG emissions of making and using steel powder.
The methodology used to analyze the whole steel powder production chain is described in the next section. The results are shown in Section 3 and a set of actions to reduce the environmental impact of powder metallurgy processes is proposed and discussed in Section 4.
2. An analysis of the steel powder metallurgy production chain
In order to develop a complete picture of the energy and material requirements of the powder metallurgy production chain, this section maps the sector and compares current practice with estimated limits to determine its efficiency. A map of the production chain is first developed in Section 2.1. The potential for improving the efficiency of energy use ( Section 2.2) and material use ( Section 2.3) is then calculated.
2.1 A map of the production chain
In order to provide a holistic picture of the production of final parts from steel powder today, a map is developed to trace the flow of material and energy inputs into the required chain of processes from initial production to final application. Constructing this map requires that data from diverse sources is reconciled with estimates used to fill data gaps.
The steel powder metallurgy production chain is divided into four steps (Table 1).
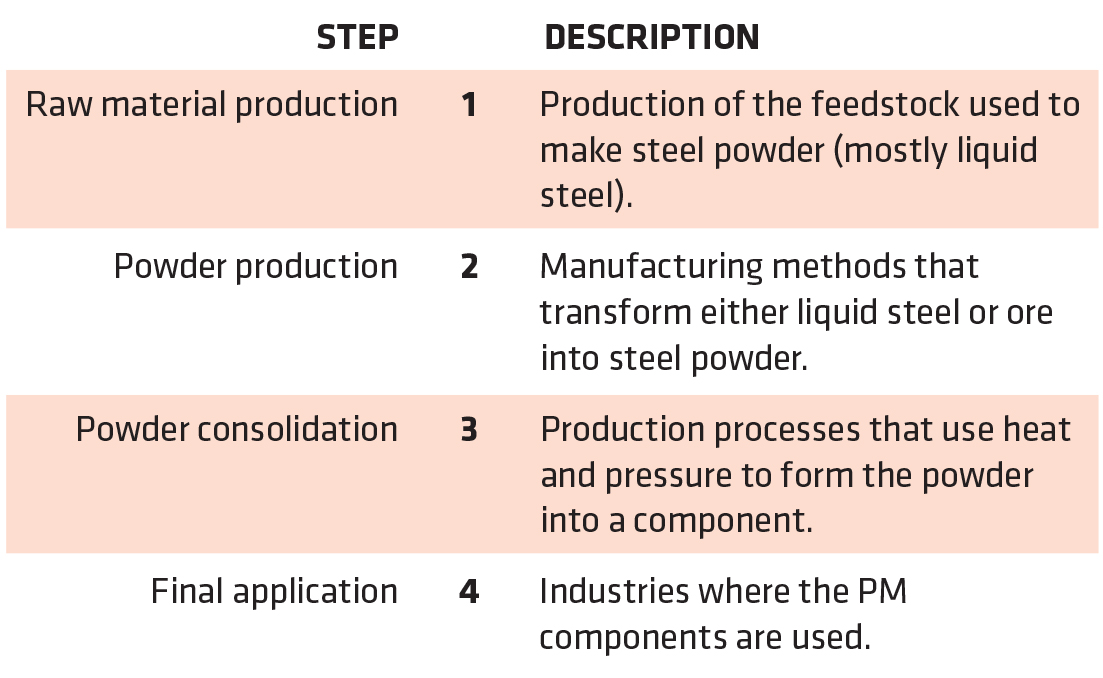
Most steel powder is made from liquid steel, so the production chain starts with processes that are similar to conventional steel making. Large powder producers tend to use steel made from prompt scrap in electric arc furnaces [10], while smaller powder producers are more likely to use induction melting. Since two thirds of atomized powder is made by large producers, and the rest is made by smaller operations [11], this proportion was assumed for the distribution of electric arc and induction steelmaking. Steel must typically be refined after melting and Höganäs AB [10] describe the use of ladle refining, which was assumed to be the most significant refining method.
Liquid steel is supplied to atomization processes in step 2 to make steel powder. Most data on powder production and consolidation is published by continental trade associations. These publish yearly reports on the state of the powder metallurgy industry that are focused on water atomization and press and sintering. The most up-to-date sources are described in the supporting information. Additional sources were used for hot isostatic pressing [4] and additive manufacturing [3]. The available data tends to be separated by whether it is related to powder production or consolidation. This is convenient because it helps to define the mass flows through steps 2 and 3 and because the continental data can be added up to estimate the global picture. Steps 2 and 3 were connected by enforcing mass balance and matching the characteristics of the powder-production methods with the requirements of the consolidation processes, which can be extracted from technical literature on PM, such as German [12].
There is limited data about the final application of powder metallurgy components (step 4). Trade associations only publish data for the press and sintering process whose main applications are in the automotive sector. The flows from the remaining processes were estimated based on qualitative remarks on their main areas of application found on process specific sources (described in the supporting information).
2.2 Energy efficiency of powder metallurgy processes
The most common definition of energy efficiency (η = Euseful/Ein) is not applicable to manufacturing processes that do not have a useful energy output (which is the case for most powder metallurgy processes). A definition of efficiency needs to: (i) allow for direct comparison of different processes; (ii) represent their potential for improvement; (iii) be based on physical mechanisms. Therefore, energy efficiency (η) was defined by,
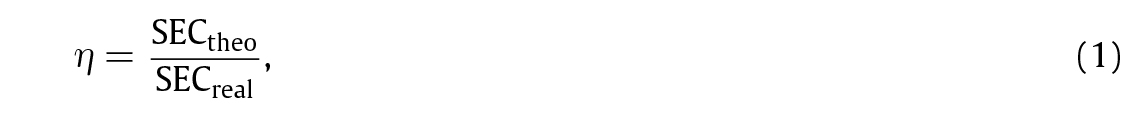
where SEC = E/m is the specific energy consumption, m is the mass output of the process and E is the total energy used by the process. The subscripts “theo” and “real” distinguish the theoretical minimum energy consumption and the actual energy inputs of the process. Irreversibilities make an efficiency of 100 percent unattainable in practice, hence the potential for process improvement can only be assessed by comparing the energy efficiencies of different manufacturing methods. However, this comparison needs to consider the restrictions caused by the practical implementation of each process. For example, melting allows for the material to be densely packed whereas sintering requires the components to be spaced out. These restrictions are process dependent and can significantly reduce energy efficiency. The comparison of SECtheo and SECreal also provides guidance in the reduction of energy losses. The two measures of energy intensity are described in the following paragraphs:
Powder metallurgy processes mainly apply heat and/or work to transform the work piece into a product. SECtheo is obtained by using the first law of thermodynamics to obtain the energy requirements of each process. The process parameters such as temperature and pressure are obtained from the literature and are applied assuming that there are no irreversibilities.
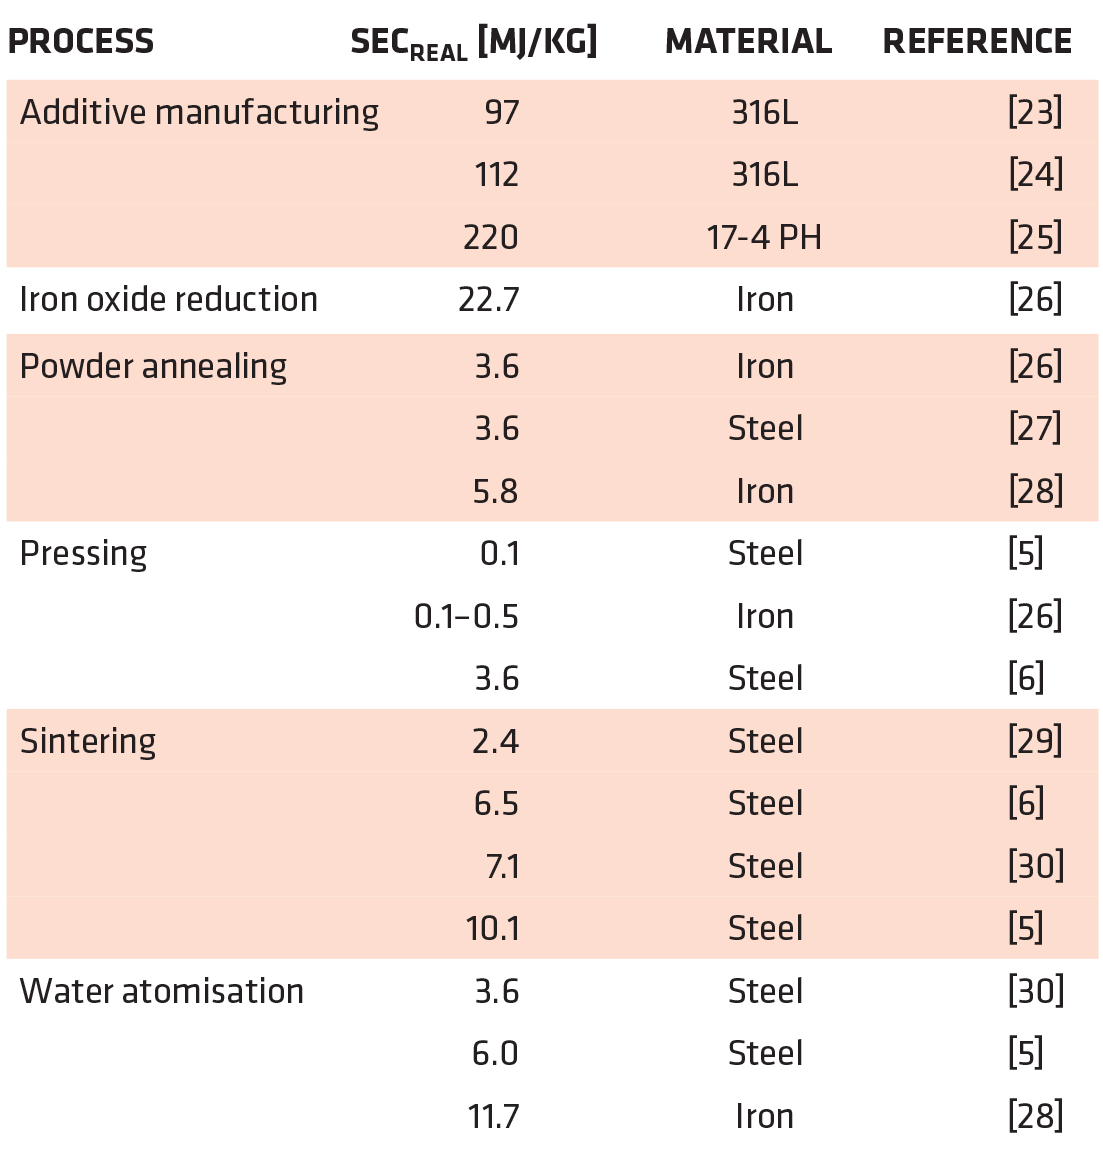
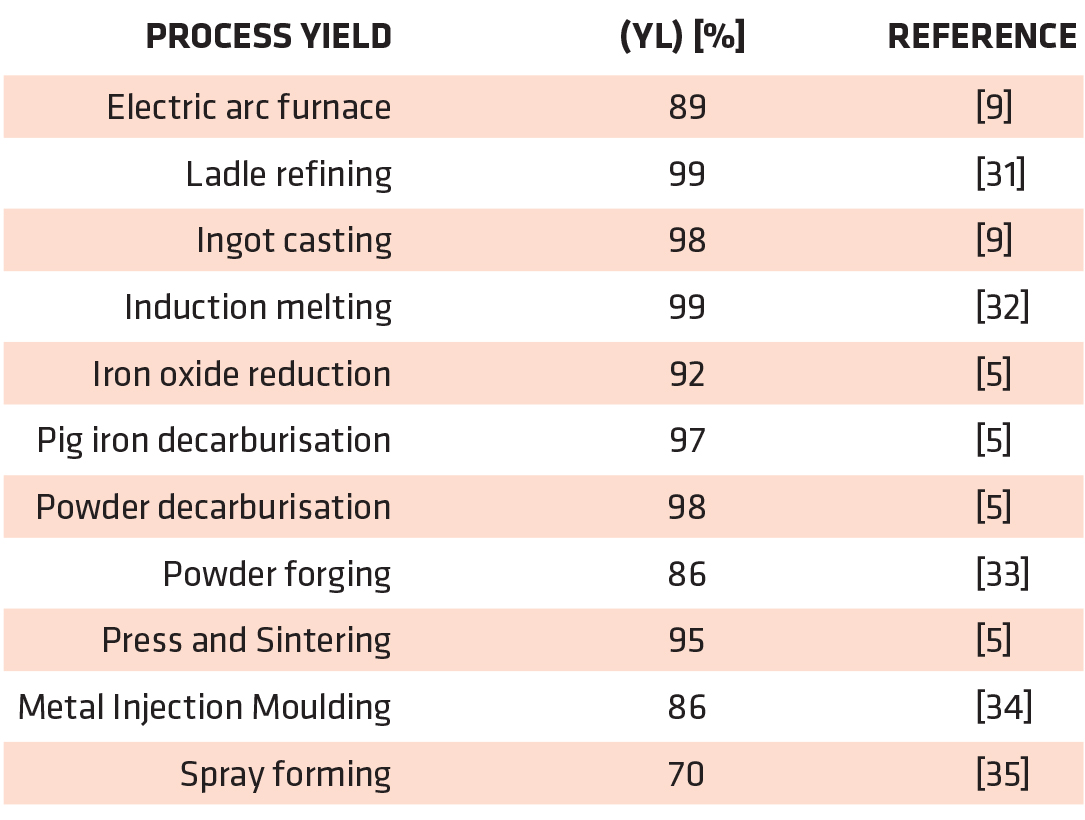
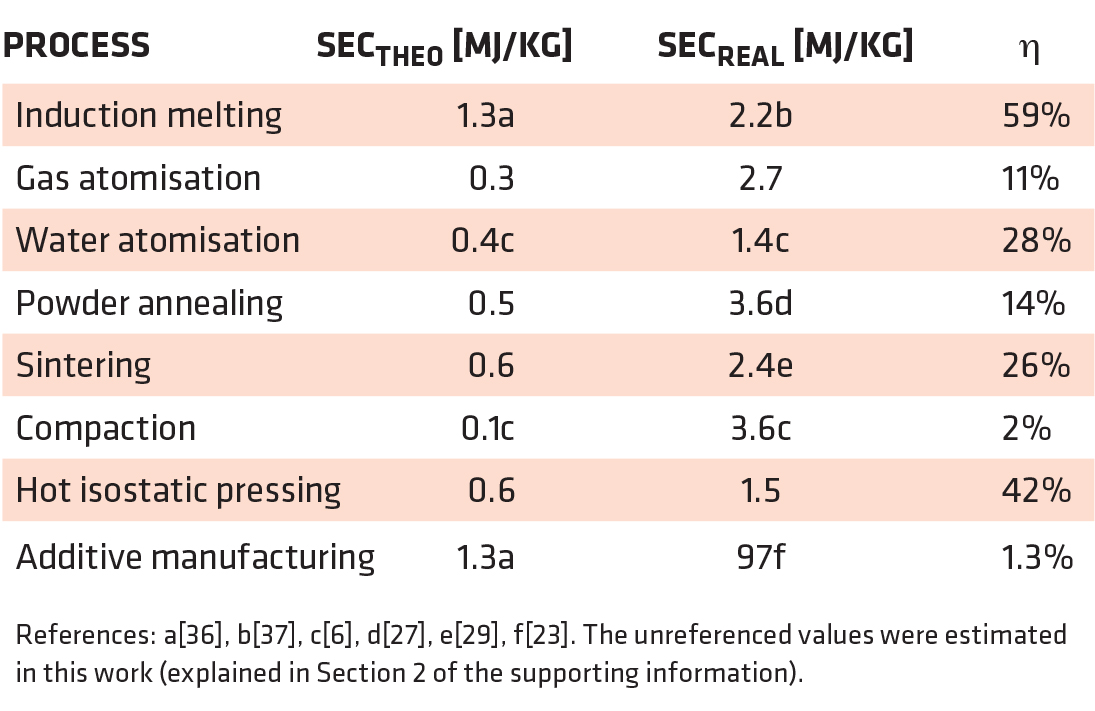
There is SECreal data available in the literature for some powder metallurgy processes (Table 2). This data was used directly in Equation 1. The lowest value was chosen when processes have multiple data points because it represents the most efficient use of the process. Most existing data covers the use of irregularly shaped steel powder to make components using the press and sintering process. This is the most significant production route according to production mass. The only other process for which there is energy data is additive manufacturing. For gas atomization and hot isostatic pressing, no energy consumption data has been published, so models were developed in order to estimate their energy intensity. The values of SECreal were estimated by relaxing the assumption of reversible processes used to obtain SECtheo. This requires the consideration of losses due to heat transfer to the environment, friction, and other losses. This procedure is summarized for each process in the next paragraphs and described in detail in the supporting information.
The hot isostatic pressing process uses high temperature and pressure simultaneously to transform powder into a solid. The heat is supplied by resistive heating, and the pressure is applied by compressing a gas that surrounds the workpiece. The theoretical minimum energy intensity is given by,

where qM is the specific heat supplied to the workpiece, mM is its mass, and WC is the work required to compress the gas. The modeled energy input is given by,

where QG and QI are the heat supplied to the gas and the furnace, QL, represents heat losses to the environment, and W’C represents the energy input required to compress the gas, considering irreversibilities. The main uncertainties in using this equation to predict real process energy inputs arise in estimating the energy required to compress the gas and the steady state heat losses of hot isostatic presses. This was addressed by consulting a producer of hot isostatic pressing equipment. The calculation of all the coefficients of Equation 3 is described in Section 2.2 of the supporting information.
Gas atomization uses a compressed inert gas to break up a stream of molten metal into droplets. This is caused by transfer of kinetic energy from the gas to the metal stream. The theoretical minimum energy intensity is given by,

where VG/mM is the flow ratio of gas volume to steel mass, ρG is the gas density (the gas properties are at normal temperature and pressure) and wG is the specific work required to compress the gas. The modeled energy input is given by,

where YGA is the yield of gas atomization, qG is the specific heat supplied to the gas (per mass of gas) and SECG is the specific energy consumption of gas production. The model assumes that heat, as opposed to work, was supplied to the gas because this is practiced in industry to reduce gas and energy consumption [13]. The main difficulty in using this equation to predict the energy consumption of gas atomization is in finding representative values for VG/mM. Researchers publish this data for experimental atomizers but values are not available for industrial units. This value was chosen by consulting a steel-powder producer. The full procedure used to obtain SECGAreal is described in Section 2.1 of the supporting information.
2.3 Material efficiency of powder metallurgy processes
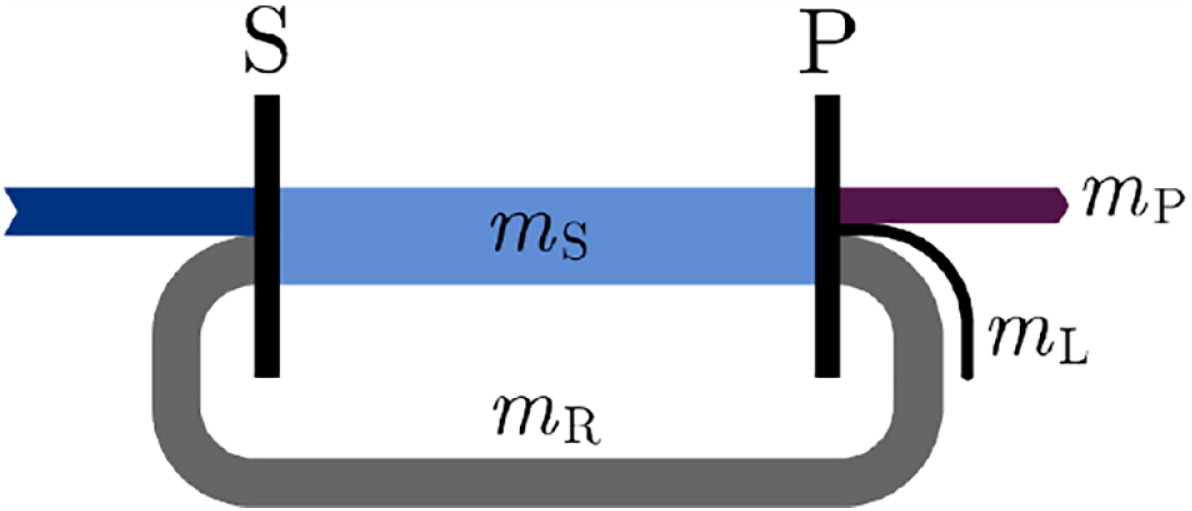
The quantification of yield losses and thus the characterization of the material efficiency is essential to the definition of energy efficiency of the useful material output of a process. The yield losses determine how much material must be processed upstream in order to fulfil the needs of a given process. The material that leaves a manufacturing process has three possible paths: (i) it can be incorporated into the product; (ii) it can be reused or recycled; (iii) it can be “lost.” Two different types of yield losses arise from paths (ii) and (iii) and are quantified by,
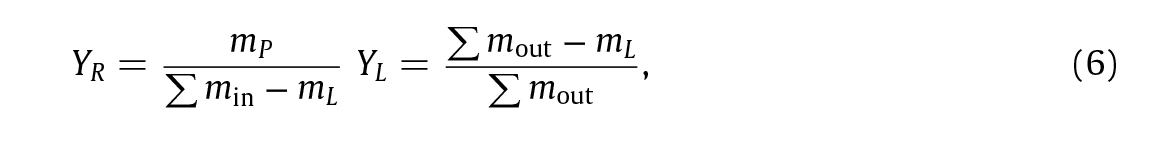
where YR represents the material that goes through path (ii) and YL through path (iii). Σmin and Σmout are the sum of the mass that enters and leaves the process, mP is the mass of material that is incorporated into the product and mL represents the material that is “lost.” (Figure 1)
The yield values for each process were found through literature surveys (this data is summarized in Table 3). No data was found for some of the processes, so yield values were estimated using similar processes as reference (for example: water and gas atomization). Mass balances were also used to estimate yield losses when the mass flowing in or out of adjacent processes was known.
3. Material and energy flows
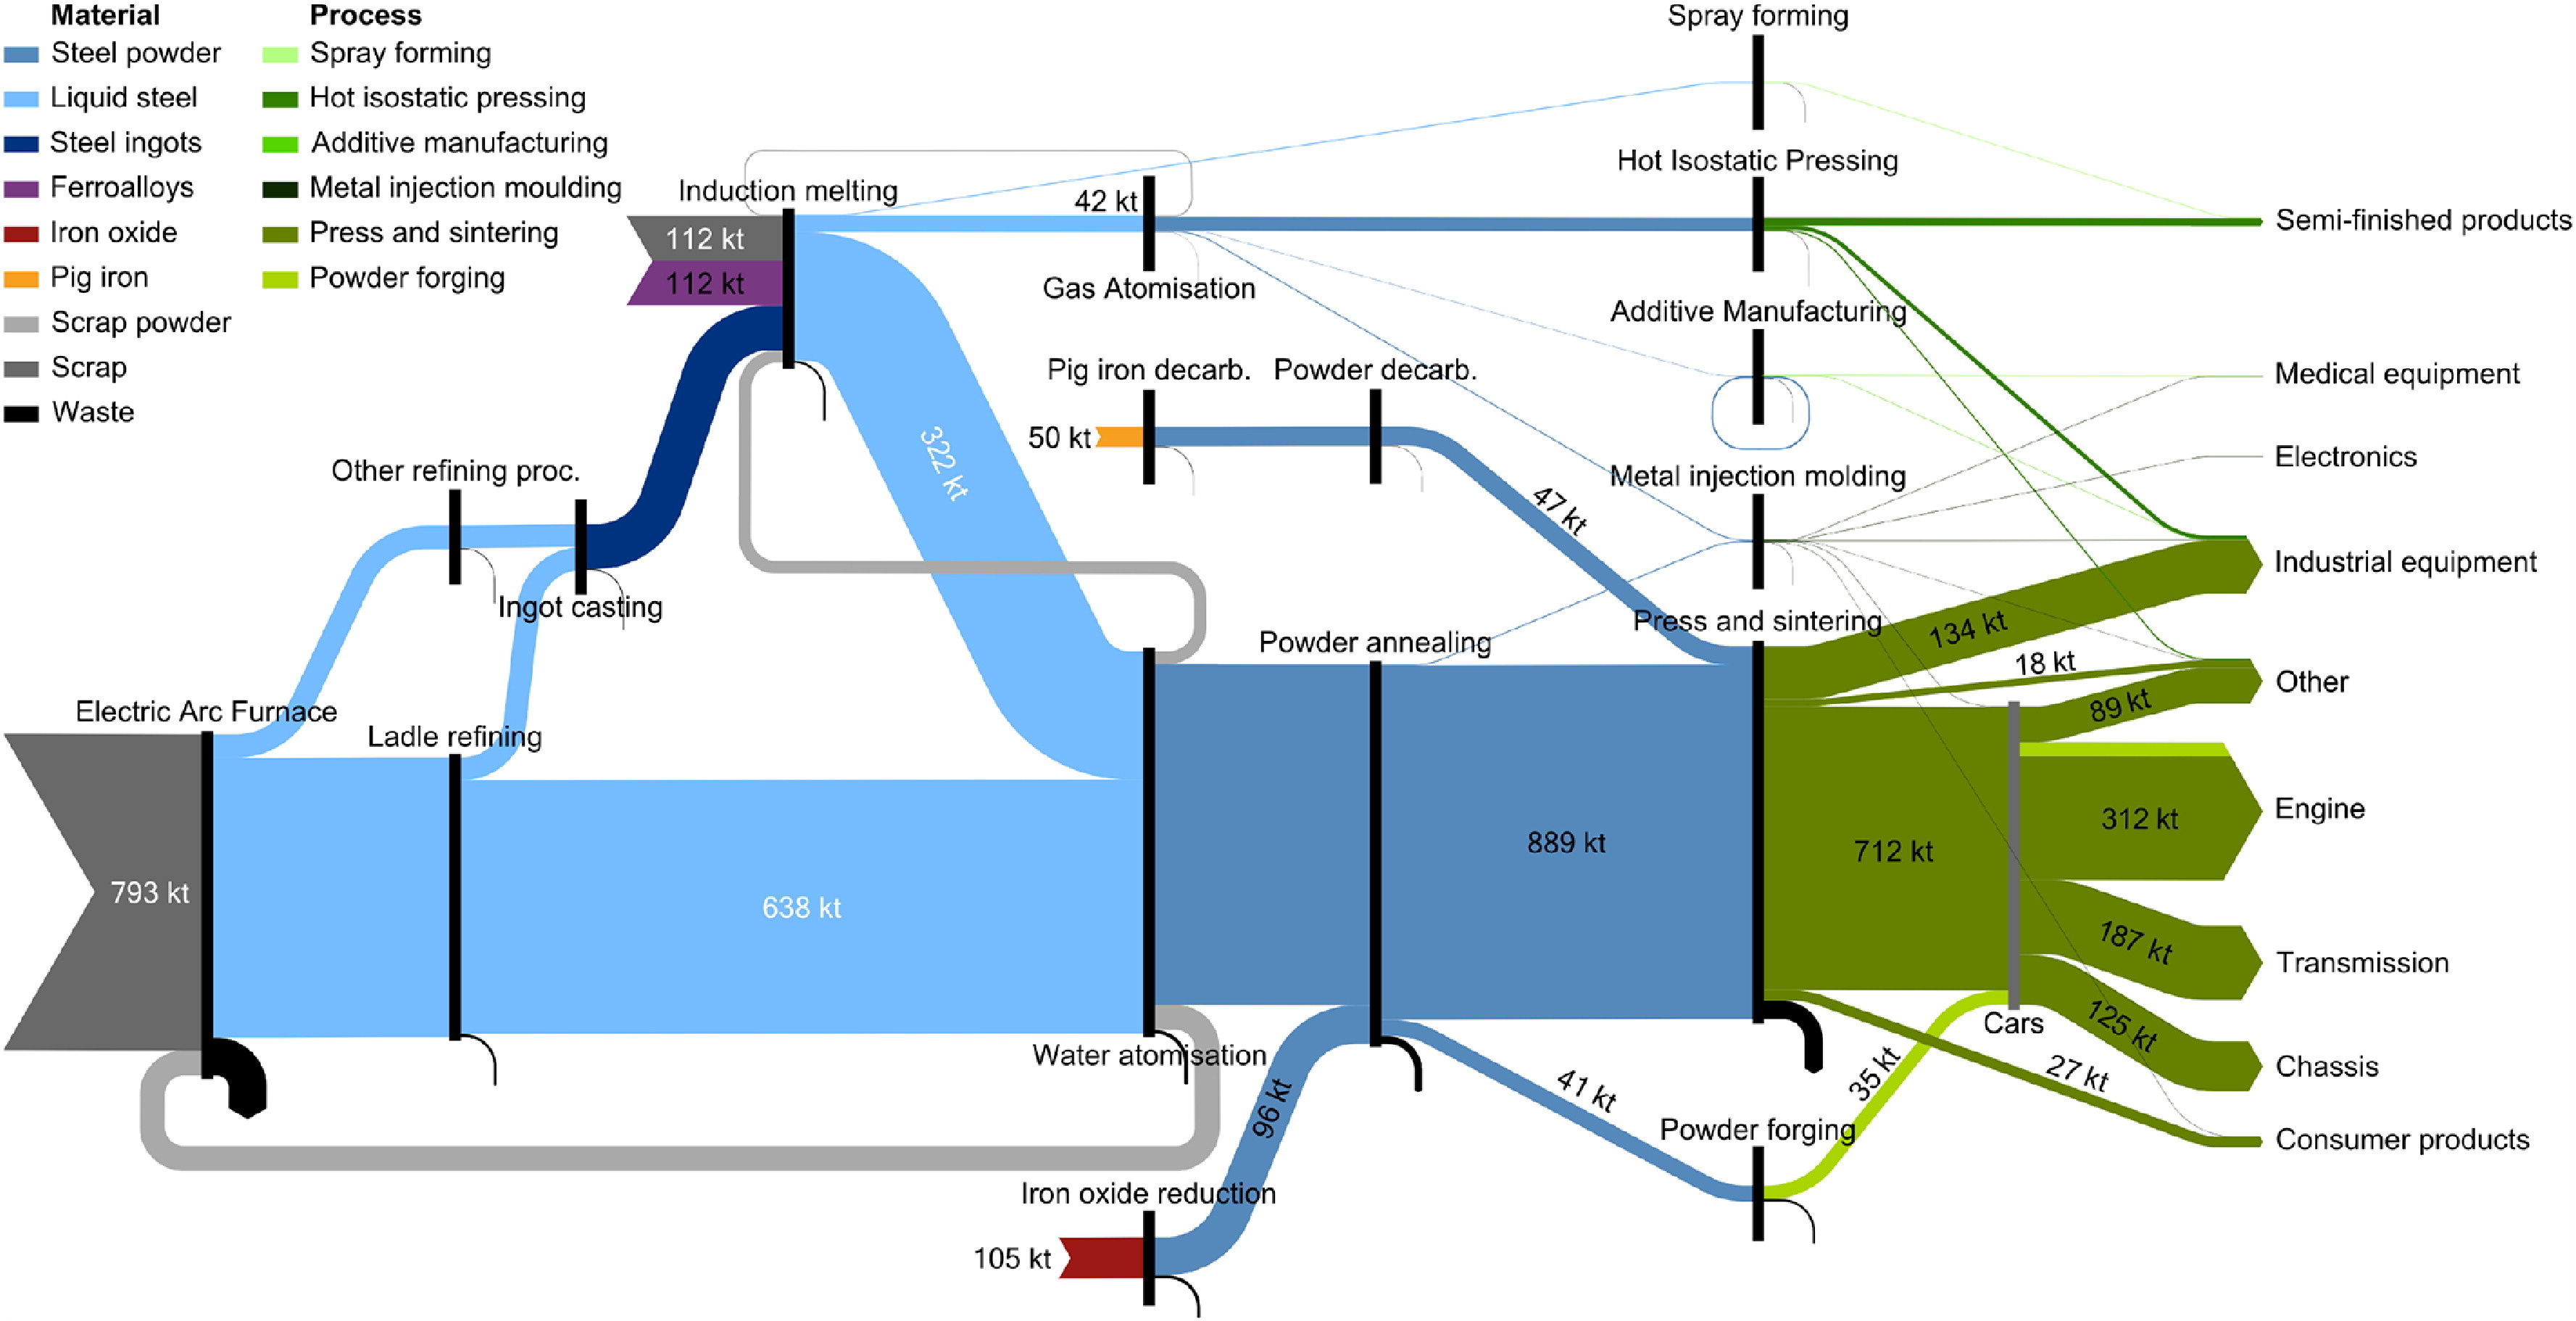
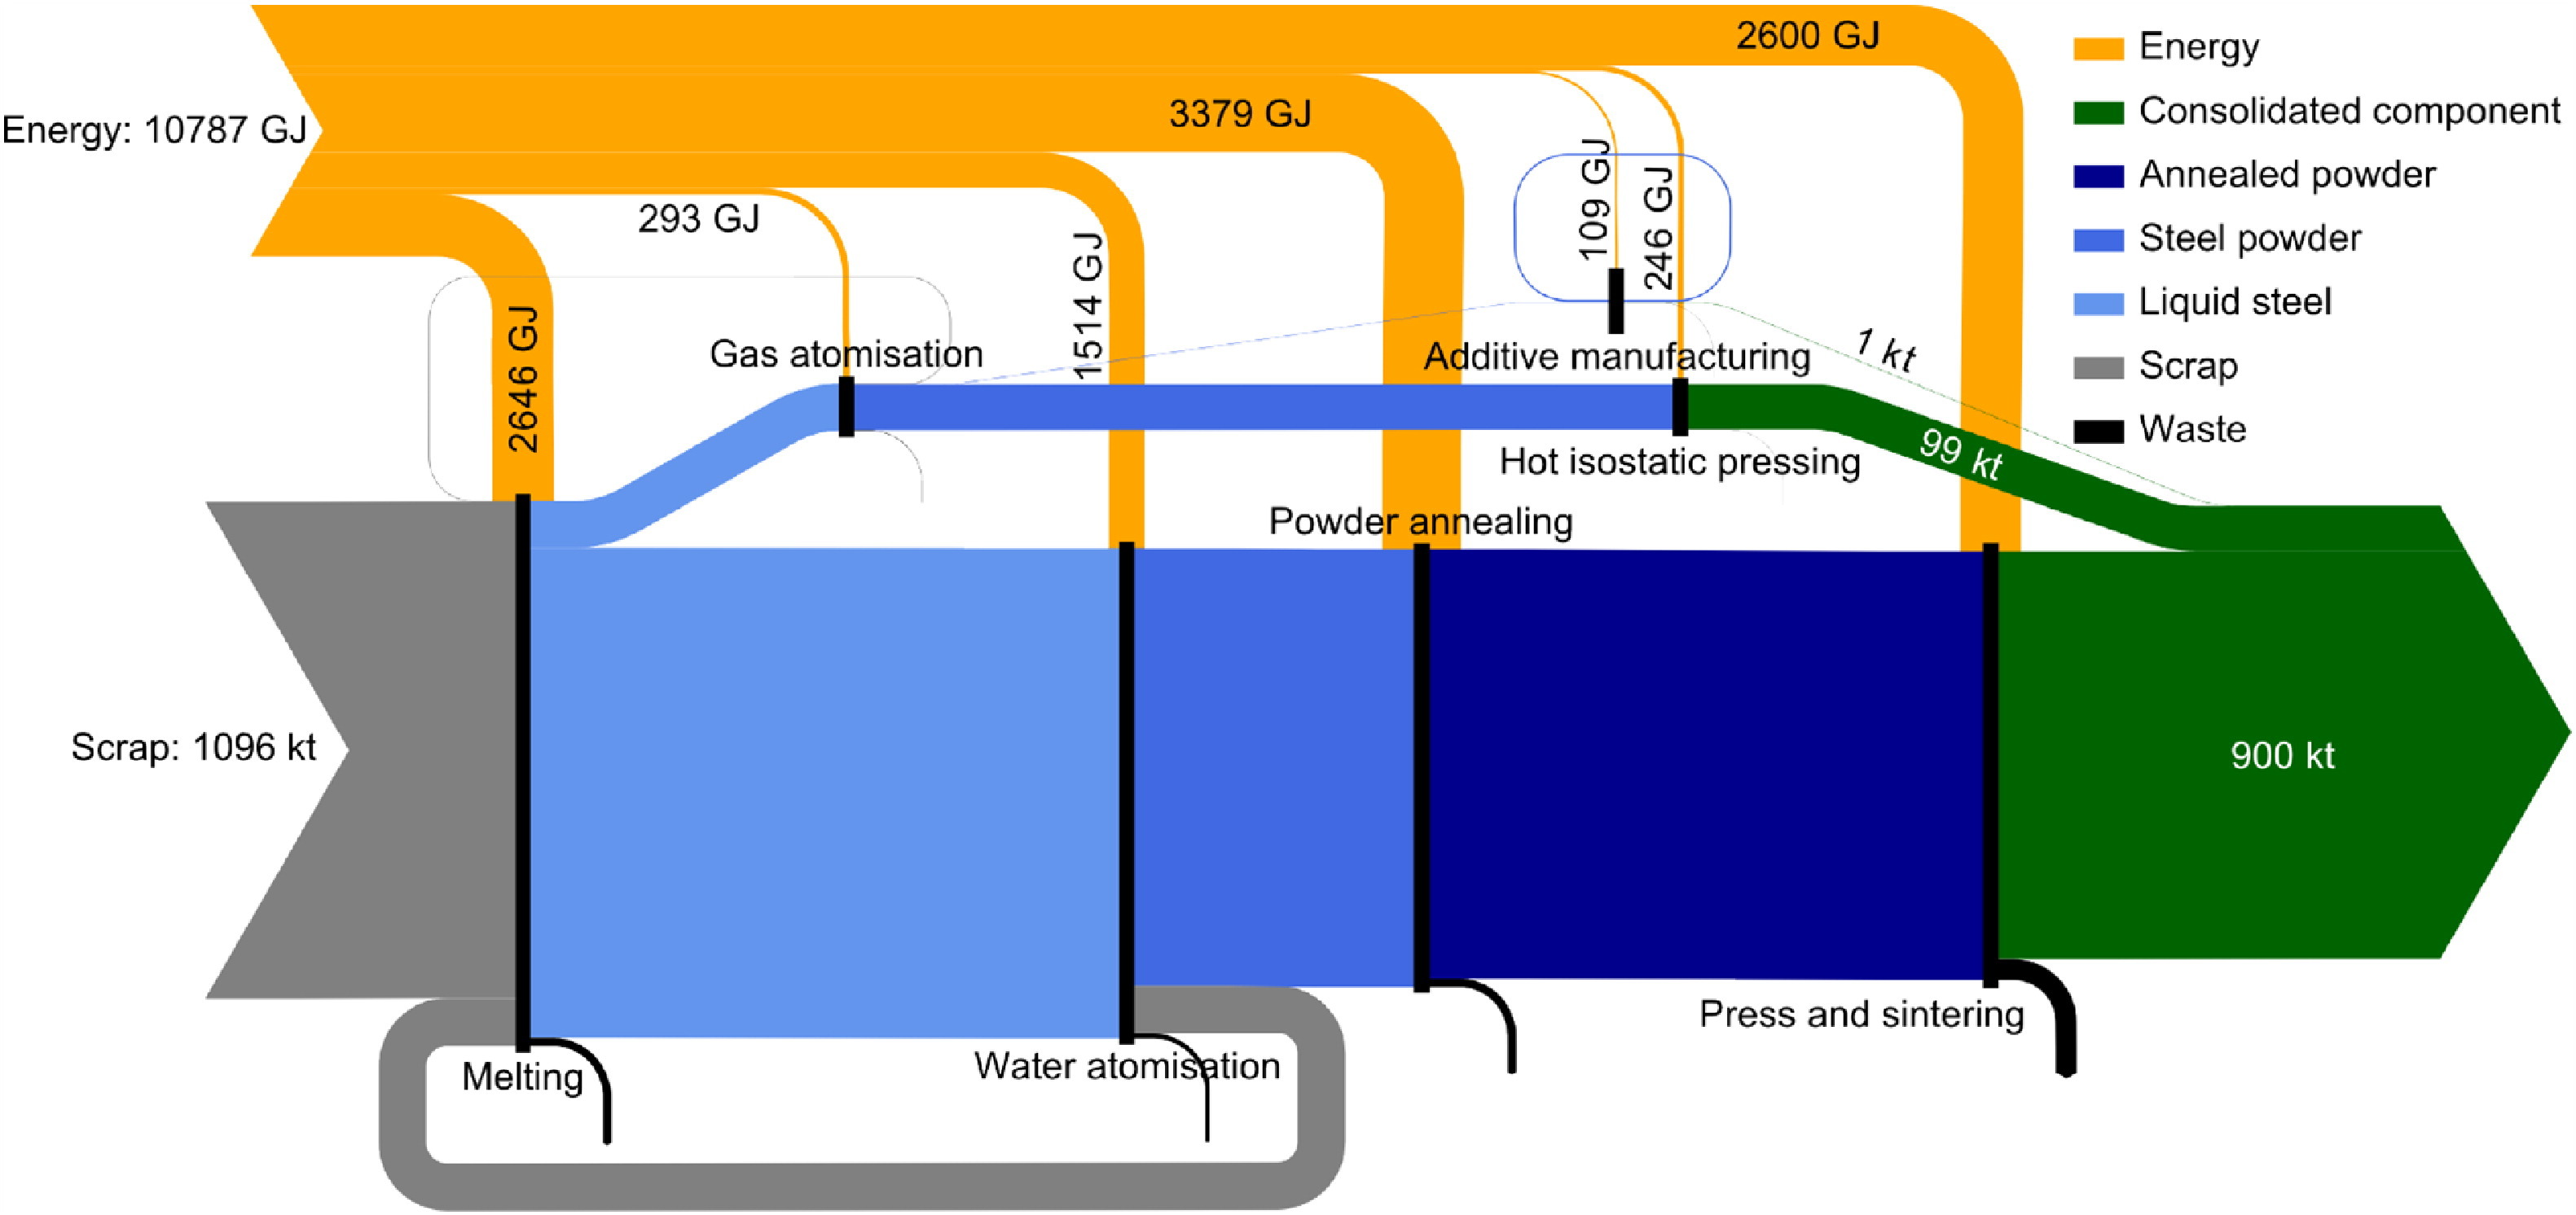
Figure 2 presents a map of the powder metallurgy production chain in the form of a Sankey diagram. The material flows from left to right, from steel-making up to final application. The major input is steel scrap that is converted into liquid steel using either the electric arc furnace or induction melting. This is mostly prompt scrap. Only pig iron decarburization and iron oxide reduction use inputs other than steel scrap. Most liquid steel is converted directly into powder without intermediate casting and re-melting operations. The powder-production processes are represented toward the center of the diagram. Steel powder can be distinguished by the shape of its particles, which may be spherical or irregular. Gas atomization is the only process that makes ferrous spherical powder in significant quantities. The shape of the particles is important because the different consolidation processes can only work with particular shapes. These processes are represented further to the right of the diagram. Press and sintering is the most significant and only uses irregular powder. The other consolidation processes mainly use spherical powder made by gas atomization. The main applications of powder metallurgy are shown at the right of the diagram. The biggest sector is the automotive industry which mainly uses press and sintering of water-atomized powder. The other production routes mostly use spherical particles whose mass output is an order of magnitude lower than irregular powder.
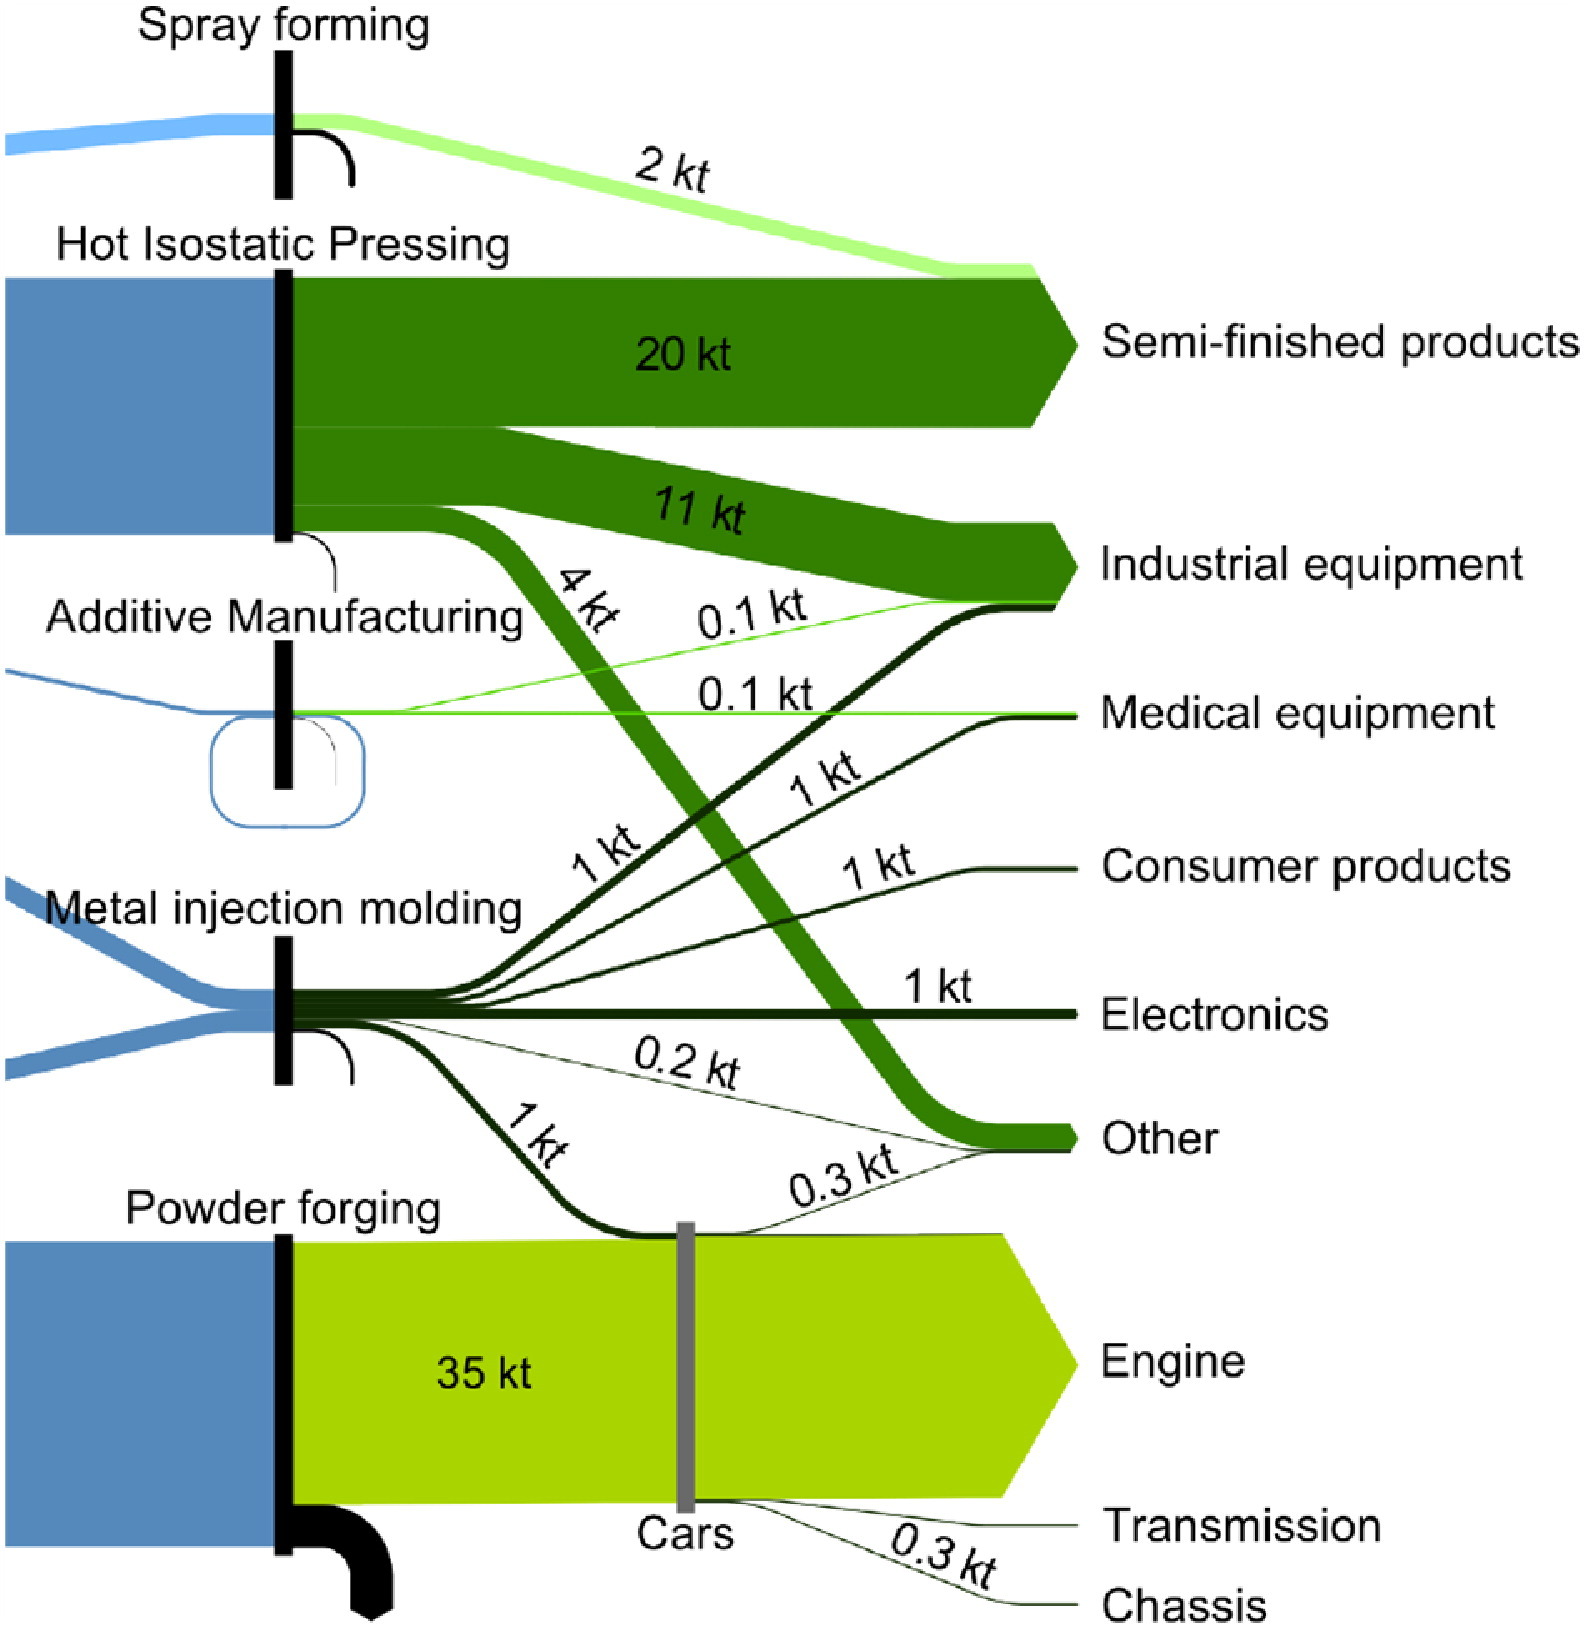
The flows of spherical powder are represented in more detail in Figure 3. Hot isostatic pressing is the biggest consumer of spherical powder and mostly makes feedstock for other processes, such as bars and billets. Additive manufacturing also uses spherical powder but has only a very small production output when compared with other processes. Metal-injection molding uses a mixture of spherical and irregular particles and its production is distributed through five major applications. Even though spherical powder is used in a smaller amount than irregular, it is used in a wider range of applications.
The energy intensity data of Table 2 was applied in Figure 4 to map the energy and material flows through the production chain. This figure shows how each process contributes to the energy consumption of the production chain. Material losses are a small portion of the total production. However, there is a loop of material in additive manufacturing that is wider than its total production. This is auxiliary material used to support and extract heat away from the workpiece. The figure also shows there are three major energy inputs in the production chain: steel melting, powder annealing, and sintering. The powder annealing and sintering processes consume at least the same amount of energy as material melting. These two processes use most of the energy supplied to the production chain.
4. Opportunities to reduce GHG emissions in PM
This section assesses how the results of this paper can be used to reduce the energy and material inputs of the whole production chain. The following paragraphs propose and evaluate a set of measures to achieve this. The section concludes with an assessment of the main limitations of this analysis and suggestions for future work.
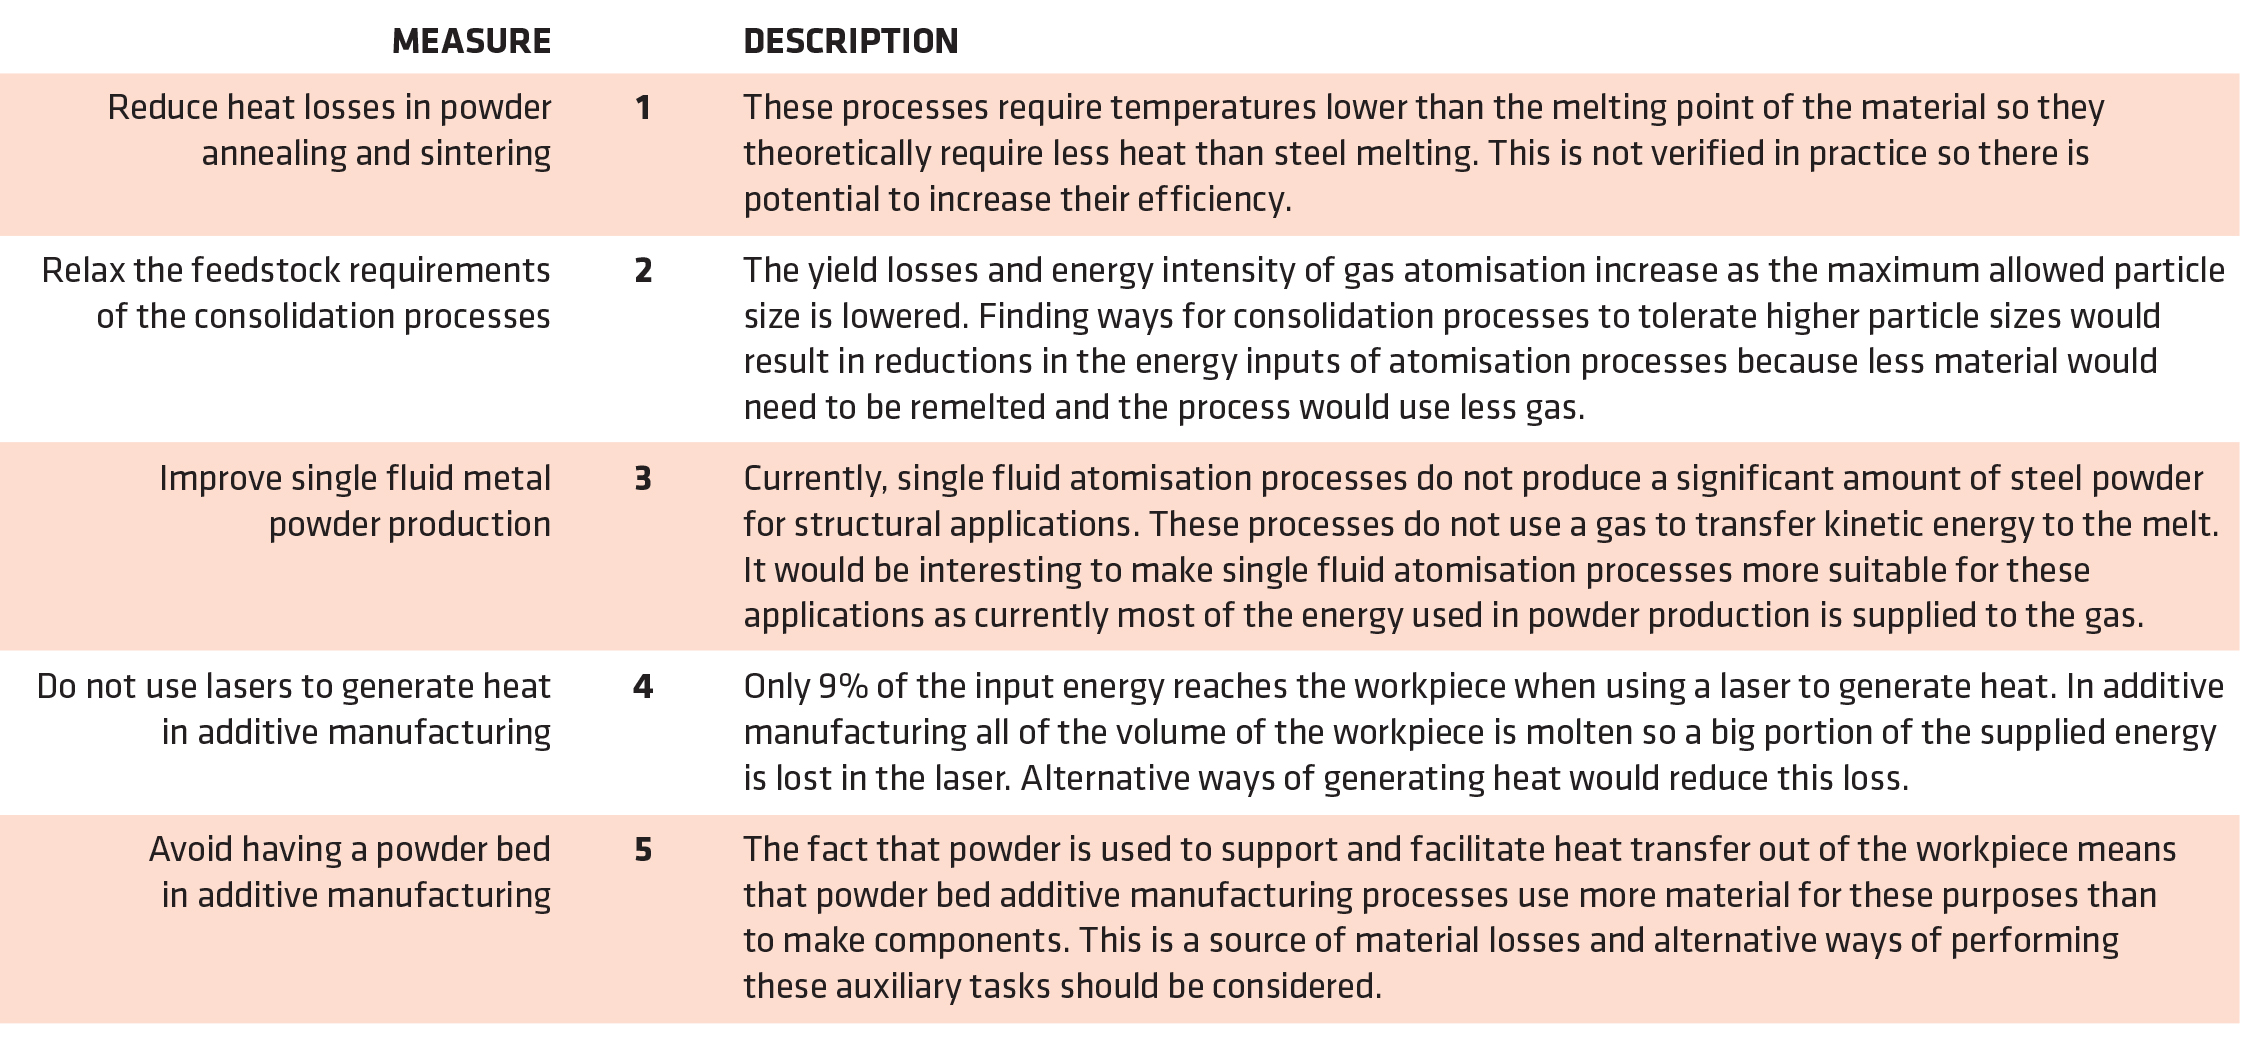
Most of the world’s steel powder is made by water atomization, consolidated using press, and sintering, and used in the automotive sector (Figure 2). The main material input of the production chain is steel scrap, which has a much lower embodied energy than virgin steel. However, this is prompt scrap which does not provide the benefit of recycling material from end of life products. The biggest energy inputs in this processing route are steel melting, powder annealing and sintering. These comprise three heat cycles with temperatures near the material melting point. Powder annealing and sintering have higher energy inputs than steel melting (Figure 4) but work at lower temperatures, so they could, in theory, consume less energy. Table 4 further illustrates the two processes are less efficient than induction melting. These differences in efficiency can be attributed to the fact that sintering and powder annealing require continuous furnaces whereas melting is done with batch furnaces. Continuous furnaces allow for higher productivity but have higher heat losses. Powder annealing requires continuous furnaces to maximize the area of powder that is in contact with the reducing gases. This facilitates the diffusion of the gases into the powder to reduce their carbon content and increase their compactibility. The efficiency of sintering is limited because the components cannot be densely packed due to their low strength after compaction. Powder annealing and sintering comprise heat cycles where steel is cooled to ambient temperature from temperatures above 1,000°C. Steel powder is compacted in between these two steps. An opportunity to reduce heat losses would be to compact the powder at a higher temperature. This would require a more integrated production chain and changes in tooling material.
Apart from powder annealing and sintering, the other significant energy input in the production of automotive components is powder compaction. The powder is typically compacted using hydraulic presses. These allow for the high levels of complexity obtained from powder metallurgy. However, the high pressure provided by the hydraulic systems is only required when the maximum force in being applied to the workpiece. Most of the time the hydraulic pressure is throttled off, this reduces the efficiency of the process to about 2 percent (Table 4). This efficiency could be improved with the use of electric presses that do not need to be throttled back in the same way as hydraulic presses do.
In addition to the technical constraints mentioned above, there may be economic causes for the low efficiency of powder sintering. The cost of energy represents 6.3 percent1 of the sales value of components made with press and sintering. Even though this is a significant portion, it is not a major component of the total sales value of components (compared with other cost components from Esper [17], such as labor and tooling). This means that most of the effort in maximizing profit in industry may have been applied to more significant contributors to the total cost as opposed to the reduction of energy consumption.
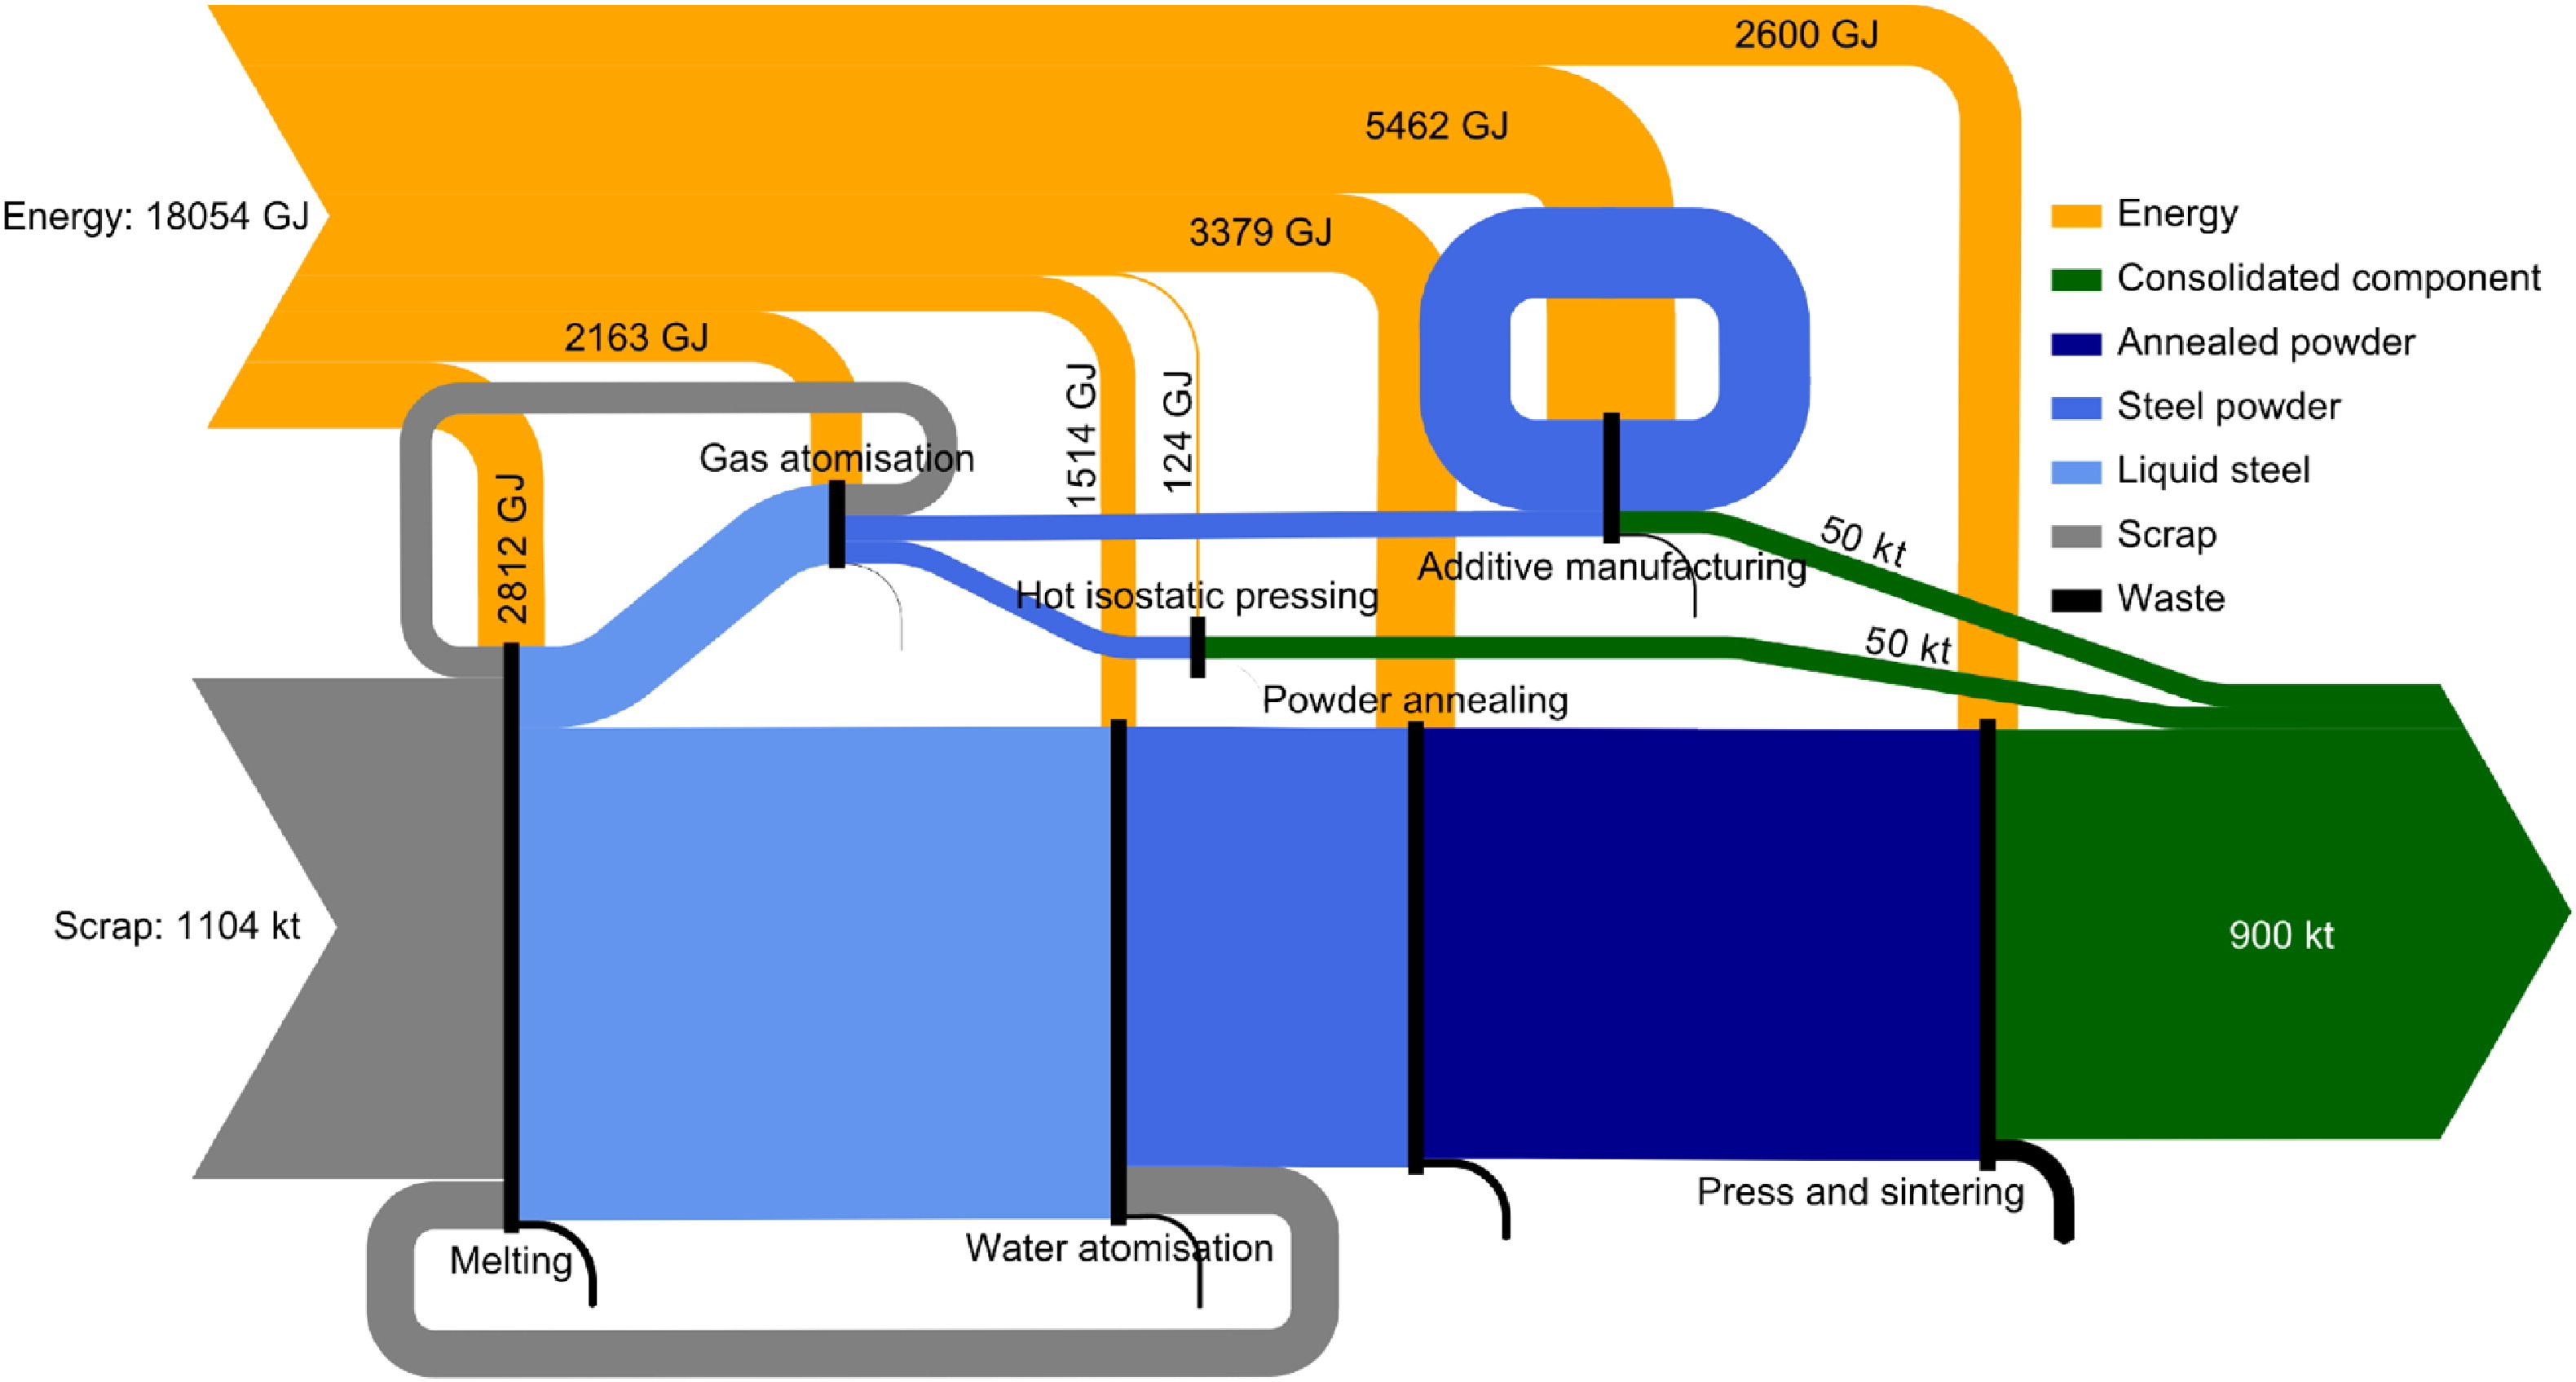
The energy and material efficiencies of gas atomization are dependent on the type of consolidation process for which powder is being atomized. Currently, this process seems to have minimal energy and material losses (Figure 4) because it is mostly making powder for hot isostatic pressing, which requires relatively large particles. The production of large particles requires less gas than smaller particles. If demand for additive manufacturing or metal injection molding increases, the resulting increase in gas atomization of smaller particles would require more energy and input material (this is illustrated by the contrast between Figures 4 and 5). This effect would be exacerbated by the fact that only part of each batch of atomized powder is small enough so the process yield would be reduced. The comparison of Figures 4 and 5 shows that the fraction of material sent for re-melting grows from negligible to approximately one third of the output of gas atomization. Additive manufacturing is a recent process whose feedstock requirements are not well established (as an example of this, ASTM International [18] provides standard specifications for additive manufacturing of stainless steel but does not specify which powder size ranges are acceptable). It may be possible to review the feedstock requirements to allow for more efficient use of spherical powder production.
As metal additive manufacturing is growing rapidly, a scenario where it has a significant production output is shown in Figure 5. If additive manufacturing had the same mass output as hot isostatic pressing, the energy inputs to the whole production chain could increase by 67 percent (Figures 4 and 5). Additionally, the energy inputs of gas atomization would increase by nearly an order of magnitude. Alternative atomization methods for spherical powder could be considered in conjunction with relaxing the feedstock requirements of consolidation processes. For example, centrifugal atomization, which does not require energy intensive gas, might be used to make spherical powder.
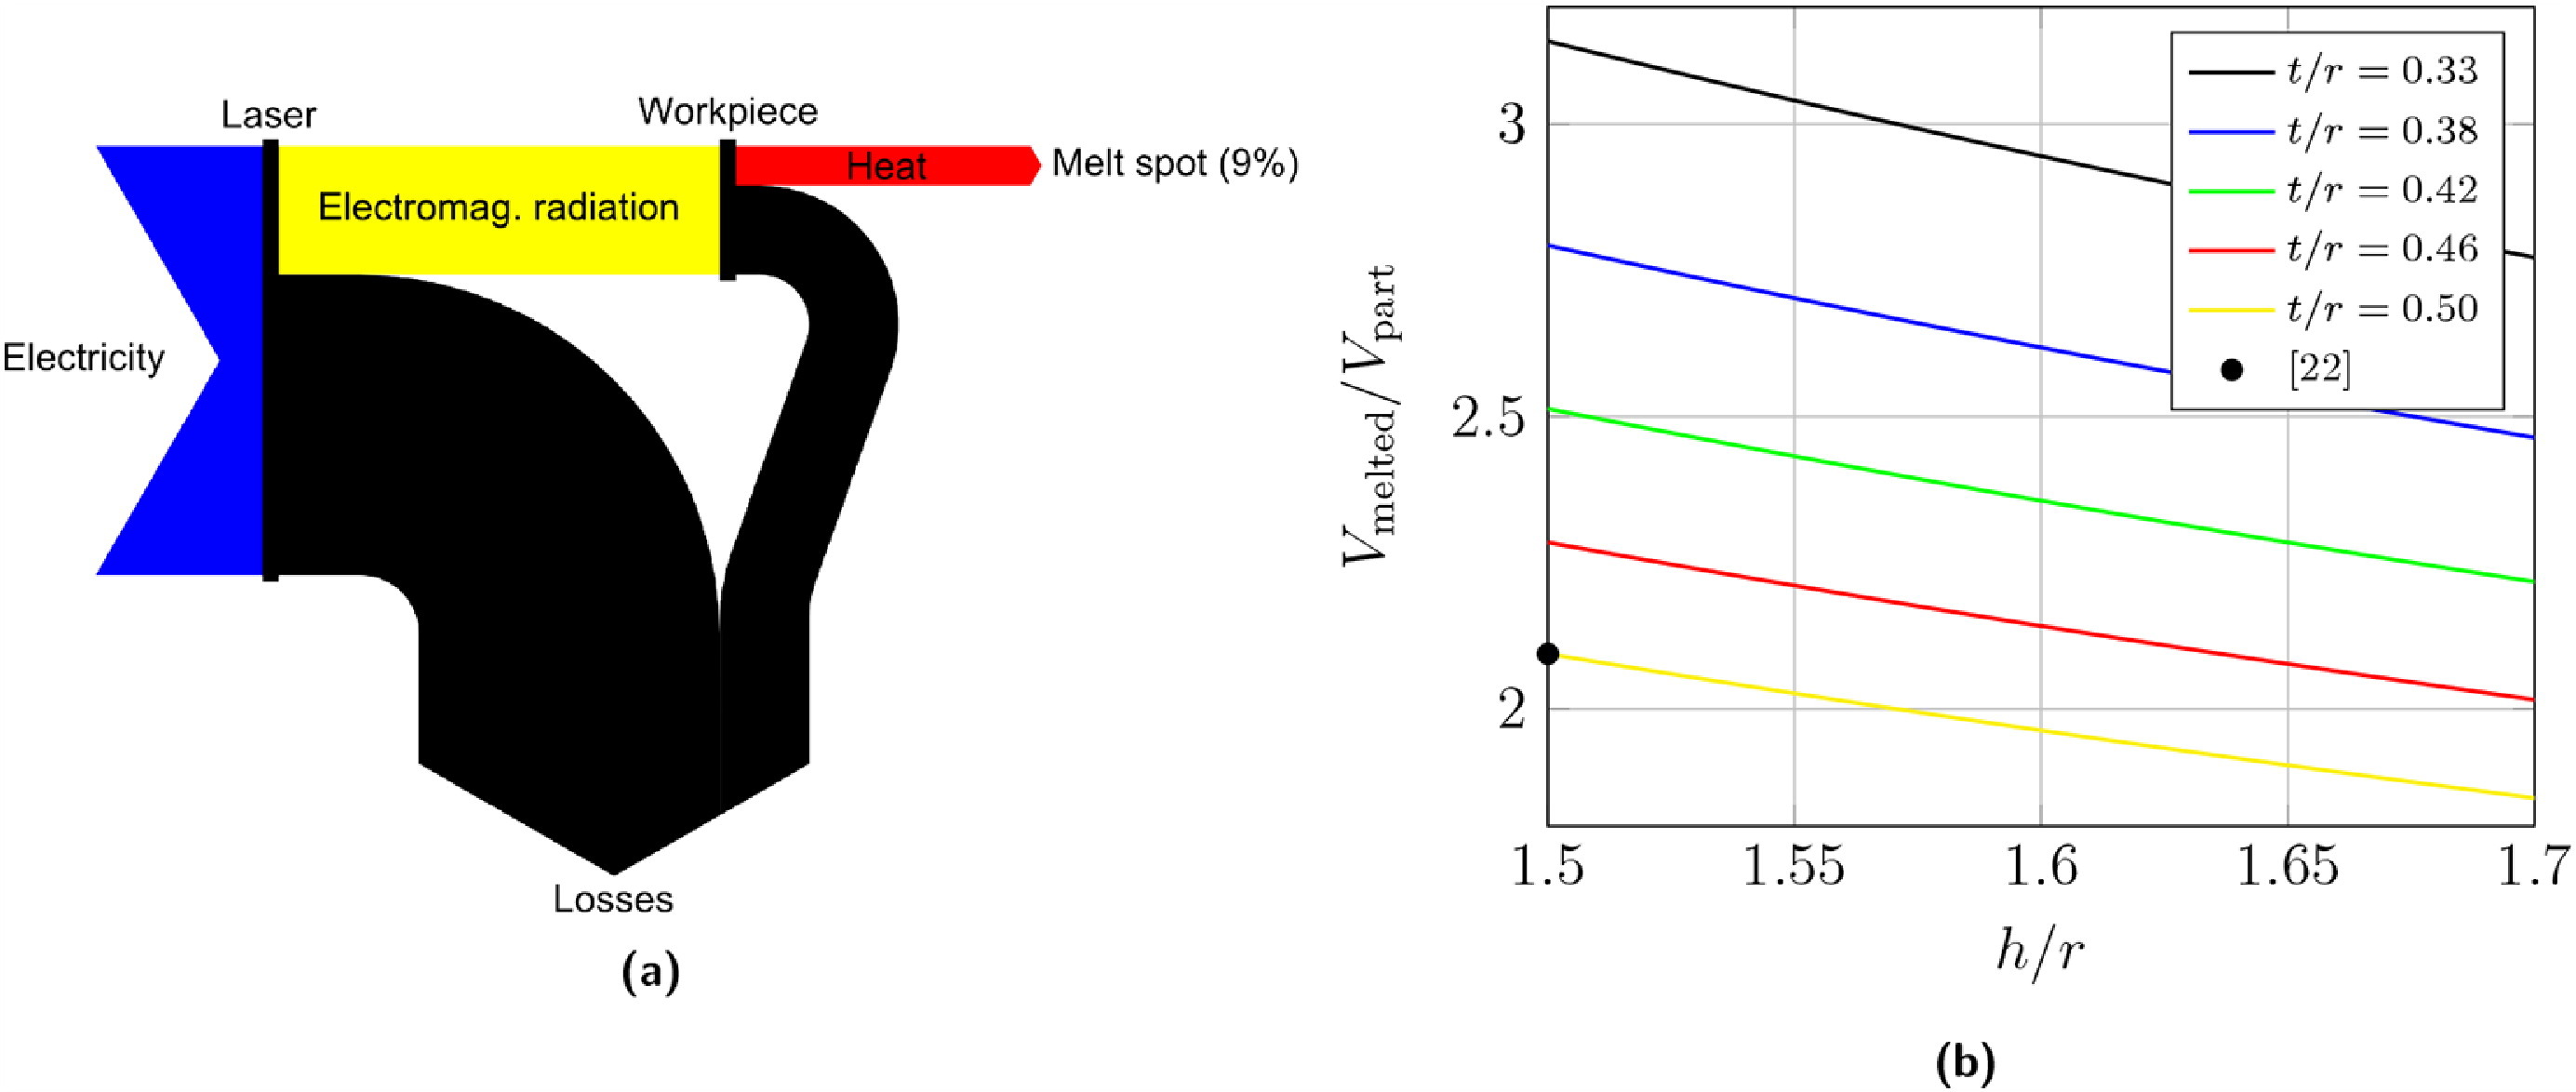
Metal additive manufacturing is still in an early stage of development with only 1.3 percent energy efficiency (Table 4), so it may not be optimized yet. As a laser is used to generate the required heat, only 9 percent of the energy supplied to the machine actually reaches the workpiece (Figure 6a). Figure 6b shows the ratio of the volume of melted material to the volume of the final component in laser powder-bed additive manufacturing, the most significant type of metal additive manufacturing according to Wohlers and Associates [3]. This ratio depends on the process parameters, but typically nearly twice the volume of the final component is melted. The use of a laser and this excess melting account for a difference factor of 20 between the theoretical minimum and the actual energy consumption of metal additive manufacturing today. Figure 6 can therefore be a driver for developing improved energy and material efficiency. For example, the inefficiencies of having a laser and material re-melting can be avoided by using the binder jetting process (this process is explained by Tang et al. [19]). Powder-bed processes have two main types of material losses: the material lost due to the powder being reused multiple times and the material required to build the supporting structures. The amount of material used in supporting structures is highly dependent on component geometry. The powder lost between reuse cycles can become significant if the mass of unused powder is higher than the mass of components. Furthermore, not all applications allow for all the powder to be reused. Material losses caused by having a powder bed can be avoided by using blown powder processes (reviewed by Thompson et al. [20]), which deposit the powder at the same time as it is being melted. These also have material losses because not all the powder reaches the melt pool, but the process only uses the material incorporated into the workpiece. These opportunities are important while additive manufacturing is still in an early stage of implementation in order to constrain the energy consumption increase that could result if demand expands significantly.
The previous discussion resulted in the definition of five measures to reduce energy and material inputs in powder metallurgy. These are summarized in Table 5. Technological changes are needed to implement them, but the previous paragraphs and Section 3 show there is significant margin for improvement. Industry practitioners have always tried to maximize their profits; this includes trying to minimize energy and material consumption. The information presented here can be used to guide them when implementing measures to further reduce emissions. The map of the powder metallurgy production chain provides a basis to evaluate these measures, and the energy efficiency data helps to quantify potential reductions.
The data used to obtain the results of Section 3 is not perfect, so there is a degree of uncertainty. The data from Figure 2 is not all from the same year. Even though there were no major variations across different years (as described in the supporting information), assumptions were required in order to reconcile the various material flows. Energy inputs were also estimated for some processes. These values were validated by industry experts to ensure the orders of magnitude are correct. Furthermore, most of the energy intensities used in this work were obtained assuming the equipment was operating at full capacity. Kruzhanov and Arnhold [6] had access to data from real press and sintering factories and verified that energy intensity is sensitive to capacity utilization, and underutilized operations tend to consume more energy. This paper attempts to reduce energy and material consumption at an absolute level so the best-case scenario has always been used as a starting point. Due to data uncertainty and assumptions, decisions should rely only on the orders of magnitudes of flows and not on their exact values. The measures proposed in Table 5 are general and qualitative, so they are probably valid regardless of their uncertainties. There are other environmental impacts from powder metallurgy besides GHG from energy production. Two examples are the extensive use of water in water atomization or the negative effects of small particles on the human body (as reported by Brunekreef and Forsberg [21]). These effects were not considered in this work but could potentially contribute to extend the list of measures summarized in Table 5.
The work presented in this paper could be extended further to consider the use-phase and end of life of products made with powder metallurgy. This group of processes provides opportunities to produce components with improved mechanical properties and with more complex geometries. These opportunities allow for the production of more efficient products that could have a lower energy consumption in the use-phase.
Acknowledgments
The authors are thankful for the help and support of Peter Hodgson and Christopher Philips from Tata Steel and Gill Thornton from Liberty Speciality Steels. A.C.S. and J.M.A. were supported by EPSRC, grant reference no. EP/N02351X/1.
Appendix A. Supplementary data
Supplementary data to this article can be found online at doi.org/10.1016/j.powtec.2018.01.009.
1Estimated according to P = (SECPSreal × CE)/CPS = 6.3 percent, where SECPSreal is the specific energy consumption of press and sintering [14], CE is the average cost of electricity in Europe in 2015 [15] and CPS is the average sale value of components made in Europe with press and sintering, per kilogram, estimated from European Powder Metallurgy Association [16].
References
- J. Hansen, M. Sato, R. Ruedy, K. Lo, D.W. Lea, M. Medina-Elizade, Global temperature change, Proc. Natl. Acad. Sci. 103 (39) (2006) 14288–14293.
- J.M. Allwood, J.M. Cullen, M.A. Carruth, D.R. Cooper, M. McBrien, R.L. Milford, M.C. Moynihan, A.C. Patel, Sustainable Materials with Both Eyes Open, Without the Hot Air Series UIT Cambridge Limited. 2012.ISBN 9781906860059.
- T.T. Wohlers, Wohlers Associates, Wohlers Report 2015: Additive Manufacturing and 3D Printing State of the Industry: Annual Worldwide Progress Report, Wohlers Associates. 2015.
- B. Williams, Powder Metallurgy: A Global Market Review, International Powder Metallurgy Directory and Yearbook, Inovar Communications Ltd. 2012, pp. 5–25.
- G.F. Bocchini, Energy requirements of structural components: powder metallurgy v. other production processes, Powder Metall. 26 (2) (1983) 101–113.
- V. Kruzhanov, V. Arnhold, Energy consumption in powder metallurgical manufacturing, Powder Metall. 55 (1) (2012) 14–21.
- R. Huang, M. Riddle, D. Graziano, J. Warren, S. Das, S. Nimbalkar, J. Cresko, E. Masanet, Energy and emissions saving potential of additive manufacturing: the case of lightweight aircraft components, J. Clean. Prod. 135 (2015) 1559–1570.
- J. Faludi, M. Baumers, I. Maskery, R. Hague, Environmental impacts of selective laser melting: do printer, powder, or power dominate? J. Ind. Ecol. 21 (2015) S144–S156.
- J.M. Cullen, J.M. Allwood, M.D. Bambach, Mapping the global flow of steel: from steelmaking to end-use goods, Environ. Sci. Technol. 46 (24) (2012) 13048–13055.
- A.B. Höganäs, Höganäs Handbook for Sintered Components, Höganäs. 2013.
- J.J. Dunkley, D. Aderhold, D. Millington-Smith, A.J. Yule, Atomization for Metal Powders — Notes to Accompany a Short Course, 2016.
- R.M. German, Powder Metallurgy and Particulate Materials Processing: The Processes, Materials, Products, Properties and Applications, Metal Powder Industries Federation. 2005.ISBN 9780976205715.
- J.J. Dunkley, Hot gas atomisation-economic and engineering aspects, Adv. Powder Metall. Part. Mater. 1 (2005) 2.
- G.K.N. plc, GKN Plc Annual Report and Accounts 2009, 2009.
- Eurostat, Energy Statistics — Prices of Natural Gas and Electricity, 2015, http:// ec.europa.eu/eurostat/web/energy/data/database. accessed: 2017-10-10.
- European Powder Metallurgy Association, EPMA Key Powder Metallurgy Figures 2012, 2012, https://www.epma.com/558-epma-key-figures-2012/. accessed: 2017-05-19.
- F.J. Esper, Pulvermetallurgie: Das Flexible Und Fortschrittliche Verfahren Für Wirtschaftliche Und Zuverlässige Bauteile; Mit 15 Tabellen, Kontakt & Studium, Expert-Verlag. 1996.ISBN 9783816913214.
- ASTM International, ASTM F3184-16 — Standard Specification for Additive Manufacturing Stainless Steel Alloy (UNS s31603) with Powder Bed Fusion, Standard, 2016.
- Y. Tang, Y. Zhou, T. Hoff, M. Garon, Y.F. Zhao, Elastic modulus of 316 stainless steel lattice structure fabricated via binder jetting process, Mater. Sci. Technol. 32 (7) (2016) 648–656.
- S.M. Thompson, L. Bian, N. Shamsaei, A. Yadollahi, An overview of direct laser deposition for additive manufacturing; part I: transport phenomena, modeling and diagnostics, Addit. Manuf. 8 (2015) 36–62.
- B. Brunekreef, B. Forsberg, Epidemiological evidence of effects of coarse airborne particles on health, Eur. Respir. J. 26 (2) (2005) 309–318.
- W. Shifeng, L. Shuai, W. Qingsong, C. Yan, Z. Sheng, S. Yusheng, Effect of molten pool boundaries on the mechanical properties of selective laser melting parts, J. Mater. Process. Technol. 214 (11) (2014) 2660–2667.
- K. Kellens, E. Yasa, W. Dewulf, J. Duflou, Environmental Assessment of Selective Laser Melting and Selective Laser Sintering, Going Green-CARE INNOVATION 2010: From Legal Compliance to Energy-efficient Products and Services, 2010.
- M. Baumers, C. Tuck, R. Hague, I. Ashcroft, R. Wildman, A Comparative Study of Metallic Additive Manufacturing Power Consumption, Solid Freeform Fabrication Symposium Proceeding, the University of Texas at Austin, USA, 2010, pp. 278–288.
- M. Baumers, C. Tuck, R. Wildman, I. Ashcroft, E. Rosamond, R. Hague, Transparency built-in, J. Ind. Ecol. 17 (3) (2013) 418–431.
- S.M. Kaufman, Energy consumption in the manufacture of precision metal parts from iron powder, Technical report, SAE Technical Paper. 1980.
- V. Kruzhanov, V. Arnhold, Energy Consumption in Iron Powder Production: Annealing of Water Atomized Powder, Proceedings of the World PM2016 Congress & Exhibition, European Powder Metallurgy Association. 2016,
- EPRI Center for Materials Production, Industry Segment Profile sic 33991, 2000.
- E. Ernst, Energy balance of a belt sinter furnace, Powder Metall. 56 (2) (2013) 96–101.
- G. Zapf, K. Dalal, Raw material and energy conservation in production of sintered PM parts, Powder Metall. 26 (4) (1983) 207–216.
- C.-J. Rick, M. Engholm, K. Beskow, Increased Stainless Steel Melt Shop Yield by Improved Converter Tap Weight Management, The 6Th European Oxygen Steelmaking Conference, 2011.
- A.J. Yule, J.J. Dunkley, Atomization of Melts for Powder Production and Spray Deposition, Oxford University Press, USA. 1994.
- ASM International, ASM Handbook: Metalworking and Bulk Forming. Volume 14A, Number v. 11; v. 14, ASM Handbook ASM International. 1991.ISBN 9780871707086.
- R. Brindle, PM2 Industry Vision and Technology Roadmap, 2001.
- A. Leatham, Spray forming: alloys, products and markets, Met. Powder Rep. 54 (5) (1999) 28–37.
- R.J. Fruehan, O. Fortini, H.W. Paxton, R. Brindle, Theoretical minimum energies to produce steel, Report to the US Department of Energy, Office of Industrial Technologies, Washington, DC, 2000.
- M. Noro, R.M. Lazzarin, Energy audit experiences in foundries, Int. J. Energy Environ. Eng. (2014) 1–15.
About the authors
José M.C. Azevedo, André Cabrera Serrenho, and Julian M. Allwood are with the Department of Engineering, University of Cambridge, Trumpington Street, Cambridge CB2 1PZ, U.K.
This article is © 2018 The Authors and was originally published by Elsevier B.V. This is an open-access article under the CC BY license (creativecommons.org/licenses/by/4.0/). The article was edited to conform to the style of Thermal Processing magazine. The original article is available at: www.sciencedirect.com/science/article/pii/S0032591018300093#!


 general practice for CQI-9 and AMS2750E")


