


Carburizing is typically done with a target of 0.80-0.90% carbon at the surface of the part. What is the effect if the carbon level is moved above or below this range?
In this article, we will examine the effect of surface carbon content — or the carbon potential during carburizing — on the performance of both actual gears and test bars. This work was done in the late 1990s and presented at the 2009 ASM Heat Treat Conference [1]. Six separate batches of components were gas carburized and oil quenched, each at a different carbon potential. The temperature used was 927°C (1,700°F), and the time was 5.5 hours, which normally provides an effective case depth of about 0.89 mm (0.035”) at 0.80% carbon. Rather than use the traditional boost diffuse carburizing cycle, the carbon potential was held constant during the entire cycle, and the parts were quenched directly from the carburizing temperature. The carbon potential set point for each of the six cycles was 0.2%, 0.4%, 0.6%, 0.8%, 1.0%, and 1.2%. After carburizing, all parts were tempered at 177°C (350°F) for 1.5 hours.
U-Notch Test Bars
The parts carburized in each batch consisted of 248 mm diameter hypoid ring gears and mating pinions, along with net formed differential gears for a 198 mm axle. Also included were U-Notch test bars, which are used to evaluate gear materials and processes. The hypoid gear sets were made from SAE 8620 steel, while the differential gears were made from a modified grade of SAE 8620 with higher hardenability. The U-Notch bars were made from SAE 8620, SAE 4320, and SAE 9310 steel. The ring and pinion sets and differential gears were dynamometer tested, and the differential gears were also impact tested. The U-Notch test bars were evaluated in three-point bending under slow bend, impact, and fatigue.

Figure 1 shows the dimensions and loading conditions for the U-Notch bars. The bar is an oversized Charpy bar with a radius machined in it instead of a V-Notch. The bar was originally created to simulate differential gears in a 226 mm rear axle when changing to a premium steel resulted in a decrease in actual vehicle impact life. The bar is 12.7 mm (0.500”) square, and the radius is 2.25 mm (0.090”). The bar was loaded in three-point bending for all tests with 50.8 mm (2.000”) between supports.
The actual surface carbon of each furnace load was measured, and, in some cases, the final carbon content was different from the set point. The values were spectrographically measured after lightly sanding the surface and ensuring there was agreement with appropriate standards. The 0.2% load measured 0.42%, and the 0.4% load measured 0.58%. The 0.6% and 0.8% loads were close to the set points at 0.65% and 0.81% respectively. At the high end, the 1.0% and 1.2% loads measured 0.95% and 0.90% respectively.
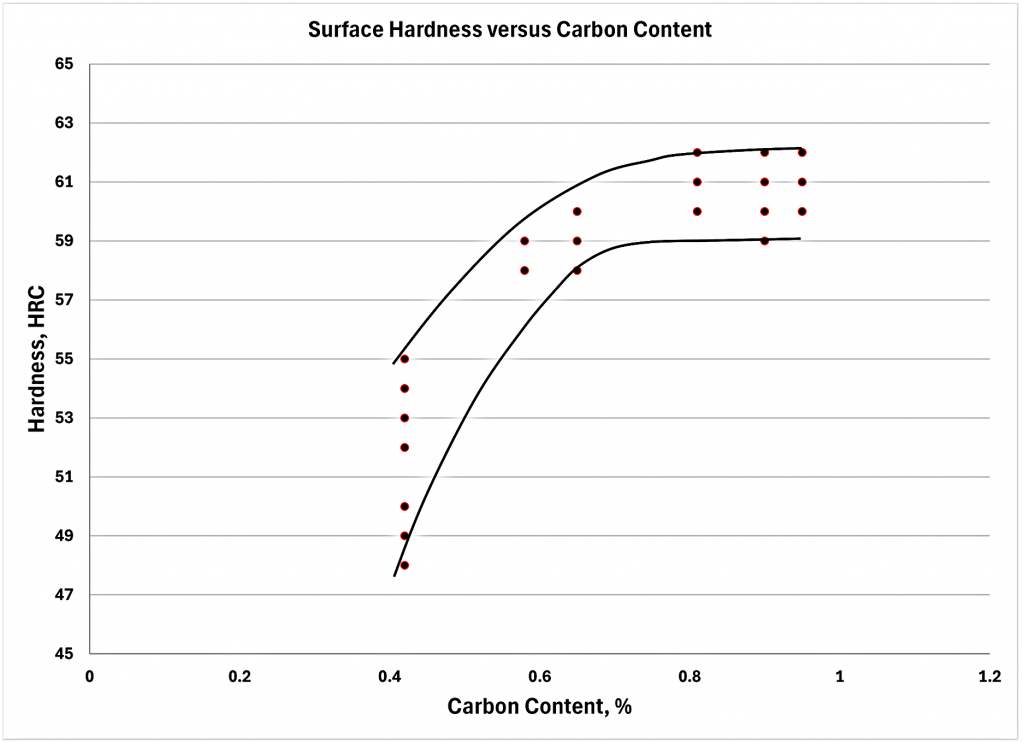
Figure 2 shows the surface hardness vs. carbon content for the SAE 8620 ring gears. As expected, the surface hardness increases with carbon content and appears to level off above 0.65% carbon. Once the carbon content is above 0.65%, there is no appreciable difference in the hardness for SAE 8620 steel.
Fatigue test on hypoid gear sets
Figure 3 shows the fatigue data for the SAE 8620 hypoid gear sets. This test was run on a dynamometer at constant torque and constant speed. The expected failure mode is bending fatigue at the tooth root. The data clearly shows a significant increase in fatigue life as the carbon content decreases. The Weibull B50 life for the 0.42% carbon is double the life for the 0.95% carbon. As the carbon content increases, the fatigue life decreases in a linear fashion. At 0.90-0.95% carbon, the life appears to be constant. The failure mode was bending fatigue for all samples except for the 0.42% carbon level. Here the failure mode changed to pitting and spalling.
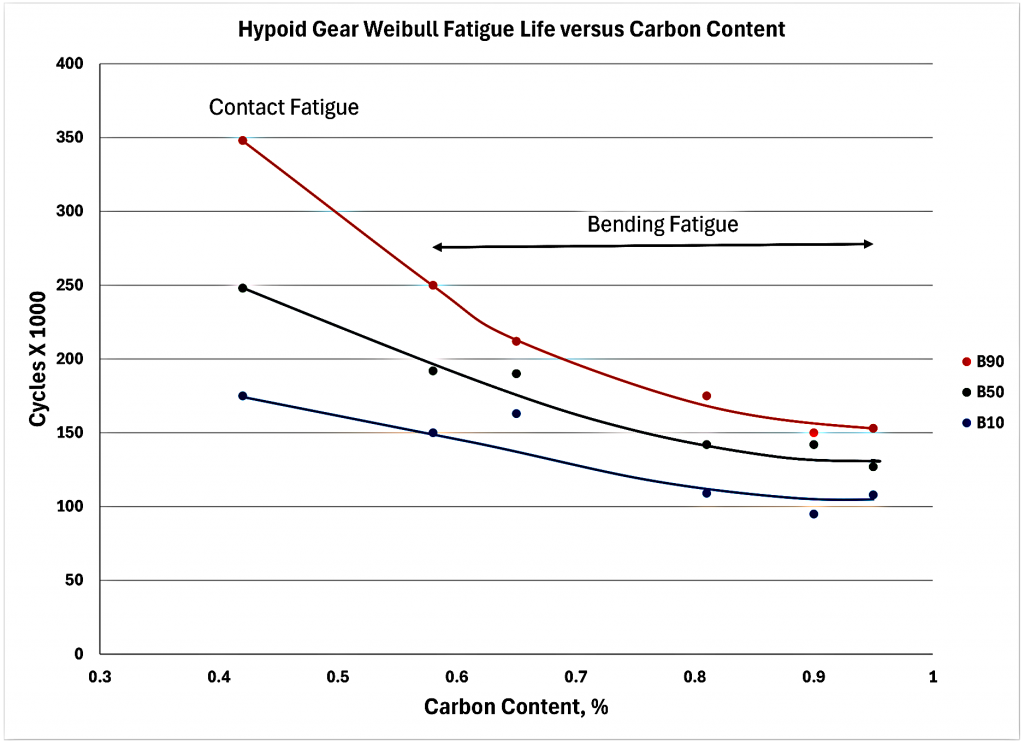
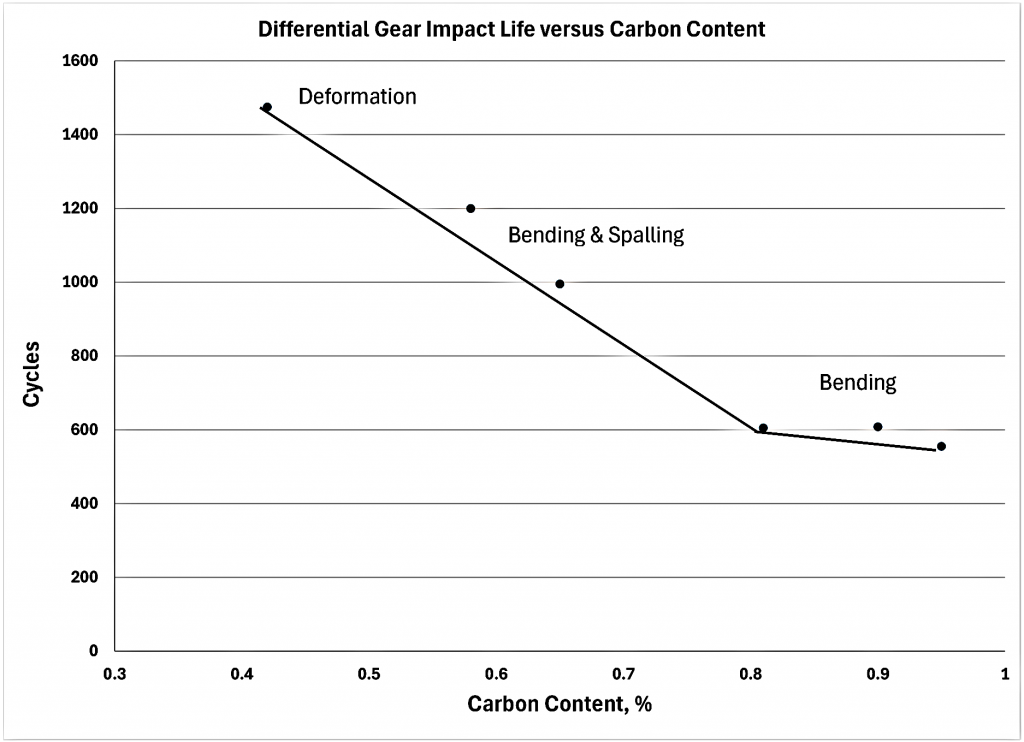
Figure 4 shows the differential gear impact life vs. carbon content. In this test, a large input torque is repeatedly applied to the axle assembly until failure occurs. The expected failure mode is either bending at the tooth root and/or spalling of the tooth face. As in Figure 3, the life significantly increases as the carbon level decreases. The impact life for the 0.42% carbon level is approximately two and a half times that of the 0.80-0.90% carbon levels. Three separate failure modes were observed with this impact test. At the higher carbon levels, the failure was low cycle bending fatigue at the tooth root. At the intermediate carbon levels, the failure mode was a combination of bending and spalling fatigue. At the lowest carbon level, the failure mode was case crushing and tooth deformation.
Most gears are precision machined components with tight tolerances, and it is desirable to avoid any geometry changes even under impact or fatigue if possible. However, the area under the elastic portion of the stress strain curve is limited, and some plastic deformation may be necessary to absorb increasing amounts of energy. The termination point for impact tests is typically broken teeth or the loss of ability to transmit torque. A softer differential gear may perform well under impact testing by deforming and absorbing energy. However, the gear may deform long before the typical test termination point is reached and cause excess backlash leading to warranty issues in the field. Differential gears need to not only withstand impact loads but lower torque, longer term, everyday loads as well.
Differential gear fatigue test
Figure 5 shows the data for the differential gear fatigue test. In this test the differential side gears slowly rotate at 20 rpm relative to one another while under torque. This is a low cycle fatigue test run at lower torque than the impact test, and the expected failure mode is typically bending and/or contact fatigue such as pitting and spalling. The termination point for this test was not only tooth breakage but also tooth deformation and a predetermined amount of spalling.
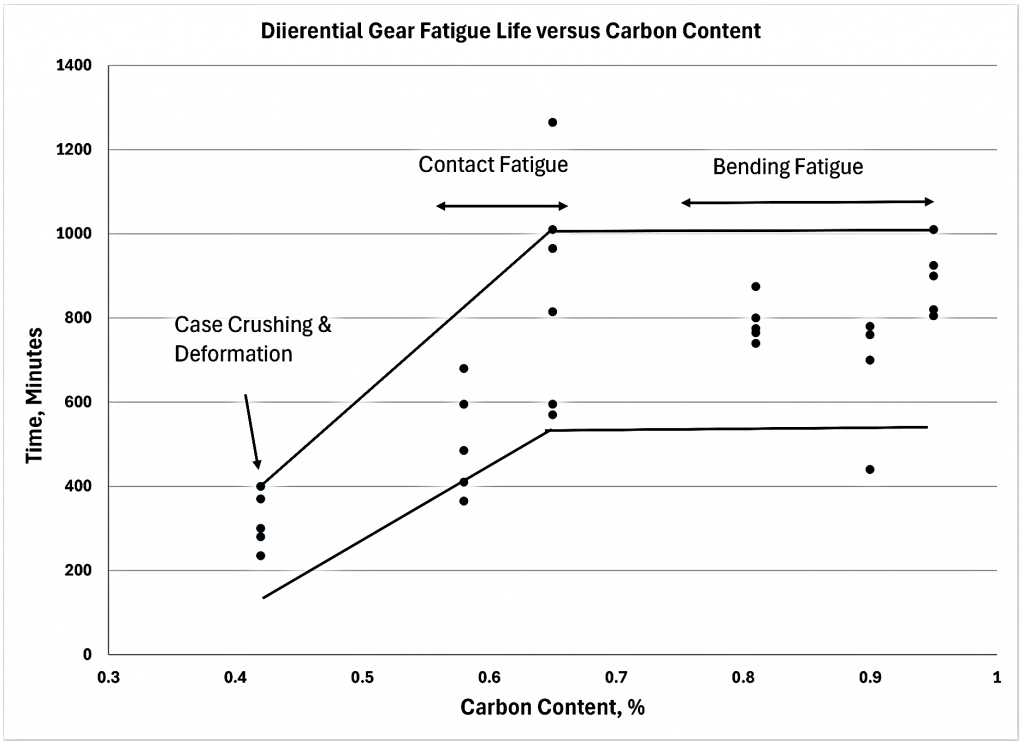
The test was paused at fixed intervals to perform visual and backlash inspections. Unlike the previous tests, this data exhibits an initial increase in life with increasing carbon content. This relationship holds true up to about 0.65% carbon then appears to level off; further increases in carbon provide no increase in life. The life at the higher carbon levels is more than double the life at the lowest carbon level. The failure mode at the lower carbon levels was contact fatigue, while, at the upper carbon levels, it changed over to bending fatigue. This data indicates that carbon levels below 0.65% are detrimental to contact fatigue.
Figure 6 shows the slow bend ultimate strength data for the U-Notch bars. As with the gear bending fatigue and impact data, lower carbon content appears to be beneficial to the ultimate bending strength. With all three materials, the bending strength at 0.42% carbon is approximately double that at the higher carbon levels. The three curves also start to level off above 0.65% carbon, and further increases in carbon result in very little decrease in strength. The 9310 and 4320 steels provide approximately a 25% increase in strength over the 8620 material. In the higher carbon range, the 9310 is stronger than the 4320, and at the lower carbon level, this is reversed.
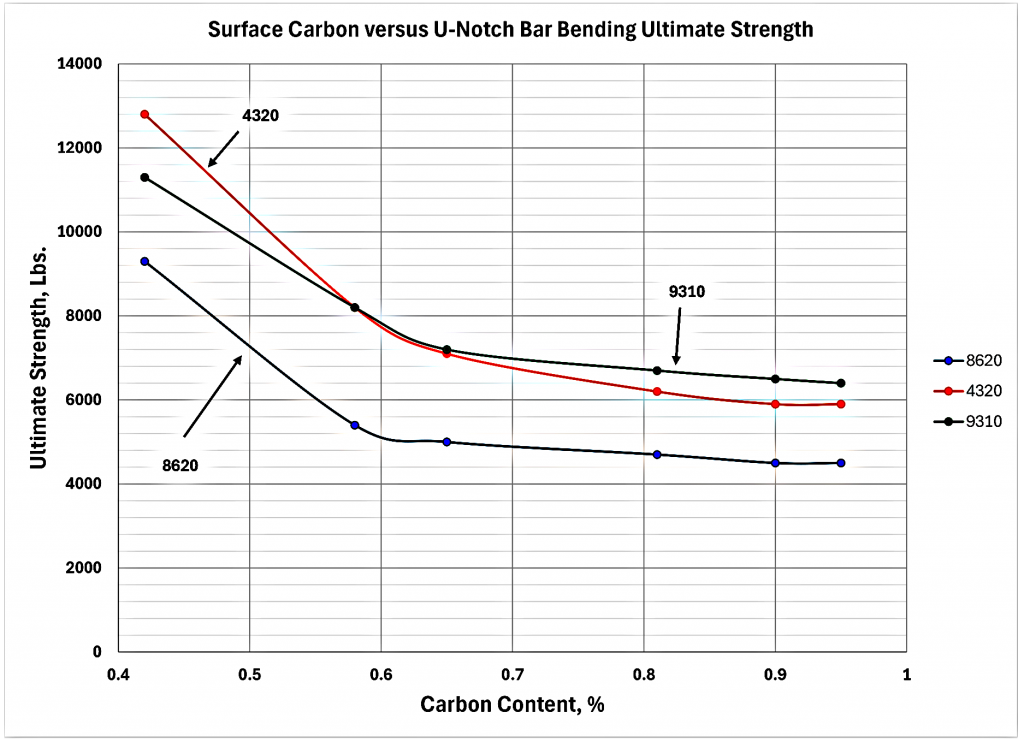
Figure 7 shows the yield strength data for the same test. Yield strength was determined using the Johnson Elastic Limit or JEL. This is defined by a 50% change in slope of the curve. The 8620 curve appears to be very similar in shape to the ultimate strength curves in Figure 6. However, at 0.42% carbon, the JEL strength was only 1.6 times the strength at the higher carbon levels. At 0.65% and above, the ultimate strength and JEL were about equal at 4,500 pounds, indicating very little ductility or plasticity. This is normal and a result of the 45 HRC core hardness with this low alloy 0.20% carbon carburizing grade of steel [2]. The 4320 JEL curve was different in shape compared to the ultimate curve. At 0.42% carbon, the JEL was only 1.45 times the strength at higher carbon levels.
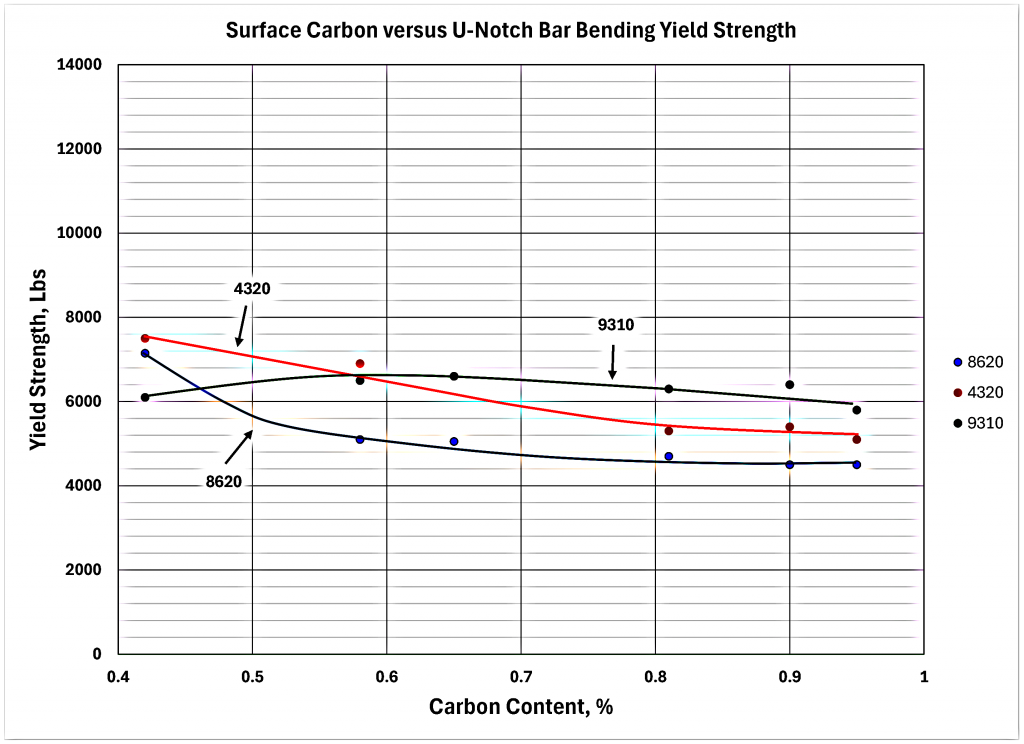
At 0.65% carbon and above, there is still some difference between the ultimate and JEL strength. This is also normal for this medium alloy grade of steel with a core hardness of 46 HRC. The 9310 JEL curve was also different from the ultimate strength curve. With 9310, the JEL was maximum at 0.65% carbon and decreased slightly at both lower and higher carbon levels. The relationship to the ultimate curve indicates a large degree of plasticity at the lower carbon levels with a smaller amount present at the higher carbon levels. The core hardness of 9310 was 41 HRC. The higher plasticity associated with the 4320 and 9310 grades would be expected to provide a higher level of impact energy absorption capability compared to the 8620 grade.
U-Notch bar surface hardness
Figure 8 shows the surface hardness of the U-Notch bars vs. the actual surface carbon content. The surface hardness was converted to HRC from the 0.1 mm (0.004”) and 0.15 mm (0.006”) 500 gram Vickers microhardness readings. The 8620 curve is very similar to the previous 8620 ring gear data. The hardness increases with carbon content up to about 0.65%, and then there is little-to-no increase in hardness. The 8620-hardness range at 0.80% carbon and above was 59-61 HRC. The 4320 curve is similar to the 8620 curve except the hardness values are about 2 HRC lower. The 4320-hardness range was 57-59 HRC at 0.80% carbon and above.
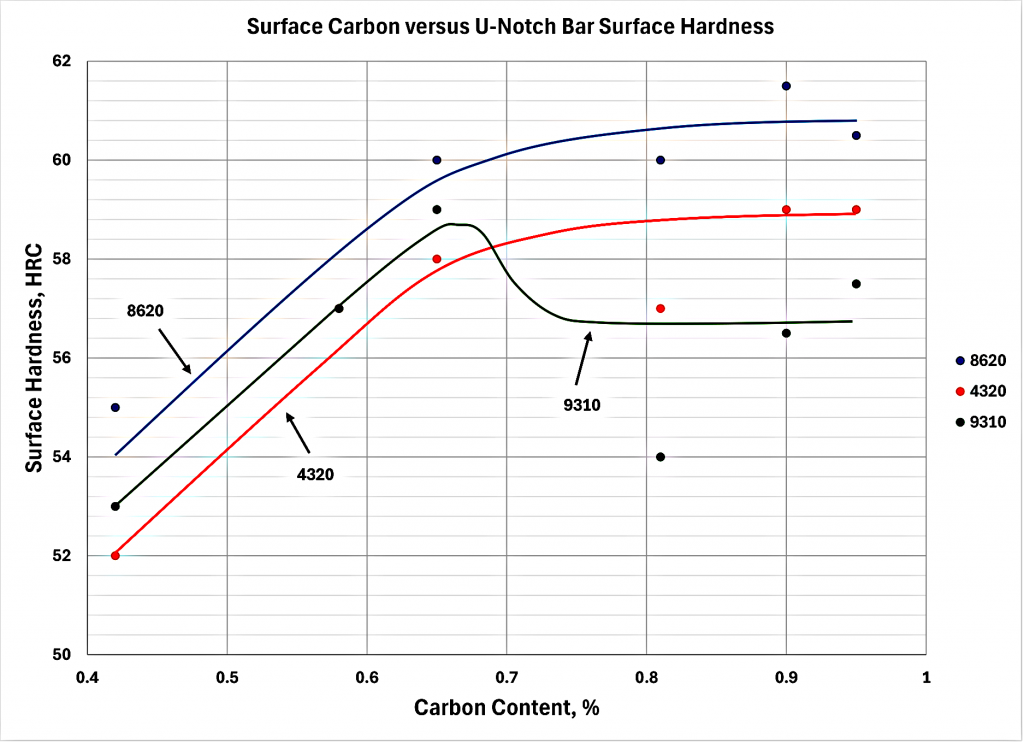
The 4320 steel has a nickel content of approximately 1.8% compared to 0.5% for 8620. As a result, 4320 will tend to retain more austenite upon quenching. The 9310 curve is similar to the 4320 curve up to 0.65% carbon, and then the 9310 hardness decreases with further increases in carbon. The 9310-hardness range was 54-58 HRC at 0.80% carbon and above. The 9310 has a nickel content of 3.25% and will tend to retain more austenite than the 4320 especially at higher carbon levels. A carbon range of 0.60-0.70% would provide the maximum surface hardness for this grade.
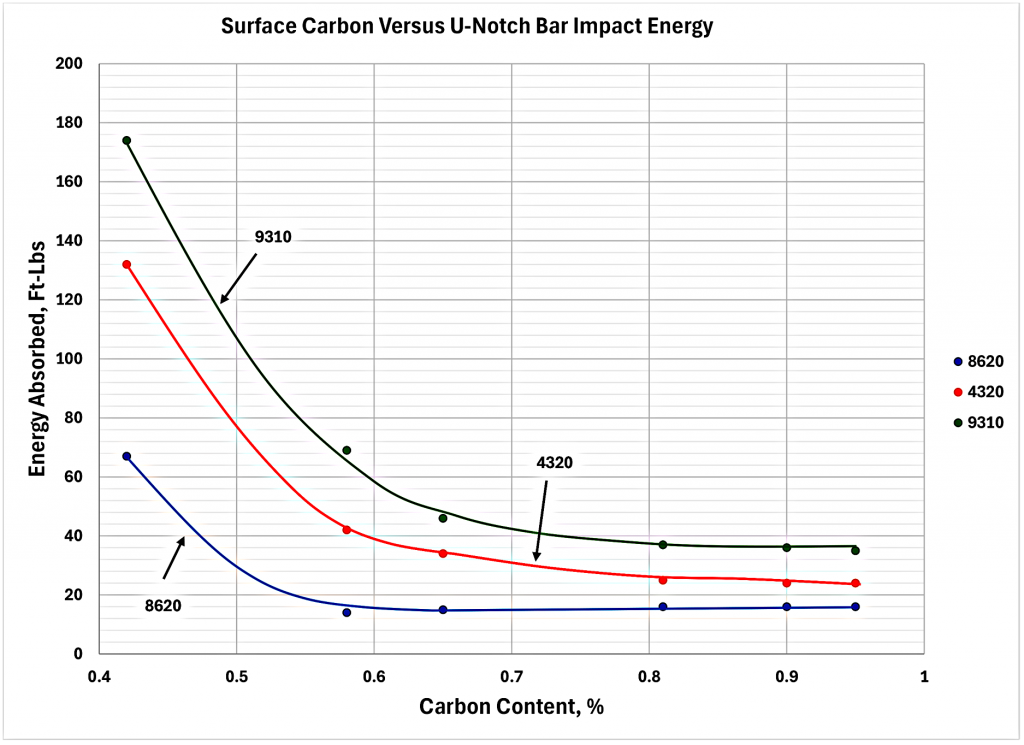
Figure 9 shows the U-Notch impact energy absorption capabilities of the three different materials. The impact tests were all run on a pendulum Charpy impact tester with an instrumented tup or striker. The fixturing of the machine was modified to accept the larger bars. The impact energy for 8620 is greatest at 0.42% carbon. At 0.58% carbon, it decreased significantly and remained at that level as the carbon level increased. As expected, 4320 and 9310 have similar shaped curves except the impact values are higher. With these two materials, the impact values do not level off until the carbon reaches 0.80%. At 0.80% carbon, the energy-absorption capability of 4320 is double that of 8620, and 9310 is about triple that of 8620. If the carbon content is reduced to 0.42% and 9310 material is used, the impact energy can be increased to 15 times that of 8620 at 0.80% carbon.
Shape and relationship
Figure 10 shows the impact ultimate strength for the U-Notch bars. The shape and relationship of the curves is very similar to the previous slow bend data. The significant difference is the impact strength values are higher than the slow bend values. There is no magic to impact testing; carburized parts fail because a sufficient force is generated by absorbing all of the energy, and that force is greater than under slow bend conditions.
Figure 11 shows the yield or JEL values for the impact test. Again, the shape and relationship of the curves is similar to the slow bend data, except the strength values for each condition are much higher.
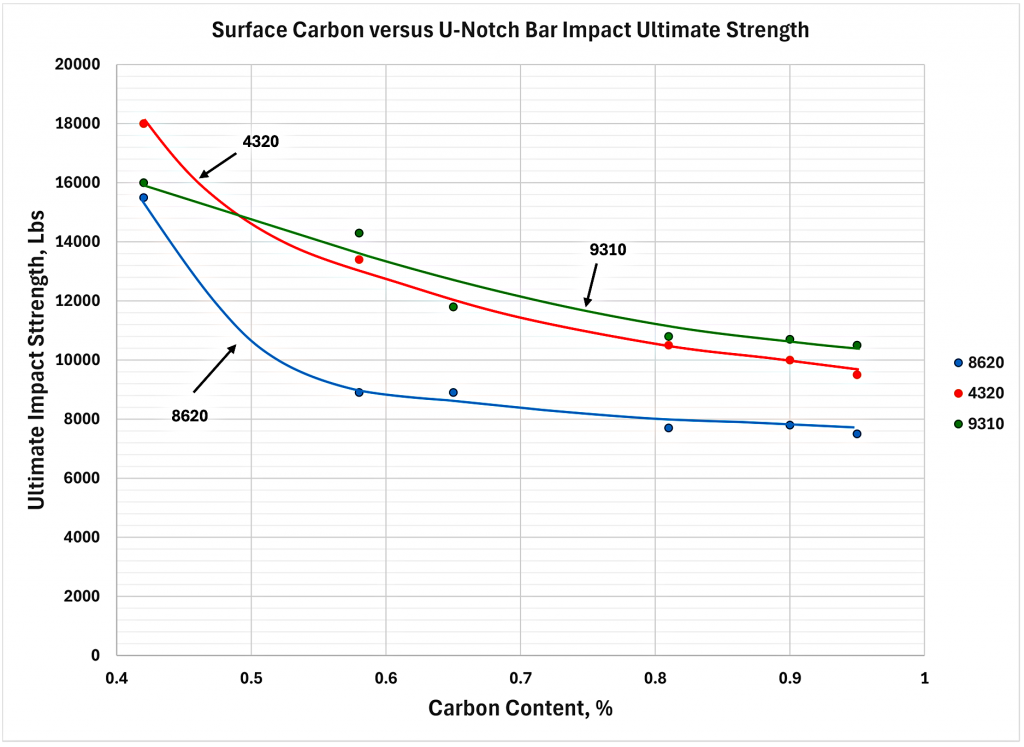
Figure 12 shows the fatigue data for the 8620 U-Notch bars. These bars were tested in three-point bending fatigue with the same configuration used for the slow bend and impact tests. The bars were tested at four different stress levels: 1,710 Mpa (248 ksi), 1,500 Mpa (217.5 ksi), 1,290 Mpa (187 ksi), and 1,072 Mpa (155.5 ksi). One sample at 0.42% carbon was also run at 855 Mpa (124 ksi). The straight-line stress vs. number of cycles (SN) curve crosses 200 ksi at about 6,300 cycles and, if extended out, would cross 100 ksi at about 1 million cycles. Like the actual gear fatigue data, the U-Notch life was greater with the lower surface carbon, but only with the 0.42% carbon level in the low cycle fatigue region. The 0.42% carbon samples deviated from the primary SN curve at about 20,000 cycles and below and crossed 200 ksi at about 14,000 cycles.
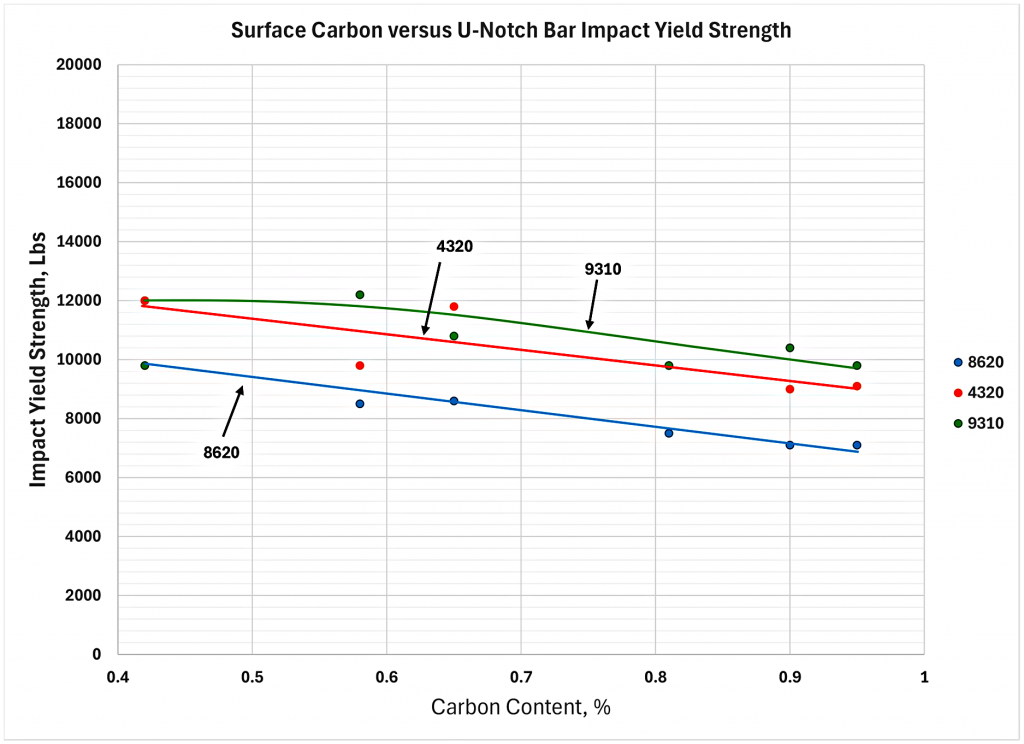
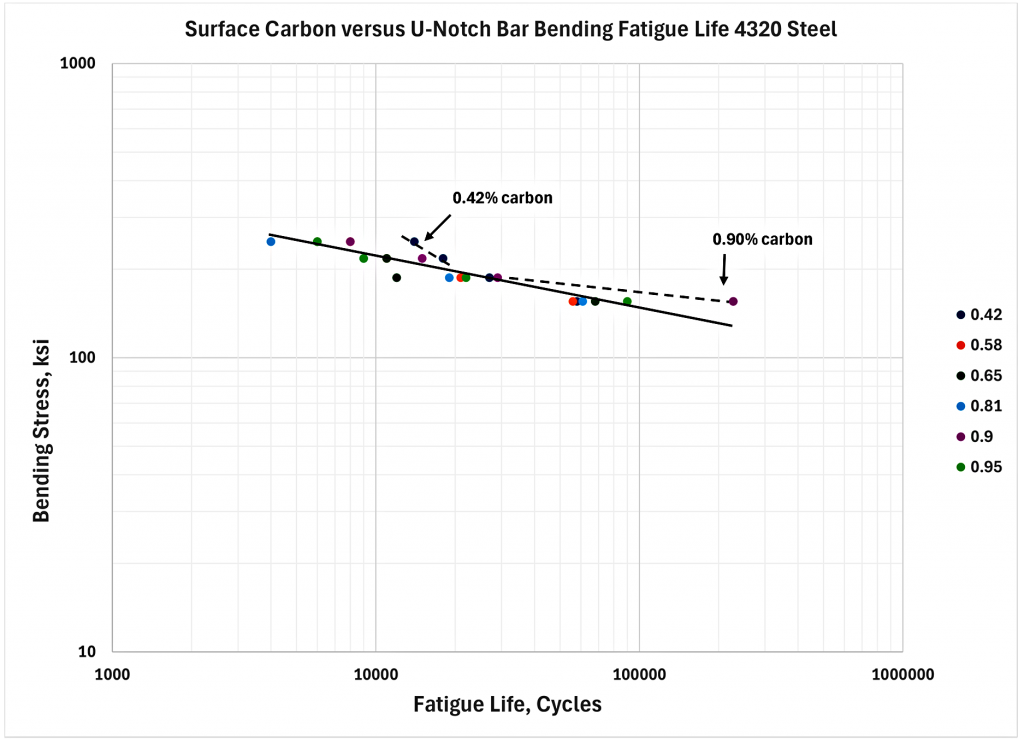
Figure 13 shows the fatigue data for the 4320 material. The curve crosses 200 ksi at about 20,000 cycles compared to 8620, which crossed at about 6,300 cycles. If the curve is extended in the high cycle region, it would again cross 100 ksi at about 1 million cycles. There is a modest improvement in life in the low cycle fatigue region. Like the 8620 steel, the fatigue life is also moderately higher at the 0.42% carbon at 20,000 cycles and below. The shape of the 4320 curve is different from the 8620 curve in the lower stress high cycle region. Here, the life appears to increase significantly with the 0.90% carbon levels and deviate from the primary curve. This is believed to be related to the retained austenite content. It appears to indicate that at low stress and a higher cycle life, retained austenite may be beneficial.
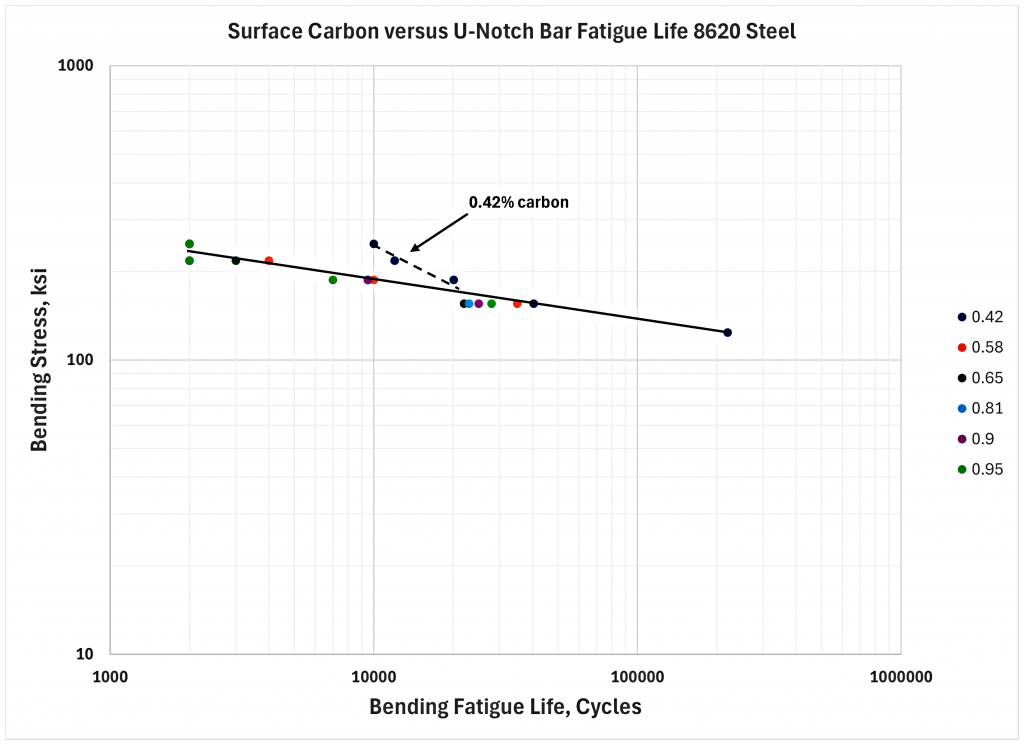
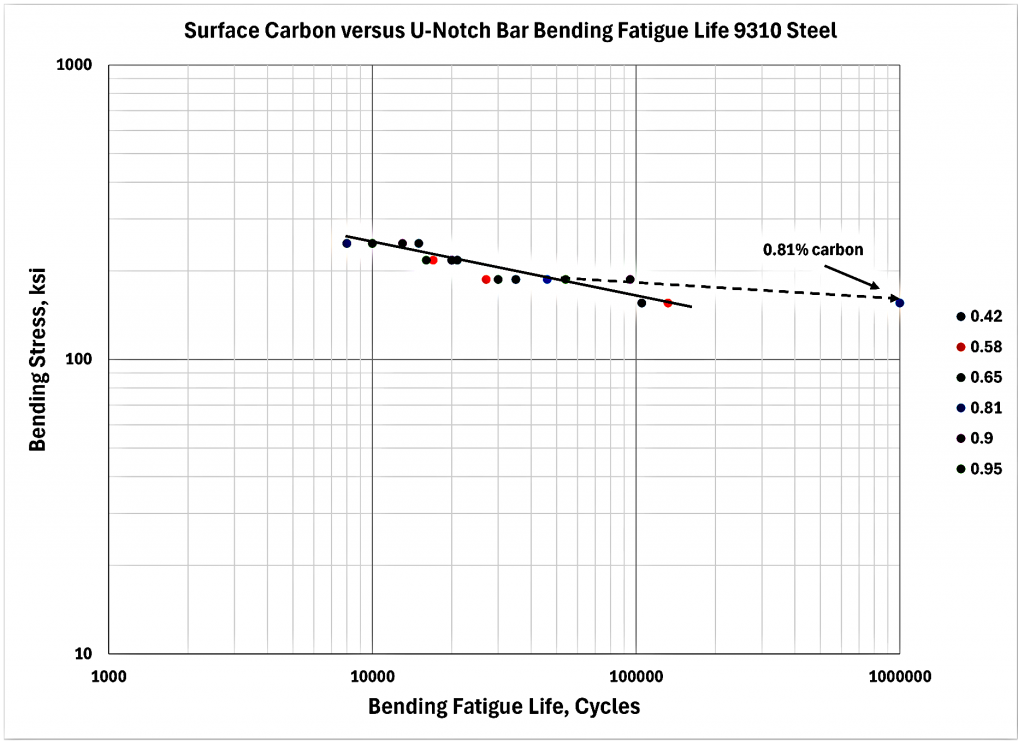
Figure 14 shows the 9310-fatigue data. The SN curve crosses 200 ksi at about 33,000 cycles. If the curve is extended in the high cycle region, it will cross 100 ksi a little beyond 1 million cycles. With 9310, there is no increase in life at the 0.42% carbon level at 20,000 cycles and below. However, the increase in life with the higher carbon levels at lower stress and higher cycle life is more pronounced. At 0.81% carbon, the life was nearly tenfold that of 0.42% and 0.58% carbon at the same stress level. Once again, this is believed to be a result of the retained austenite content.
Conclusion
To summarize the findings, reduced carbon levels appear to increase bending strength, bending impact properties, and bending fatigue life. Conversely, reduced carbon levels appear to decrease low cycle contact fatigue life and allow deformation to occur. Both bending performance and contact performance are important to a gear. Bending performance is important in order to prevent the gear tooth from fatiguing or fracturing at the root. Contact performance is important to keep the gear tooth from pitting, spalling, or deforming the face where it contacts the mating gear. To satisfy both of these requirements, the engineer may need to compromise when designing a gear. What is good for one load case is not necessarily good for the other.
To get the best bending performance from a gear, we would want the lowest carbon level that did not negatively affect contact fatigue. That level appears to be about 0.65% carbon. Then, we must consider the range of carbon that can realistically be maintained so we never fall below this minimum. In gas carburizing, that range can be rather wide over a long period of time. In some cases, it can be up to ±0.15% of the set point. That would mean aiming for 0.80% carbon and maintaining an overall range of 0.65-0.95%. Unfortunately, this doesn’t really take advantage of much of the potential benefit. However, if the range can be reduced, then some performance improvement is possible.
This study also shows that bending performance can be increased by increasing the alloy content of the steel. Significant gains in U-Notch bar bending strength and low-to-medium cycle bending fatigue life were observed by changing from 8620 to 4320 to 9310 steel. For all three grades, 0.42% carbon provided the highest bending strength and impact energy absorption. The highest bending fatigue life for 8620 was at 0.42% carbon. With 4320, this was also true at the higher stress levels but changed to 0.90% carbon at the lowest stress level as a result of increased retained austenite. The results for 9310 were similar to 4320 except a much larger increase in bending fatigue life occurred with the higher carbon levels. With the higher retained austenite comes a reduction in surface hardness, which must be considered.
References
- G. Fett, “The Effect of Carbon Content on the Performance of Carburized Steels,” 2009 ASM Heat Treating Conference.
- G. Fett, “Carburized Steel Mechanical Properties Bending Ultimate and Impact Strength,” Thermal Processing, May 2023, Pages 39-41.


 general practice for CQI-9 and AMS2750E")


