


In this column, I will discuss the effect of agitation on the cooling curve of oil quenchants.
Oil has been used for many years as an industrial quenchant, with some saying that it has been used for several thousand years [1]. While oil quenchants of whale oil, vegetable oils, and mineral oils have been used industrially in the past 150 years, the effects of agitation and temperature have been less studied or documented.
Historically, agitation has always been recommended for quenching steel. However, the amount of agitation, and its effects are hard to quantify. An initial attempt as quantifying agitation was published by Grossman [2] and is shown in Table 1.

The oil used by Grossman was a simple straight oil without additives, the values of H-value are conservative for modern oils. This is based on determined values of modern oils with sophisticated additive packages. For modern oils without agitation, the H-value, without agitation, can range from 0.25 to 0.85 [3].
The biggest issue with the application of the Grossman H-value is the difficulty in quantifying agitation rates. The terms describing the agitation are not quantifiable and can result in errors. There is really no understanding of what is meant by “mild” or “violent” agitation. Since oils are tested without agitation per ASTM D6200 [4], this results in a narrow range of possible oil values.
Effect of Agitation on Cooling Curve Behavior
Agitation is critical for quenching uniformity and proper control of distortion. It reduces surface-to-surface thermal gradients and provides for uniform heat transfer and uniform flow throughout the workload. It wipes the vapor blanket from parts to achieve proper quenching and minimizes persistent vapor that is trapped in keyways or blind corners. Racking and agitation work together to provide low-distortion parts, desired properties, and microstructure. The agitation of a quenchant can be obtained in several ways. In conventional quench tanks, circulation of the quenching medium is usually provided by:
- Pumps.
- Passage of the work piece through the quenching medium.
- Manual or mechanical movement of the work piece.
- Mechanical propellers or impellers.
The selection of the agitation method is dependent on the tank design, type of quenchant, volume of quenchant, the part design, and the severity of quench required.
Traditionally, the quench severity of an oil quenchant is evaluated by quenching a heated probe into a bath of quenchant with no agitation [4]. In this test, a heated 12.5 x 60 mm cylindrical Inconel 600 probe is quenched into a 2.0 liter tall-form stainless steel beaker containing the quenchant. However, this does not show the effects of agitation on cooling curve behavior.
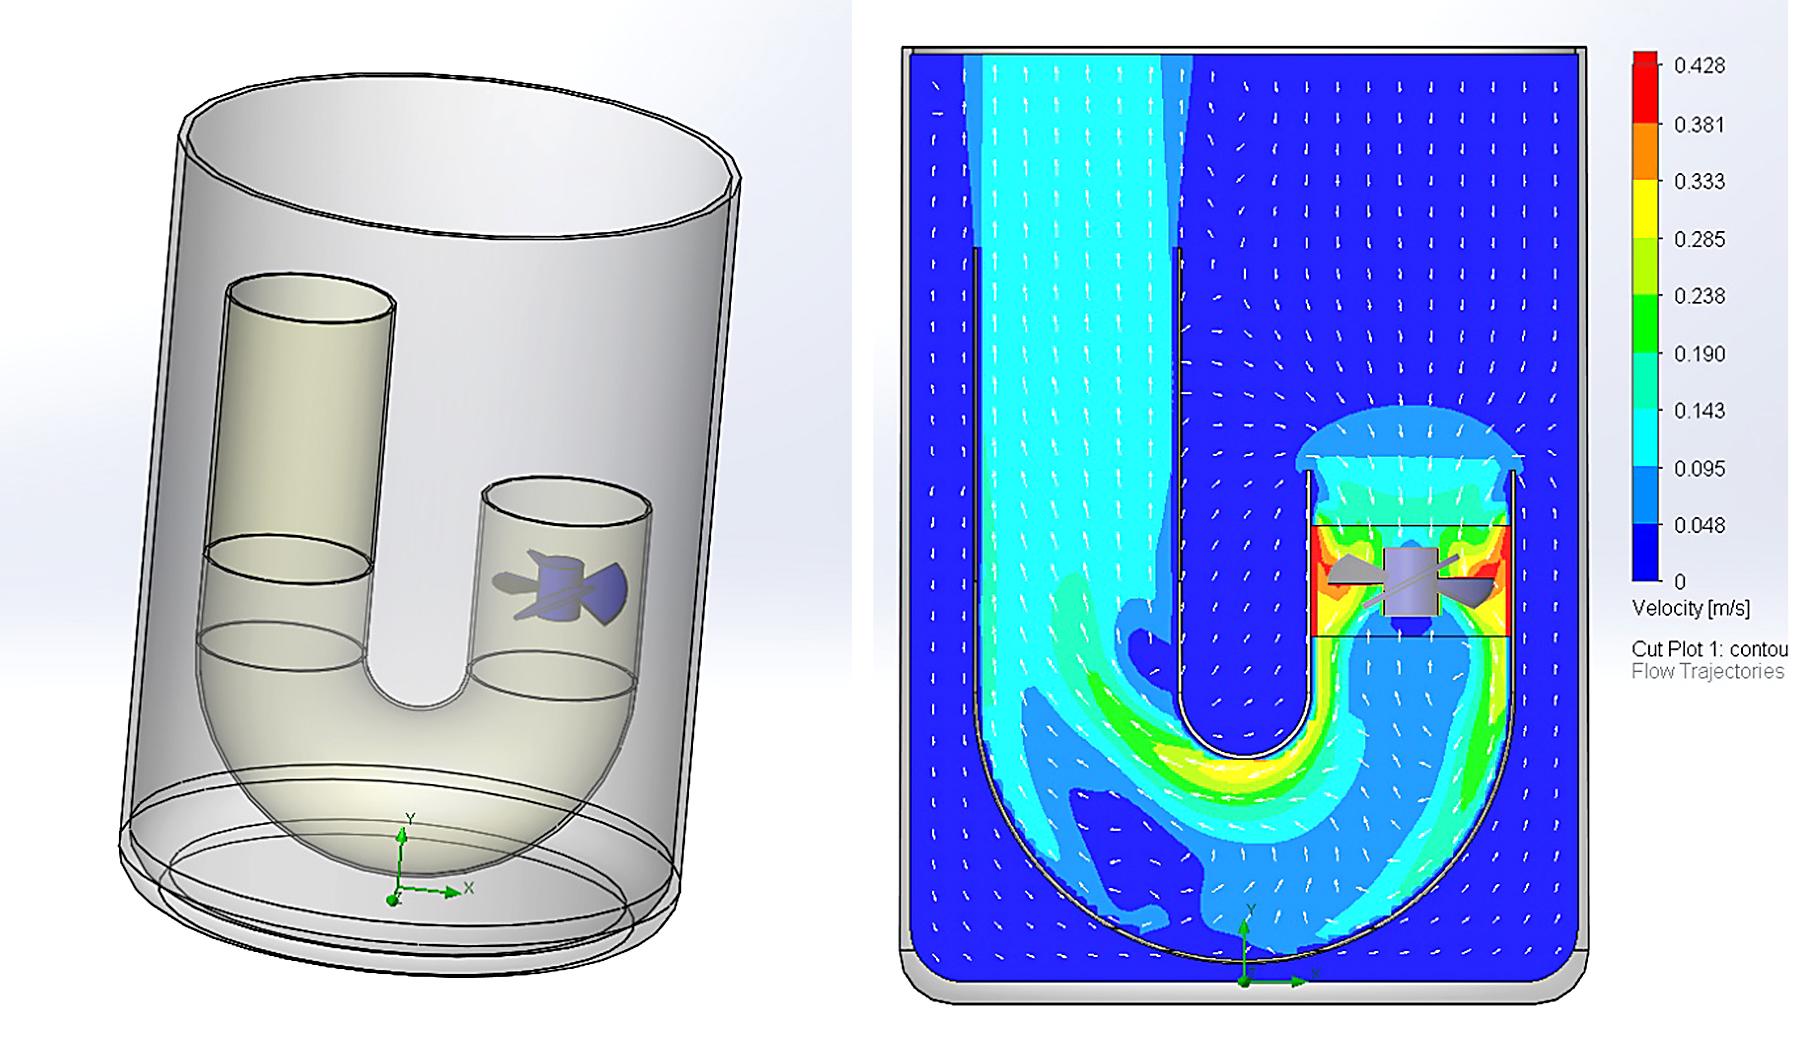
One apparatus to measure the effect of agitation on the cooling curve behavior is the “J-Tube.” In this design, a 40-mm stainless tube is bent in the form of a “J,” with the short vertical leg being 50-mm in length, and the long leg being 100-mm long. The centerlines of the legs are 75-mm apart, and the radius of the “J” is 37.5-mm (at the centerline of the tube). The J-tube is placed into a large stainless beaker and filled with oil. A standard four-blade laboratory impeller is inserted inside the tube at a depth of 25 mm from the top of the short leg (Figure 1).The ASTM D6200 Inconel 600 probe is inserted to a depth of 75-mm in the center of the longer vertical tube.
Using a medium speed quench oil, the effect of agitation was examined. In this test, the oil was heated to 60°C, and tested using the J-Tube. The results (Figure 2) show a gradual decrease in the stability of the vapor phase, and an increase in the maximum cooling rate. The cooling rate during the convection phase also increased as the RPM was increased. Table 2 shows the specific cooling curve characteristics as a function of RPM.
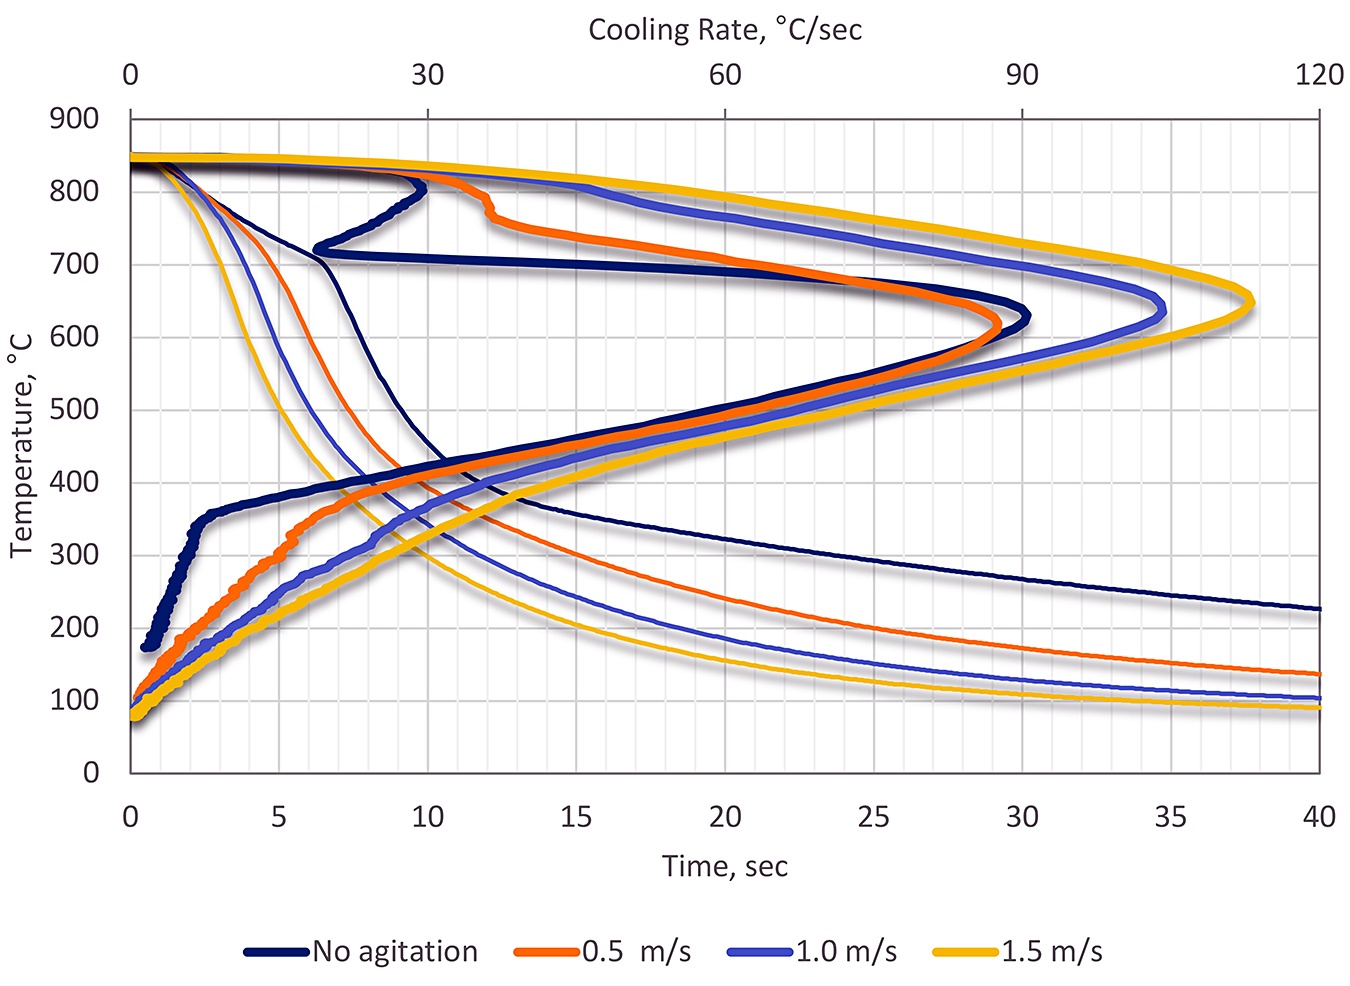

As can be seen from the cooling curves in Figure 2, there is a significant change in the shape of the cooling curves as a function of flow rate. As agitation is increased, the vapor phase becomes less stable, and almost disappears completely. Up to a velocity of approximately 0.5 m/s, the maximum cooling rate changes very little. However, at velocities greater than 0.5 m/s, the maximum cooling rate increases to nearly double of the non-agitated sample. Lastly, the convection stage shows a large change in the cooling rate. As the agitation rate is increased, the cooling rate and effective heat transfer rate also increase. This is doubly significant because this region is in the temperature range of the martensite transformation temperature, and distortion control.
This also assumes that the agitation is uniform. Just increasing agitation works for increasing properties, but if the agitation is non-uniform, increased distortion — and potentially cracking — can occur. For thick sections, one way of controlling distortion is to use high agitation rates at the beginning of quenching, to ensure that parts avoid forming non-martensitic transformations (bainite and pearlite), and then slow the agitation rate as the parts approach the martensite start temperature to reduce distortion.
Conclusion
In this article, we have illustrated the effect of agitation on the cooling curve behavior of oils and showed that significant variation in cooling curve behavior can occur as a result of agitation. As agitation is increased, the vapor phase is destabilized, and the cooling rate increases. The maximum cooling rate occurs earlier and increases. The convection stage increases because of increased agitation.
Should there be any questions regarding this column, or have any suggestions for additional columns, please contact the write or editor.
References
- D. B. Wagner, “Ferrous Metallurgy,” in Science and Technology in China, vol. 5, Cambridge, Cambridge University Press, 2008.
- M. A. Grossman, “Hardenability Calculated from Chemical Composition,” Metals Technology, pp. 1-29, June 1942.
- D. S. MacKenzie, “Determining Grossman H-value from cooling curve data,” Thermal Processing, no. February, pp. 21-23, 2020.
- ASTM International, Standard Test Method for Determination of Cooling Characteristics of Quench Oils by Cooling Curve Analysis, ASTM D 6200, Conshocken: ASTM, 2012.


 general practice for CQI-9 and AMS2750E")


