


Many years ago, as a mechanical engineering undergraduate student, an analogy was offered to help explain the interplay between convection and conduction in heat transfer. The analogy goes as follows: The solid material can be thought of as an island, surrounded by an ocean of fluid. On this island, there are tired tourists trying to leave the island, much like thermal energy trying to escape a hot part. To accomplish the task of transporting tourists off the island, two modes of transportation are required. First, buses are required to transport the tourists from all over the island to the coasts. The buses can be thought of as conduction. Ferries are then needed to transport the tourists from the island, back to the mainland. The ferries can be thought of as convection.
Generally speaking, a material’s bus system is set, and is described by its thermal conductivity. And like any good coordinator, materials understand that it is beneficial to provide more buses during busy times; thermal conductivity is increased in response to a red-hot part full of tired and cranky tourists trying to leave the island. However, the number and size of ferries can vary widely from tiny, gas-quenching ferries to massive, water-quenching ferries. This variation means coasts can become packed with angry tourists waiting to get on one of the tiny ferries provided by low convection or can create packed buses struggling to keep up with the demands of the large ferries provided by high convection. The limit of a material’s bus system is an important concept to understand in light of how critical cooling rates are to a material’s properties and ultimate service performance.
Using simulation to help visualize the limits of conduction, a steel and aluminum cylinder were quenched from their respective solutionizing temperatures, 925° C and 525° C, to room temperature. Aluminum has, on average, a thermal conductivity a full magnitude greater than steel; meaning aluminum has more seats on its buses. The convection coefficient, commonly referred to as the heat transfer coefficient (HTC), was then varied over values commonly experienced in the thermal processing industry and the cooling behavior at various depths below the surface evaluated. The difference between the time-temperature histories at different depths, induced by a variation in the HTC, is of significance. There will be a depth and HTC combination that will be the cooling limit of the material, where a faster HTC will not cool that depth any faster.
For reference and in general, average HTCs of 0.5 kW/m2K are common for high pressure gas quenching, 5 kW/m2K for oil quenching, 10 kW/m2K for water quenching, and 20 kW/m2K for intensive water quenching. An HTC of 30 kW/m2K was also evaluated as an additional data point, though is outside the range of common quenching processes.
At a depth of 1 mm below the surface, the cooling behavior of steel and aluminum are similar, as shown in Figures 1A and 1B, with an approximately 100° C difference at any given time between 450° C and 250° C for the 5 and 10 kW/m2K HTC values. These two HTC values, 5 and 10 kW/m2K, are significant as they represent the average values for oil and water quenching, respectively, and generally span the range of all common liquid quenchants. At 1 mm depth, convection is the dominating transport mode, although there is little difference between the two highest HTCs evaluated.
At 6 mm depth, there is also little difference between steel and aluminum, as shown in Figures 1C and 1D. While the temperature differences have shifted to slightly longer times when compared to the cooling behavior at 1 mm, the temperature differences during cooling at 6 mm are approximately the same as 1 mm for both materials. At 6 mm depth, convection is still the dominating phenomenon driving heat transfer.
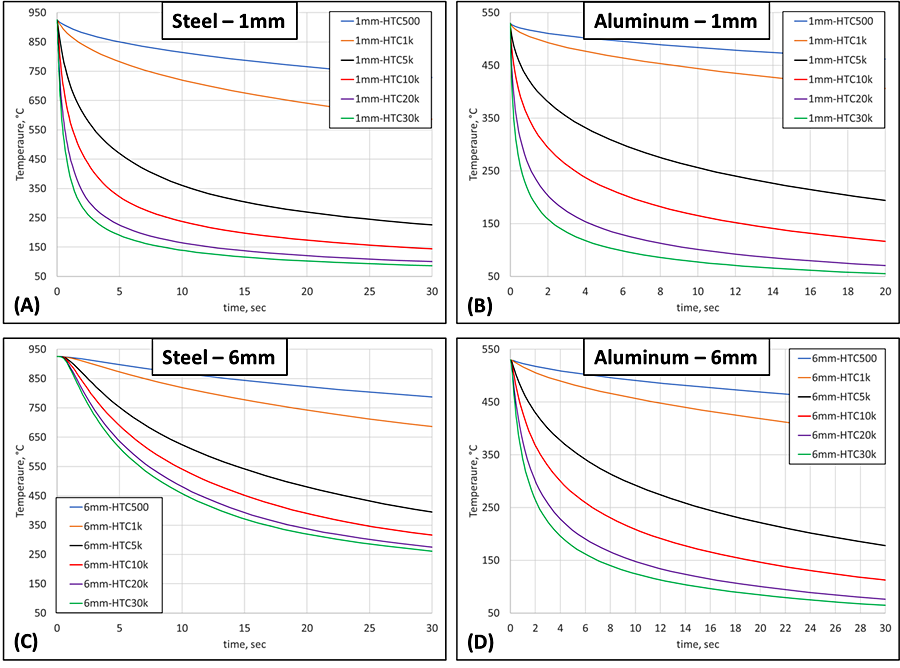
Traveling deeper into the part, down to 12 mm, differences between the two materials, and between shallower depths in the same material, begin to materialize, as shown in Figures 1E and 1F. The difference between 6 mm and 12 mm is more pronounced in the steel than in the aluminum, with an approximately 50 percent tightening of the temperature difference between 5 and 10 kW/m2K for the steel part and only 25 percent for the aluminum. Conduction’s role becomes even clearer at a depth of 24 mm, as shown in Figures 1G and 1H. Here, steel has a noticeable difference in the cooling behavior provided by various HTCs, compared to 12 mm. However, the difference for aluminum is much less. It is also worth noting that for steel at depths greater than 24 mm, there is no significant difference between 10 and 20 kW/m2K. This means steel’s buses are running at full capacity at this depth and using alternative means to increase the HTC greater than 10 kW/m2K are futile, as the cooling rate will not increase at this depth with an increased HTC. For aluminum, there is still a significant difference in the cooling behavior using an HTC of 10 or 20 kW/m2K at a depth of 24 mm.
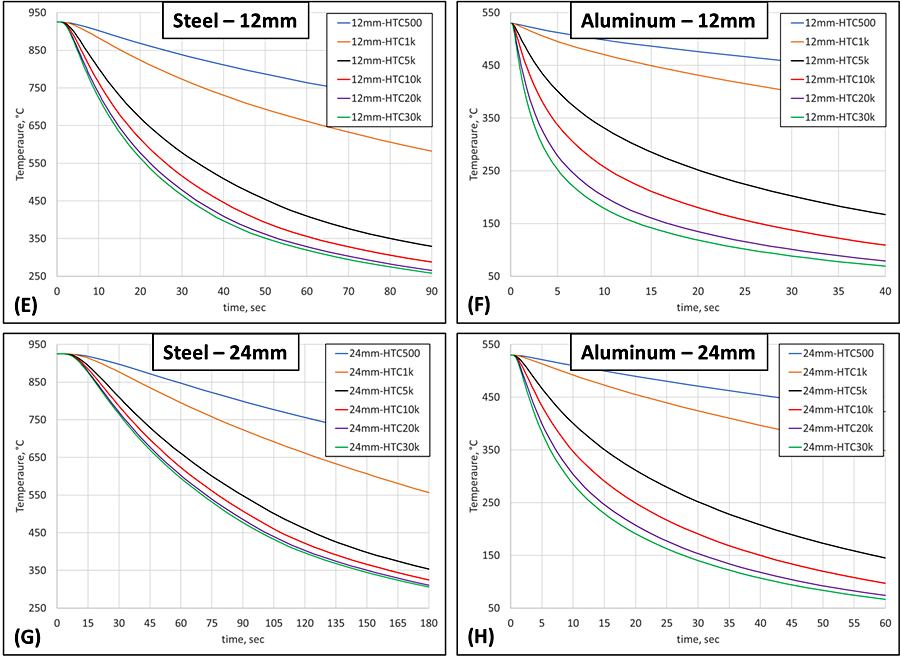
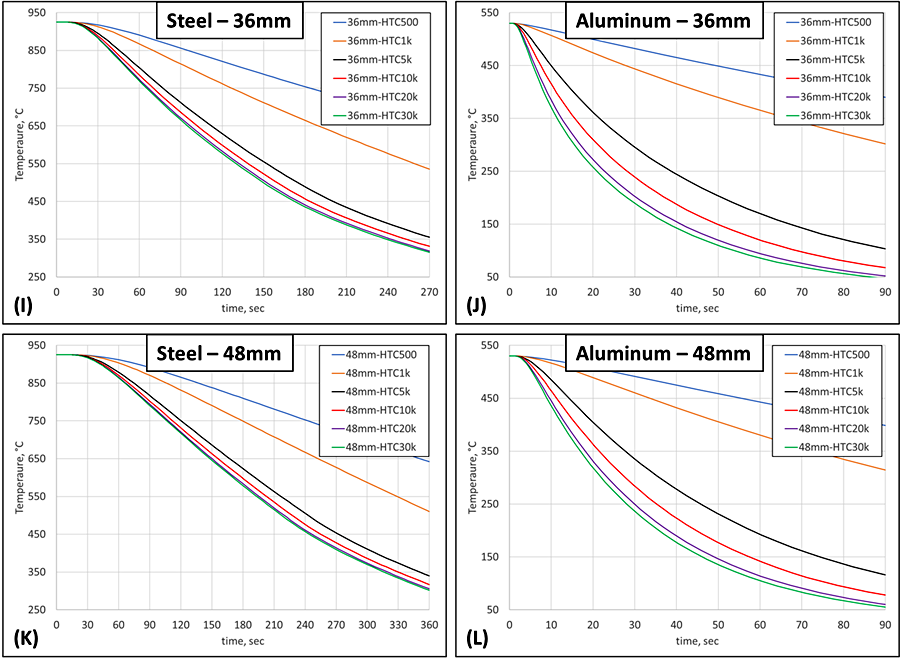
Reaching 36 mm and 48 mm below the surface, Figures 1I – 1L show that any HTC greater than 5 kW/m2K will not provide any increase to the cooling rate of steel deeper than 36 mm below the surface. The difference provided by the two slowest HTCs and the faster HTCs is also beginning to significantly diminish at a depth of 48 mm for steel. Aluminum, on the other hand, still provides enough thermal energy transportation to continually supply the ferries with new tourists trying to leave the island, as shown in Figure 1L. Even HTC values of 10 and 20 kW/m2K provide a cooling difference at a depth of 48 mm for aluminum.
In conclusion, understanding the relationship between conduction and convection when determining quenching media for a given material and cross-sectional thickness is imperative in ensuring the specified properties are met. Simulation can be a powerful tool to quickly evaluate the effect of a quenching media on providing the necessary cooling power at a given depth for a specific material.


 general practice for CQI-9 and AMS2750E")


