


Interactions between gear and lubricant are very important for understanding and predicting the efficiency and durability of a gearbox. This study investigates two aspects of lubrication related to gearboxes – lubricant flow due to rotating gears, as well as the hardware thermal response due to contact friction. The first part of the article uses computational fluid dynamics (CFD) to investigate windage and churning loss of a simple gearbox. The results of this modeling provide visualization of lubricant flow and distribution inside the gearbox, as well as quantitative prediction of churning loss inside the gearbox.
With the industry need for higher efficiency while maintaining durability for gearboxes, it is very important to understand the interactions between gears and lubricants. This study developed modeling methodologies to investigate two aspects of lubrication related to gearboxes — lubricant flow due to rotating gears, as well as the gear tooth thermal response due to contact friction. The first part of the article uses computational fluid dynamics (CFD) to investigate windage and churning loss of a simple gearbox. The results of this modeling provide visualization of lubricant flow and distribution inside the gearbox, as well as quantitative prediction of the churning loss inside the gearbox.
Lubricant properties affecting the churning loss are also discussed. The second part of the article presents thermal modeling results of a Mini-Traction Machine (MTM) test rig. We chose modeling MTM test rig as the foundational technology demonstration because of its wide availability for lubricant developers and ease of experimental validation for modeling. Similar modeling procedures are also applicable for actual gear contact to estimate the bulk teeth temperature for determining oil film thickness in gear contacts.
1 Oil flow and churning loss
Oil churning is one of the main power loss mechanisms inside a gearbox. High speed rotating gears can cause significant loss primarily due to the resistance of oil and air surrounding the gear. Although the power loss and visualization of oil flow inside the gearbox are often measured and observed using a transparent gearbox, where a transparent plastic case is used to replace the metal case, therefore, offering direct observation of oil flow inside a gearbox. On the other hand, a sophisticated computational fluid dynamics (CFD) model can be a great alternative where faster turnaround time and lower cost is required, especially at early design stages of the gearbox.
In this study, we developed a two-phase fluid flow model using a commercial CFD software package, ANSYS Fluent. The model domain and gear geometry are adopted from an experimental study from Ohio State University, where the oil churning power loss is measured and reported [1].
112.5 mm.
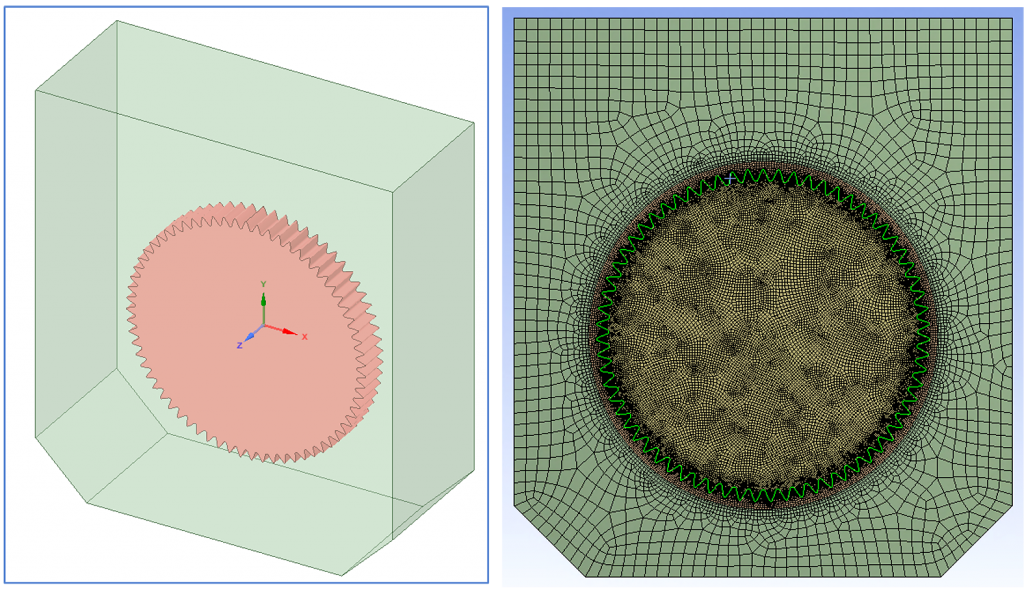
As shown in Figure 1, the gearbox contains only one spur gear, and churning loss from the oil around the gear can be simulated and predicted. The spur gear has an outside radius of 112.5 mm, width of 28.5 mm, and 67 teeth with transverse module of 3.275 mm. The box half width is 168 mm, and its total height is 378 mm. More detailed information of the test geometry can be found in [1]. Both single phase windage loss (due to air) and two-phase churning loss (due to air and oil) are modeled and compared with experimental results. For the two-phase flow, the oil and air phases are modeled using volume of fluid (VOF) method, with air as the primary phase and oil as the secondary phase. The general methodology is widely reported in literature, e.g., [2] and is not repeated here. No slip wall boundary conditions are applied for both the gearbox and gear. No heat transfer is modeled in this investigation because the experimental results indicated that isothermal conditions were appropriate for modeling. The oil kinematic viscosity is 31.9 cSt, and density is 816 kg/m3.
A mesh sensitivity study was performed first to check the accuracy and consistency of the developed modeling procedure. In this validation study, single phase (air only) was selected for quick turnaround time.
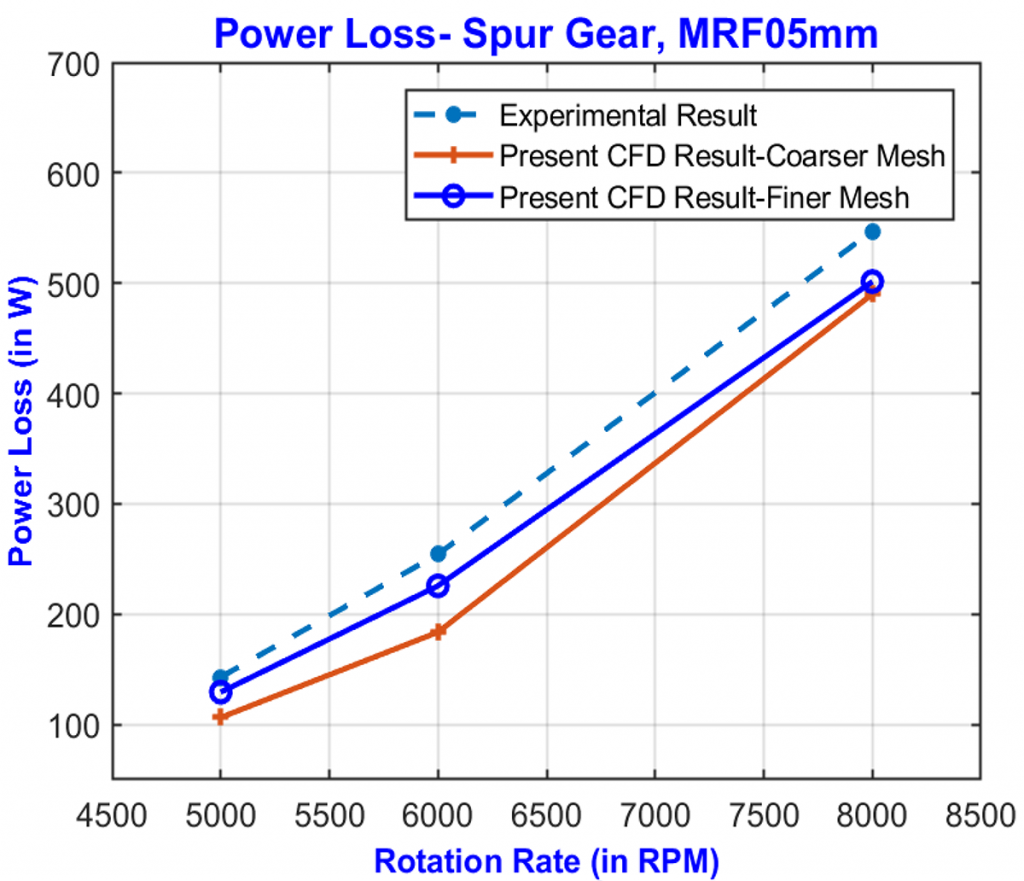
Figure 2 shows the comparison results between modeling and test. The CFD model predictions are in reasonable agreement with test results, and finer mesh appears to generate better agreement. All subsequent modeling results are based on finer mesh. The mesh sensitivity study of two-phase flow is not performed because it takes considerably more computational time. However, as seen in later discussion, the mesh employed in this article is considered sufficient as indicated by agreement between experiment and model. For single phase flow, the predicted power loss is slightly lower than the experimental results, probably due to additional frictional loss from components such as shaft and rolling element bearings, which were not modeled in this study.
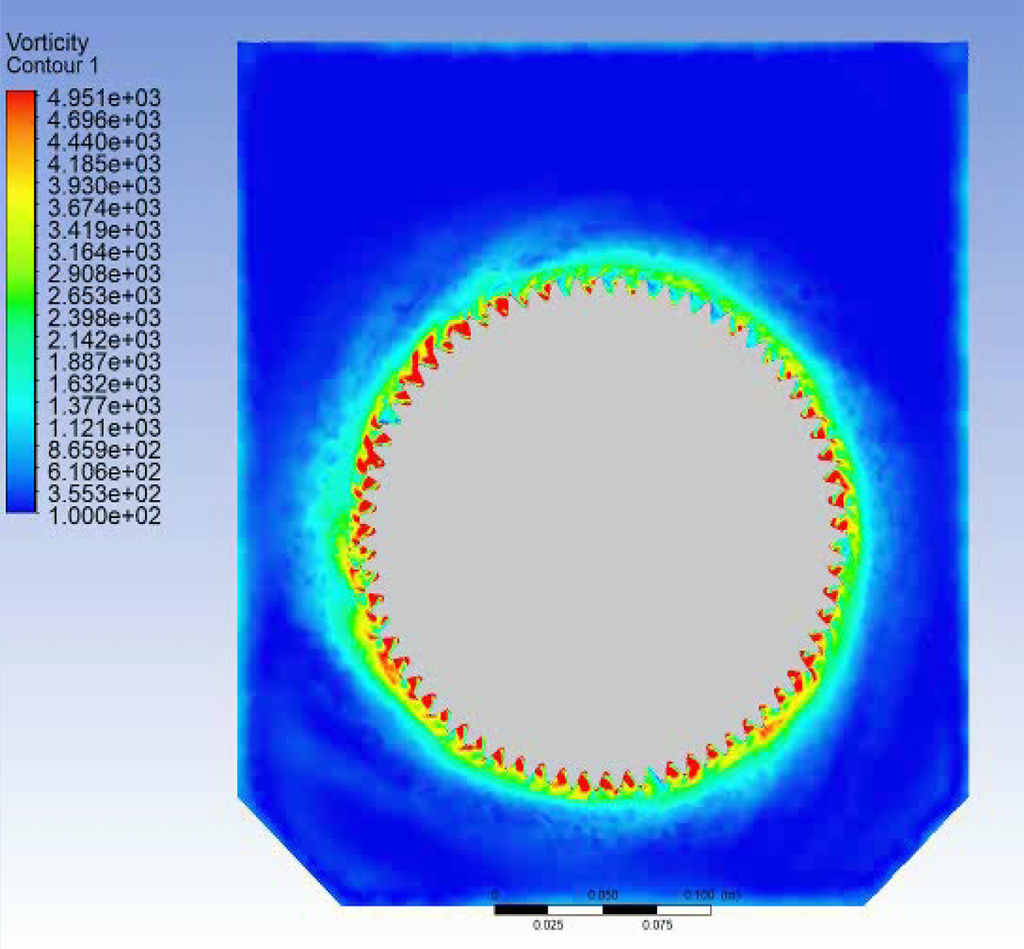
Figure 3 shows the vorticity contour at midplane of the gear for one of the simulated cases. The gear is rotating counterclockwise at a speed of 5,000 RPM. As expected, highest vorticity is seen close to the gear teeth due to shear flow, and the effect of the gear teeth on air flow falls off rapidly with distance away from the teeth. This indicates that the design of enclosure has limited influence on the windage power loss as long as it does not significantly affect air flow surrounding the gear.
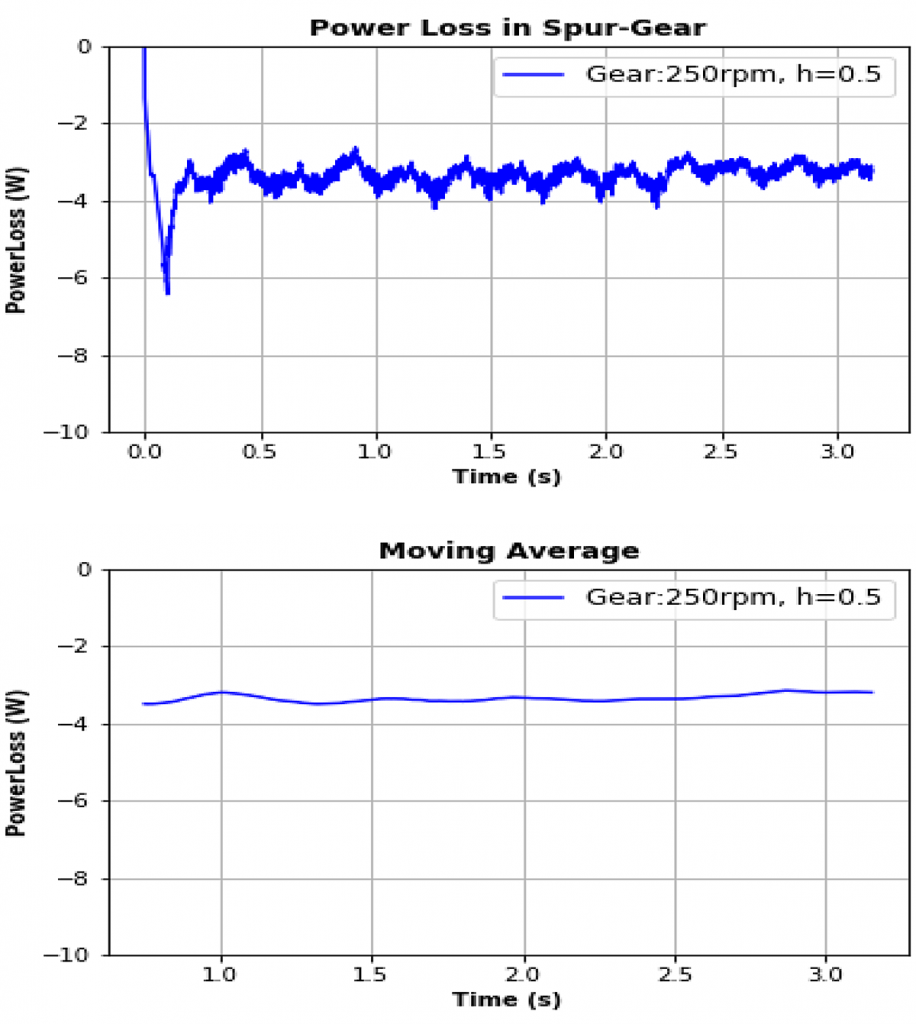
After the modeling procedure was developed and validated, two-phase flow with different initial oil fill levels was simulated. In this simulation, the initial fill level is described by a nondimensionalized oil level height, h, defined by the oil level height from the bottom of the gearbox, divided by the distance between the bottom of the gearbox to the center of gear, e.g., h = 1 indicates the oil is filled from the bottom of the gearbox to the center of the gear. Once the gear starts to rotate, transient oil and air flow develops inside the gearbox. Continuous flow simulation shows the flow never reaches a steady state for this configuration, and the instantaneous power loss continues to fluctuate over time. The reported power loss in this article is reported as the moving average of the raw data. An example of this data processing is shown in Figure 4.
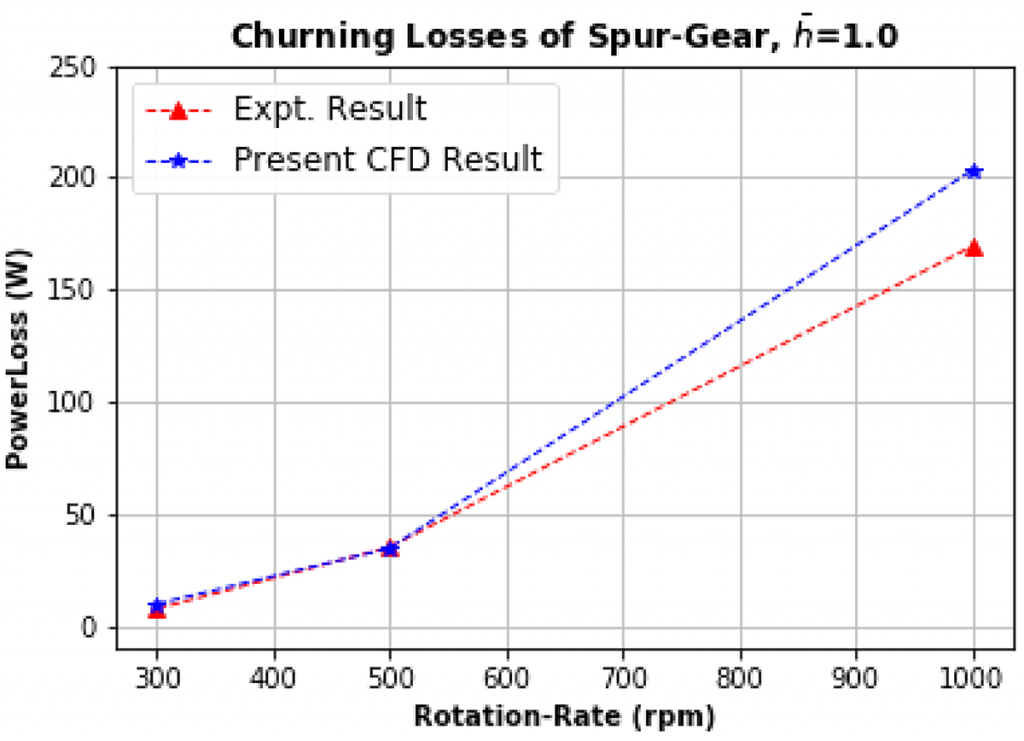
The cause of the power loss fluctuation can be explained/visualized by the volume fraction of oil inside the gearbox, as shown in Figure 5. Oil is agitated/driven by the rotating gear, splashed to the wall, returned to sump, broken into droplet and/or mist, further splashed by the gear, and this chaotic behavior continues to evolve in the space-time domain, which generates a recurring power loss fluctuation. One example of the comparison between the CFD and experimental results is shown in Figure 6.
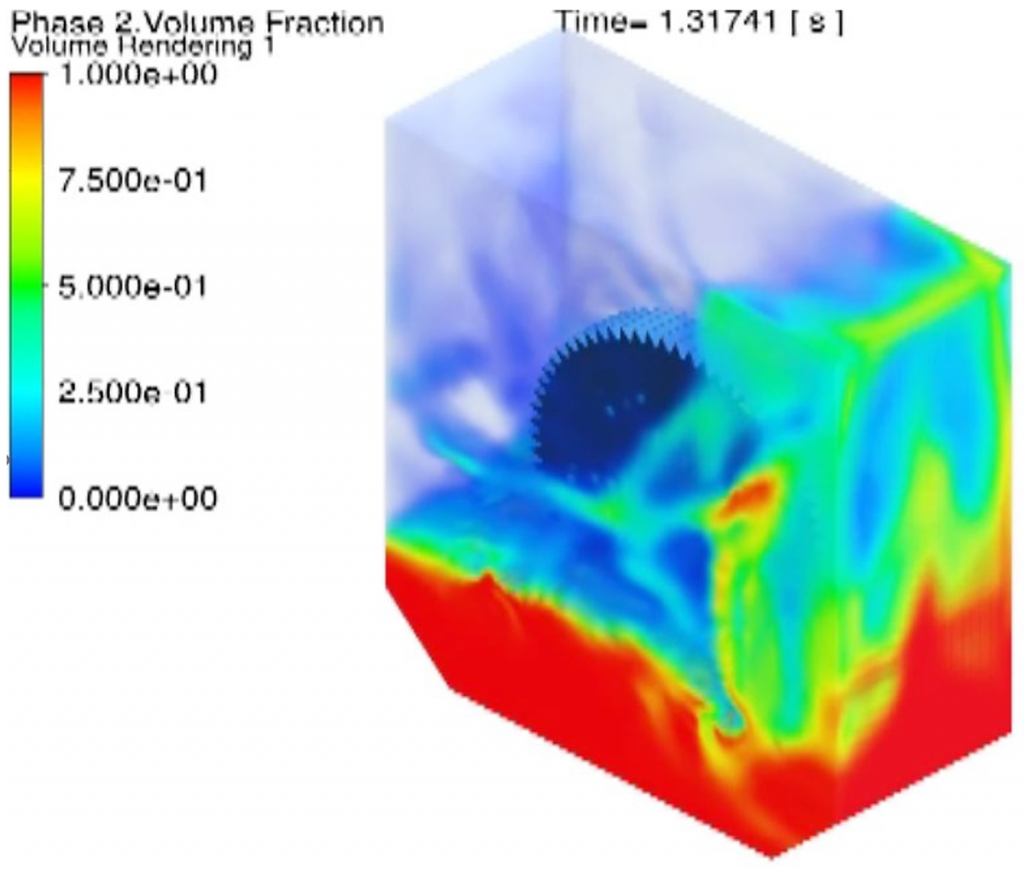
The agreement is excellent for lower gear rotating speed. However, the discrepancy between the model and experiment increases at higher gear rotating speed. The power loss at higher gear rotating speed is probably affected by aeration/foaming of the oil, which influences the effective fill level of the oil. In addition, the wall adhesion and surface tension of the oil may also affect the returning oil flow to the sump, as well as droplet formation, therefore, changing churning power loss. More investigation is needed to examine the sensitivity of lubricant properties on the oil churning loss in the gearbox.
2 Thermal response of a non-conformal contact
Gear contacts consist of a combination of sliding and rolling of the gear teeth at high pressure. During operation, temperature profiles of the gear teeth deviate significantly from ambient conditions due to frictional heating. This affects the local oil properties that have a direct impact on the durability and efficiency of the gearbox [3]. However, measurement of the gear tooth temperature inside an operating gearbox is a significant challenge, which leads to difficulty in validating the various models for local contact temperature proposed in the literature. On the contrary, simple benchtop testing rigs, such as the Mini-Traction Machine (MTM), offer an easy to access opportunity to study thermal response of nonconformal contacts with demonstrated relevance to gear contacts. In this study, IR thermal imaging techniques were used to measure the thermal response of the ball and disc specimen temperature in an MTM test rig. This article reports some of the initial comparison of the numerical model and test results.
A thermomechanical finite-element model of the MTM (Figure 7) was built to understand the temperature increase for a non-conformal contact at defined slide-to-roll ratios (SRR) due to frictional heating. Ball-on-disk contact analysis was first run to generate the Hertzian contact profile. Based on the friction coefficient, entrainment speed, and SRR, the thermal load was calculated and applied with an initial 50/50 heat split on the disk and the ball. Abaqus user subroutine UMASFL was used to simulate the rotation of the ball and the disk to calculate its effect on heat dissipation. Convective heat coefficient was calculated using the method provided in [4]. The convective heat coefficient in the model was calculated using air as the experiment was conducted under drip lubrication. Both the ball and disc were fabricated from 52100 steel with a density of 7810 kg/m3, specific heat of 458 J/kg C, and thermal conductivity of 23.3 W/m C.
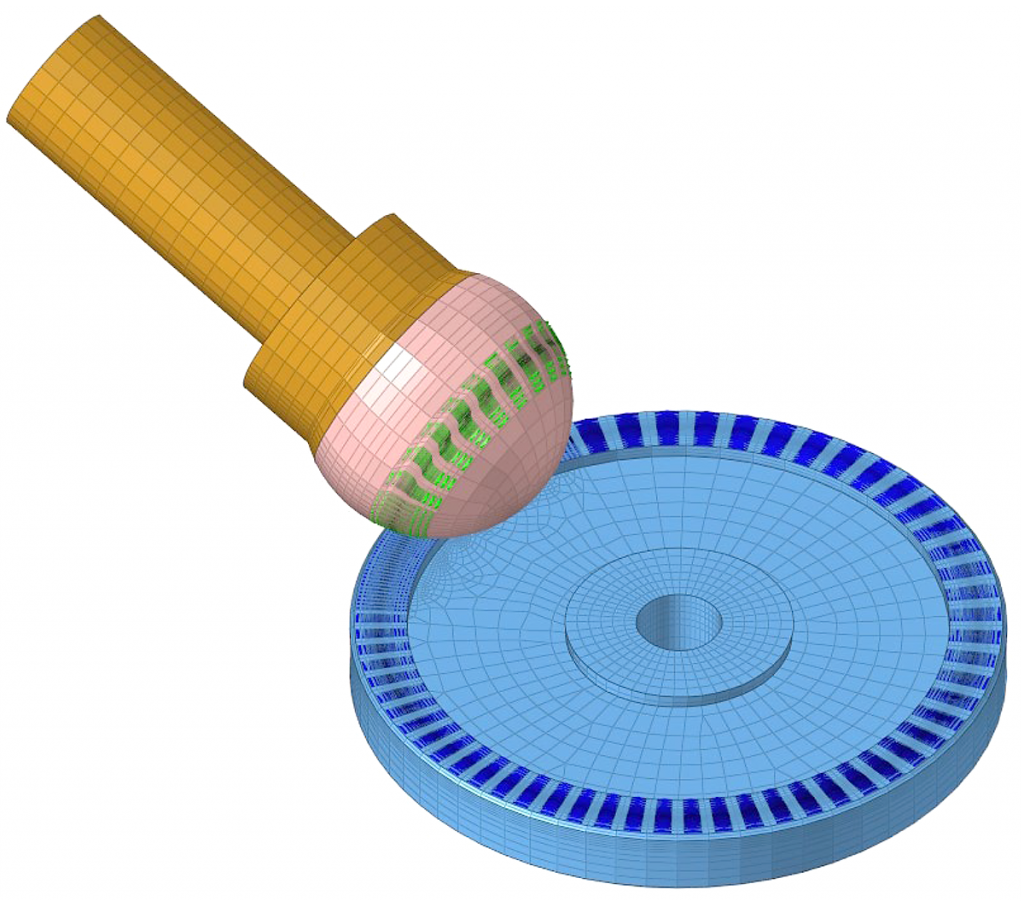
Figure 8 shows a typical temperature distribution for the thermal analysis with an initial temperature of 20°C. Heat bands can be observed following the rotational axes of the ball and the disk respectively with both parts heating up with time.
The model was run at the condition of 36.6N load (1 GPa), 3 m/s entrainment speed, and 50% SRR to compare with temperature measurements using an infrared camera of the same MTM test of a lubricant. A mean traction coefficient of 0.0806 was applied based on the MTM test measurement. The maximum Hertzian contact pressure used in this case is not uncommon when compared to actual gear contacts, although the entrainment speed is at the lower range of typical gear contact, such as those found in various FZG gear tests. It is worth pointing out that, once the modeling procedure is developed, it is trivial to change parameters such as contact load, SRR, and entrainment speed. In addition, the effect of lubricants on thermal response, such as lower traction of Polyalphaolefin (PAO), can be modeled and predicted.
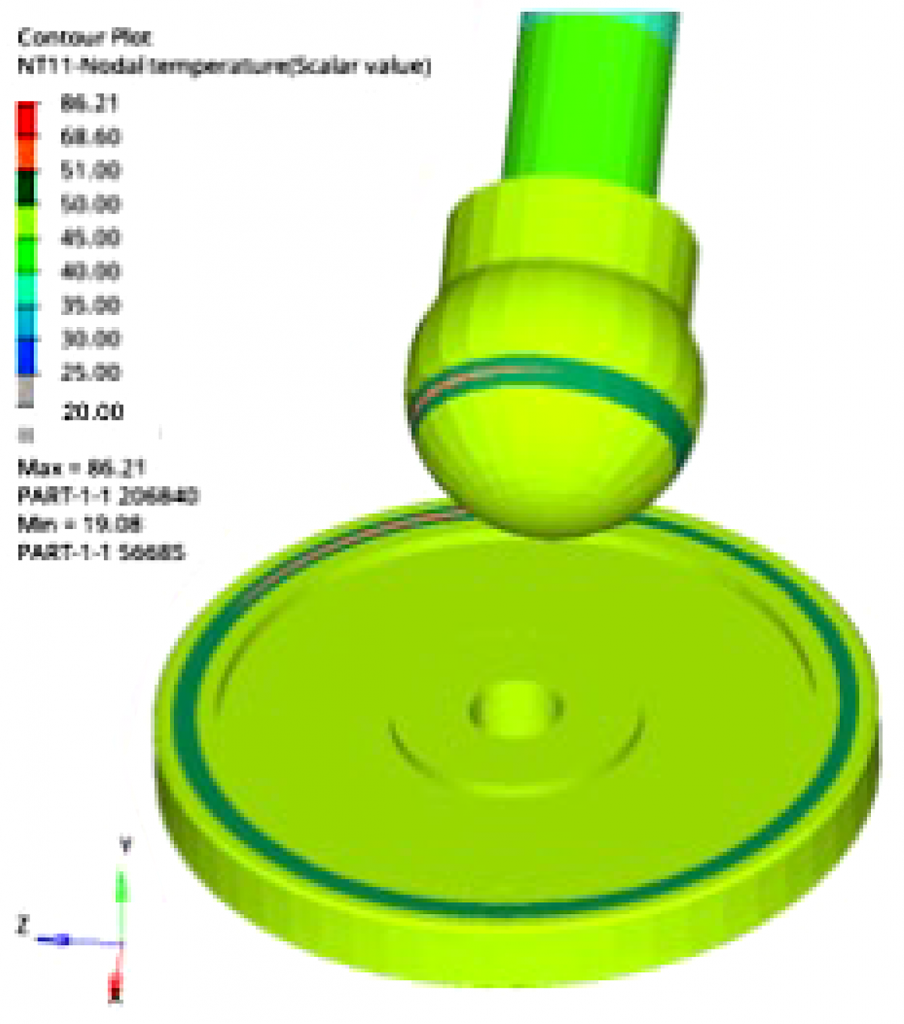
Figure 9 shows the comparison between model and experiment for the temperature rise for a single measurement point on the MTM disk. The model does a good job capturing the temperature increase over time as shown by the agreement. For this set of conditions, the disk track temperature reached equilibrium and rose by about 30°C in 20 minutes but increased by 20°C in only 5-6 minutes.
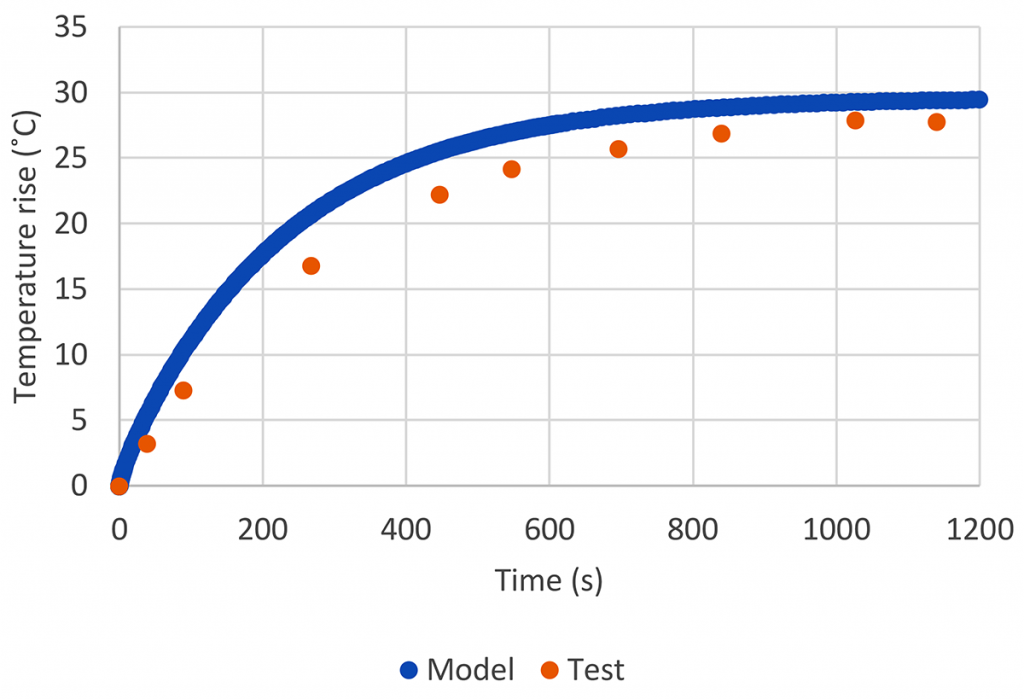
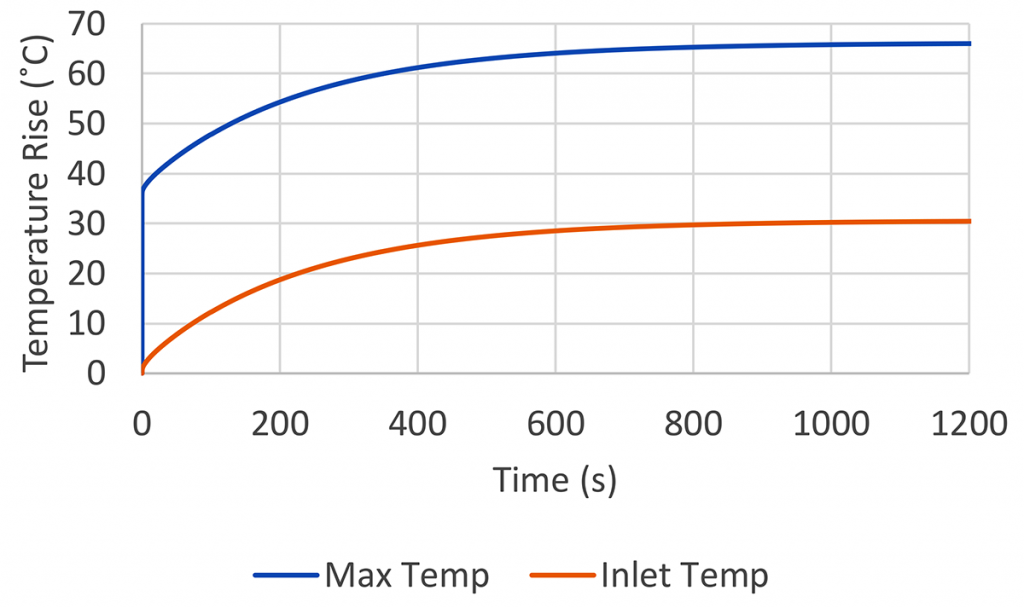
Figure 10 shows the calculated inlet and maximum temperatures of the contact at the specified conditions. Maximum temperature at the contact can be considered as a combined effect of the flash temperature and the temperature rise from the bulk. The temperature rise at the inlet will lead directly to a reduction in film thickness from the viscosity decrease of the gear oil, which can impact gear durability. Temperature rise at the contact also impacts energy efficiency and may trigger temperature-related failure mechanisms. The thermal effects during operation are critical as we balance durability vs. efficiency for gearbox designs.
3 Conclusions
Two aspects related to gearbox lubrication were investigated in this article. On gearbox churning, a computational fluid dynamics model was developed to simulate the oil flow in a simple gearbox. The churning loss of the gearbox was accurately modeled at low gear rotating speed while more discrepancy was observed at high speed. More studies are needed to understand the root cause of the discrepancy. On thermal response prediction of gear bulk teeth temperature, a model was developed for an MTM test rig and preliminary results show that the thermal response under frictional heating can be accurately predicted. The magnitude of the temperature rise identified in this study suggests that the impact of local frictional heating on oil film thickness in gear contacts is more significant than generally appreciated.
Bibliography
- M. Handschuh, A. Guner and A. Kahraman , “An experimental investigation of windage and oil churning power losses of gears and discs,” Proc IMechE Part J: J of Engineering Tribology, pp. 1-15, 2022.
- H. Liu, T. Jurkschat, T. Lohner and K. Stahl, “Determination of oil distribtuion and churning power loss of gearboxes by finite volume CFD method,” Tribology International, vol. 109, pp. 346-354, 2017.
- “AGMA 925-A03, Effect of Lubrication on Gear Surface Distress,” AGMA, Alexandria, VA, 2003.
- F. E. Kennedy, Y. Lu and I. Baker, “Contact temperatures and their influence on wear during pin-on-disk tribotesting,” Tribology International, vol. 82, pp. 534-542, 2015.


 general practice for CQI-9 and AMS2750E")


