


A thermal model was previously developed and executed to simulate the Wire Arc Additive Manufacturing (WAAM) process, using the Goldak Flux Distribution to model the welding heat source [1]. The present work focuses on the next step of the modeling process, the stress model.
The natural progression of heat-treatment modeling typically involves executing a thermal model first to predict the temperature changes during the process. Temperature history data are then used to drive the stress model to view results such as in-process and residual stress, phase evolution, distortion, and final hardness and microstructure. The results from the stress model can highlight areas of concern, such as geometric features, which can cause high levels of stress during the process (stress risers), or phase transformation timings, which can cause significant distortion. The results of a stress model can then be used to modify the original geometry, or green shape, to reduce distortion and eliminate stress risers. Process modifications can also be made to reduce the effect of high temperature gradients that will cause distortion in the part.
The stress and thermal models developed were simulated in Abaqus Standard, coupling the QustomWeld [2] and DANTE subroutines. QustomWeld was used to handle modeling the deposition and heating parameters. DANTE was used for the materials and phase transformation models.
Study
Some modifications to the previous thermal model were made before execution of the stress model to reduce the gross overheating shown in the first model and to improve model convergence.
A reduction of current during the process was used to reduce the overheating shown in the first analysis.
The mesh along the bead deposition was refined to better capture the thermal gradients present in the process.
The new mesh consists of 27,243 nodes and 21,920 elements (15,123 nodes and 12,000 elements previously).
The convective heat transfer coefficient was slightly increased for the entire process. Coupled with the reduction in current, each pass returns to room temperature during the five-minute cooling between passes.
The build plate material was AISI 1020, and the deposition layers were AISI 1006 low carbon steel.
Otherwise, all other parameters and geometry remain the same.
Low carbon steel is preferred for welding due to its low hardenability, and thus does not typically transform to hard, but brittle, martensite when air cooled. There is a large volume expansion when a steel transforms from austenite to martensite which can also cause high levels of tension in the heat-affected zone. From the analysis results, this filler metal transforms mainly to ferrite and pearlite.
The thermal gradients are extremely steep during the entire process due to the continuous molten pool of material being deposited. These gradients force the stress model to take short time increments to fully characterize the heat transfer during the process. Thus, each of the eight deposition passes required approximately 6,000 increments to solve. Calculation times differ from machine to machine, but this model was executed with eight cores on a workstation PC. The wall clock time for the analysis was just over three days, although a significant portion of that was writing results to the mechanical drive, while about a tenth of that was spent on the actual calculation. This illustrates the challenges of modeling any additive manufacturing process. To effectively model a full 3D printed part, a multi-node server or supercomputer would be required. Regardless, the software, technology, and modeling methods are available once the hardware technology has a chance to catch up.
Results
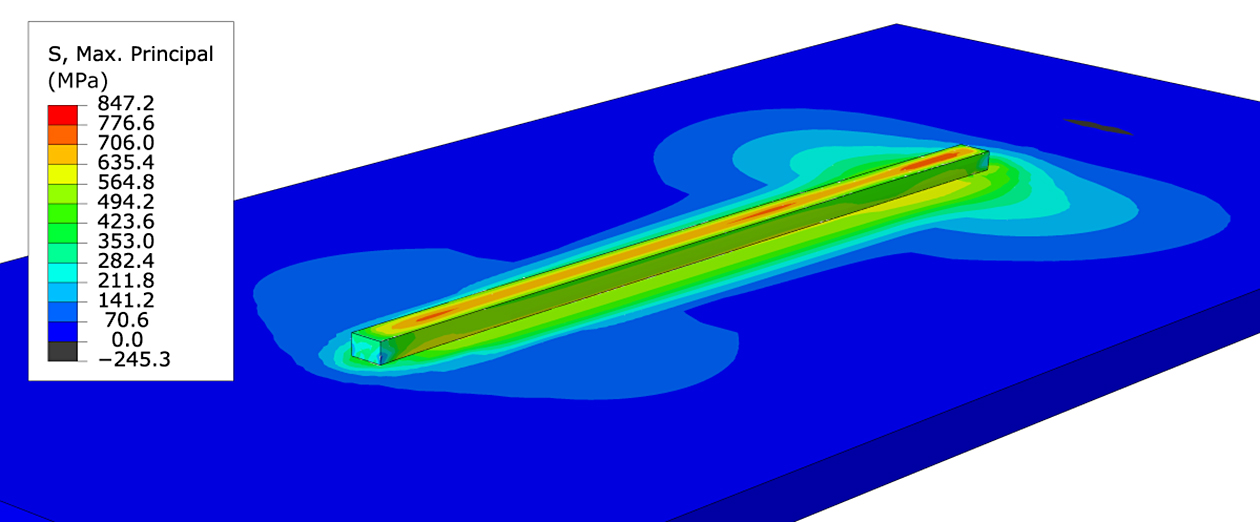
The results of the stress model show the dynamic changes in stress from pass to pass. Maximum principal stress is used to show the relatively high magnitude of stress during the process and is also used to show what regions are in tri-axial compression. Any region that has compressive maximum principal stress must be in compression in the X, Y, and Z directions. Figure 1 shows the maximum principal stress after the first deposition pass. The contour shows tension down the centerline of the bead at the end of every pass. This tension is mainly due to thermal effects during bead cooling, with some contribution from the phase transformations of the build plate below the weld.
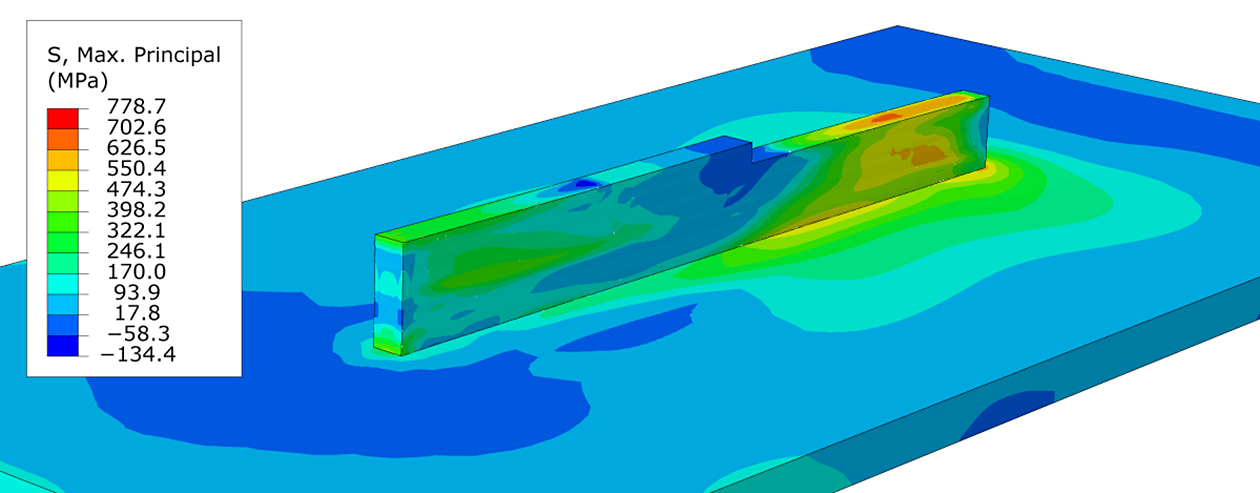
As subsequent passes build on top of each other, the previous passes are stress relieved and retransformed to austenite. Figure 2 shows in-process stresses halfway through pass five, with the tensile stresses being relieved ahead of the deposition. As the material is being deposited, there is tri-axial compression caused by the volume expansion of the material being heated. Also, there exists some compression behind the heat-affected zone along the build path. This compression can be explained by the solid-state phase transformation from austenite to ferrite and pearlite, and the associated volume expansion.
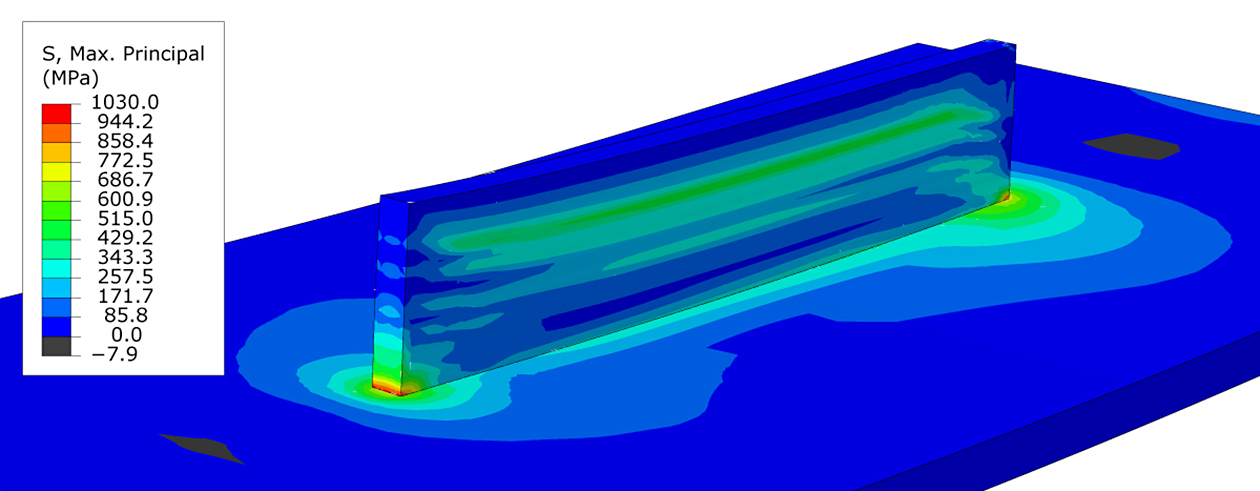
At the end of the process, tension and neutrality dominates the built wall, while tri-axial compression is almost nonexistent. The contour in Figure 3 shows how the stress gradients differ from pass to pass. Small neutral bands separate the tension pass-by-pass which gives the wall a tiger-striped appearance. High magnitudes of tension also reside in the corners where the first deposition layer attaches to the build plate. This high level of tension may cause the build to prematurely detach from the plate during the process, or even warp the build plate. Some additive manufacturing builds rely on this tension to easily separate the plate from the build, where differing materials, with different coefficients of thermal expansion, aid in the separation after reheating and quenching.
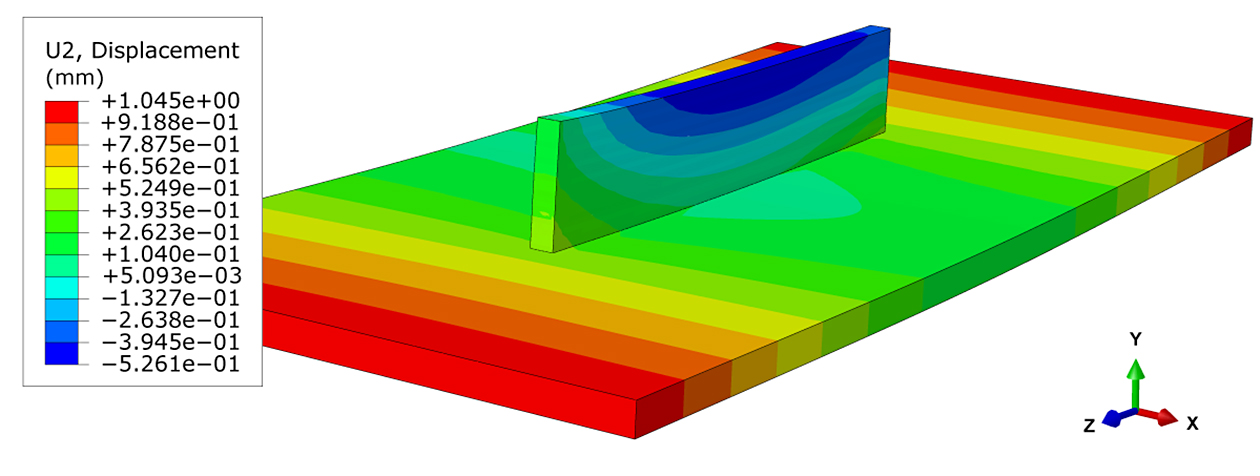
Finally, the distortion contour, Figure 4, shows the ends of the build plate curl up in the deposition direction after the process, while the wall dips slightly in the center. The model predicts about one millimeter of curl on each end of the plate, which is due to the cycles of thermal expansion in the center forcing the plate ends out and up. The dip in the center of the build is exaggerated by the bow in the build plate and is mainly due to the overheating caused by the deposition as each pass evolves.
The shrinkage is at a minimum at the start of each pass and increases as the wall heats up. At first, the thermal energy from each pass is quickly transferred to the wall and build plate, but as the wall temperature increases the heat transfer slows.
Conclusions
A thermal and stress model was successfully developed to simulate the wire arc additive manufacturing process, with the assistance of QustomWeld to help with the complicated events of the process and to setup the Goldak torch parameters, coupled with DANTE’s material and phase transformation models to predict in-process and residual stress, phase evolution, and distortion.
Additive manufacturing is becoming more reliable as processes are developed and refined. The models developed from this study, and the previous study, illustrate the challenges inherent to the WAAM process and shed light on issues that can be avoided before the first bead is even deposited. These results include the overheating shown from the thermal model and relatively high levels of tension shown in the stress model.
Distortion is also a huge concern if high-tolerance parts are to be manufactured. Industry moves so fast that there exists a culture of “print it and then find out” but, using analytical tools, build issues can be teased out before they become manufacturing headaches.
References
- Meyer, Jason M. “Using Welding Simulation Tools to Model WAAM.” Thermal Processing, 15 Sept. 2022.
- QustomApps: https://www.qustomapps.com/


 general practice for CQI-9 and AMS2750E")


