


Introduction
Induction hardening of steel components offers a fast heating rate, high efficiency, and the ability to heat locally. Induction hardening is a highly nonlinear multi-physical process with electro-magnetics, temperature, phase transformation, stress, and shape changes all occurring in the component. Compressive residual stress in the hardened case is beneficial to the high-cycle fatigue performance. Note however that material response to induction heating is not intuitive due to the highly nonlinear and transient phenomena of the hardening process, so predicting the final properties of a component after induction hardening is challenging. During hardening, magnetic properties change throughout the process, affecting thermal distribution and microstructure. Coupling these phenomena to reach the end properties after treatment requires state-of-the-art technology. Development of finite element analysis (FEA) has matured for both electromagnetic and thermal-stress modeling to include phase transformations during induction hardening, which are applied to understand and solve industrial problems [1-4]. FEA incorporates mechanical properties and residual stresses which are then imported to a loading model to analyze the mode and location of fatigue failures [5-6].
Modeling studies have led to the development of simulation techniques to predict electromagnetic and thermal effects, coupled with structural changes to predict a hardness pattern [7]. DANTE is a commercial FEA based software developed to model heat treatment of steel components, including furnace heating with liquid and gas quenching, and induction hardening with spray quenching [8-9]. An investigation of stress and distortion modeling of a simple case of ID and OD hardening of a tubular product has been reported [10]. Taking the modeling to the next step required studying a common industrial component with a more complex geometry subjected to external stresses in service, such as a full-float truck axle shaft with dimensions typical to those manufactured by Dana Corp. The axle shaft, a common automotive component, enables comparing simulation results to desired axle shaft properties. Results are compared with typical performance criteria for the case chosen. The ultimate goal of this ongoing study is to produce results representative of actual part performance. Because DANTE was not developed to model electromagnetic physics of induction heating, Flux software is used, and power distributions in terms of time and part geometry are imported into DANTE for phase transformation, stress and distortion analyses. Predicted residual stresses after heat treatment are then imported into a torsion load model to determine the effect of the residual stresses on shear crack initiation.
Discussion of Part, FEA Model and Heat Treatment
Truck Axle Shaft Geometry and FEA Model
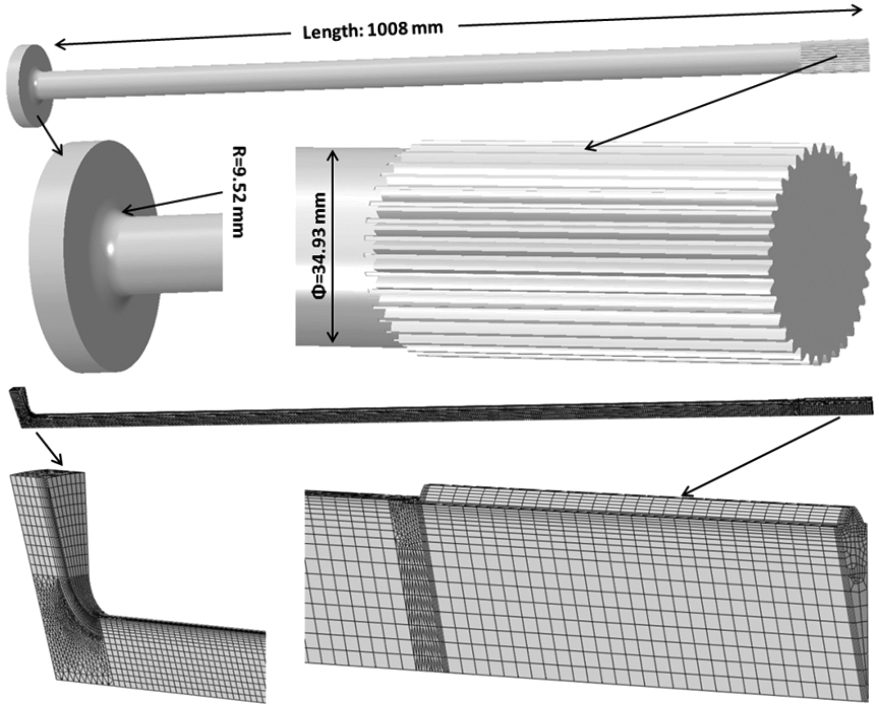
Axle shafts are surface hardened for durability to prevent failure in service. Hardening is commonly performed using induction scanning. How the process is performed affects resulting stresses and distortion. The main concerns during induction hardening of truck axle shafts over 1 m long are bowing distortion and axial growth. Bowing distortion can be minimized using proper inductor design, high quality process controls and structural support mechanisms. Excessive heat internal to the shaft is the main contributor to this problem, which can be evaluated by simulation. Change in length is affected by both shaft heating and cooling rates. A simplified CAD model of a full-float truck axle shaft from Dana Corp. is shown in Figure 1 (a).
Shaft dimensions are 34.93 mm diameter by 1008 mm long with a 9.52 mm fillet radius between the 104.5 mm diameter by 16.5 mm thick flange; the spline has 35 teeth. Figure 1 (b) shows the finite element mesh of a single tooth sector used for DANTE thermal, phase transformation, and stress analyses. Fine surface elements are used to effectively catch thermal and stress gradients in the surface.
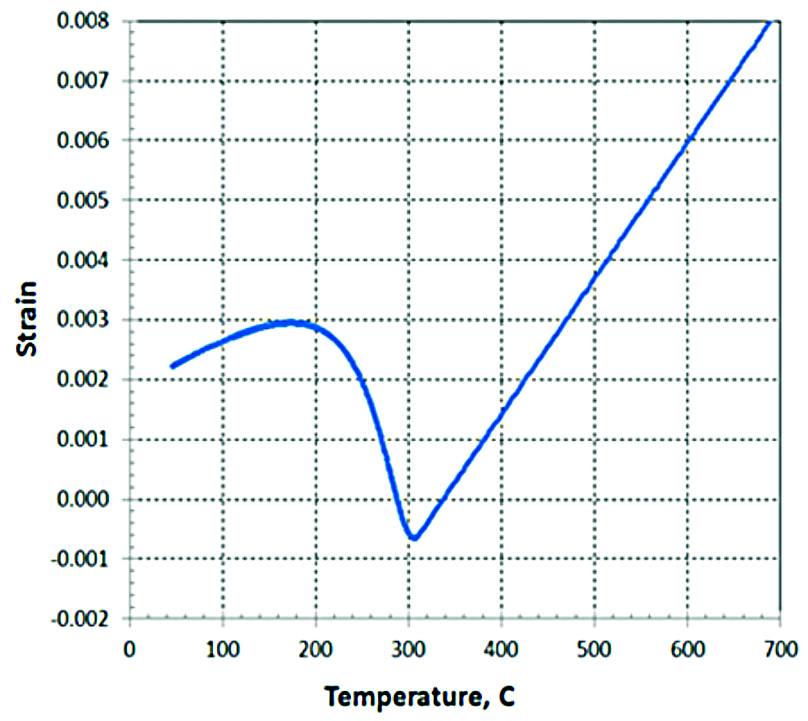
The axle shaft is made of AISI 1541, and the nominal chemical composition is used in the modeling study. Phase transformations are involved in both induction heating and spray quenching processes. During induction heating, the part surface transforms to austenite. During spray quenching, austenite transforms to martensite mainly, with a small amount of diffusive phases, such as ferrite, pearlite and bainite. Accurate descriptions of phase transformations and mechanical properties of individual phases are required for thermal stress analysis [11]. Dilatometry is a key method for acquiring such data. Figure 2 shows a dilatometry strain curve during martensitic transformation under continuous cooling. The dilatometry strain curve provides the martensitic transformation start temperature (Ms), martensitic transformation finish temperature (Mf), transformation strain, and coefficients of thermal expansion (CTE) for both austenite and martensite. Due to the high cooling rate from the spray quench after induction heating, the martensitic transformation is the main phase transformation type in this case study.
Heat Treatment Process
During heat treatment, the axle shaft is positioned vertically in the induction hardening unit, with the flange on the bottom of the fixture. The distance between the inductor and the spray is 25.4 mm. The process starts with a 9 s static heating period on the flange/fillet, followed by scanning with an inductor travel speed of 15 mm/s. After scanning for 1.5 s, scan speed is decreased to 8 mm/s and remains at this speed. Power is turned off after an additional 119.65 seconds; this occurs before the end of shaft is austenitized. Spraying continues after inductor power is turned off to complete transformation of the austenitized section of the shaft to martensite.
Inductor Design and Modelling of Power Density
It is critical not only to meet the hardened case depth requirement, but also prevent excessive heating in regions such as the flange, core and shaft end. Too much heat in these regions increases the possibility for cracking, and can also lead to excessive distortion. Minimum case depth requirement for the axle shaft is 5.4 mm, and the case depth is defined by a hardness of 40 HRC.
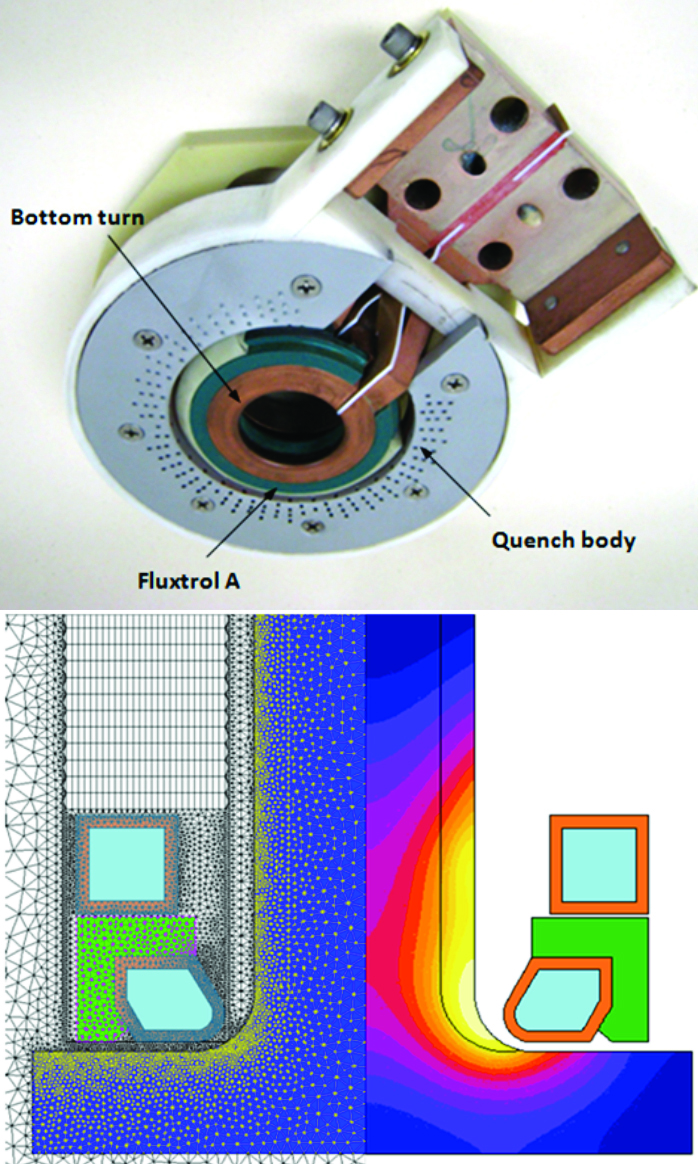
The inductor must be carefully designed to prevent cracking and excessive distortion. A machined two-turn coil with a magnetic flux concentrator was chosen and configured using Flux2D. Inductor optimization steps were followed [12]. An example of a fully assembled coil of this style is shown in Figure 3 (a).
The view is from the bottom of the coil. The bottom turn is profiled to help drive heat into the radius. The profile design is guided to provide the most amount of heat in the radius, while preventing a bulged heating pattern in the base of the shaft or on the flange. Flux concentrator Fluxtrol A was applied to the bottom turn to further assist in driving heat into the radius, and partially shield flux from coupling with the shaft to prevent a bulged pattern. The top turn is required to aid in the scan process by widening the heat zone on the shaft, enabling a faster scan speed. In Figure 3 (a), the green material is Fluxtrol A, surrounded by a grey quench body assembly. A quench body is mounted to the coil, which sprays quenchant about 25.4 mm below the coil. The quench is described in Flux2D by a heat transfer coefficient. The finite element mesh used to model the axle shaft by Flux2D is shown in Figure 3 (b), with a predicted temperature distribution focusing on the flange and the fillet regions.
Power Density Mapping from Flux2D to DANTE
The shaft material is magnetic, and the power density distribution changes greatly when the temperature exceeds the Curie point. The inductor frequency is 10 kHz, which is a common operating frequency of the Dana induction machines used for this class of parts. A difference in skin heating effect is observed during the scan of the shaft. The portion of the shaft above the bottom turn has a high skin effect because it is below the Curie temperature. The bottom turn provides more intensive heating, which drives the case depth and results in a deeper penetration of power at its heat face. Specifically, Flux2D calculates when to turn off power at the end of the process by determining the temperature profile as the coil approaches the edge of the spline.
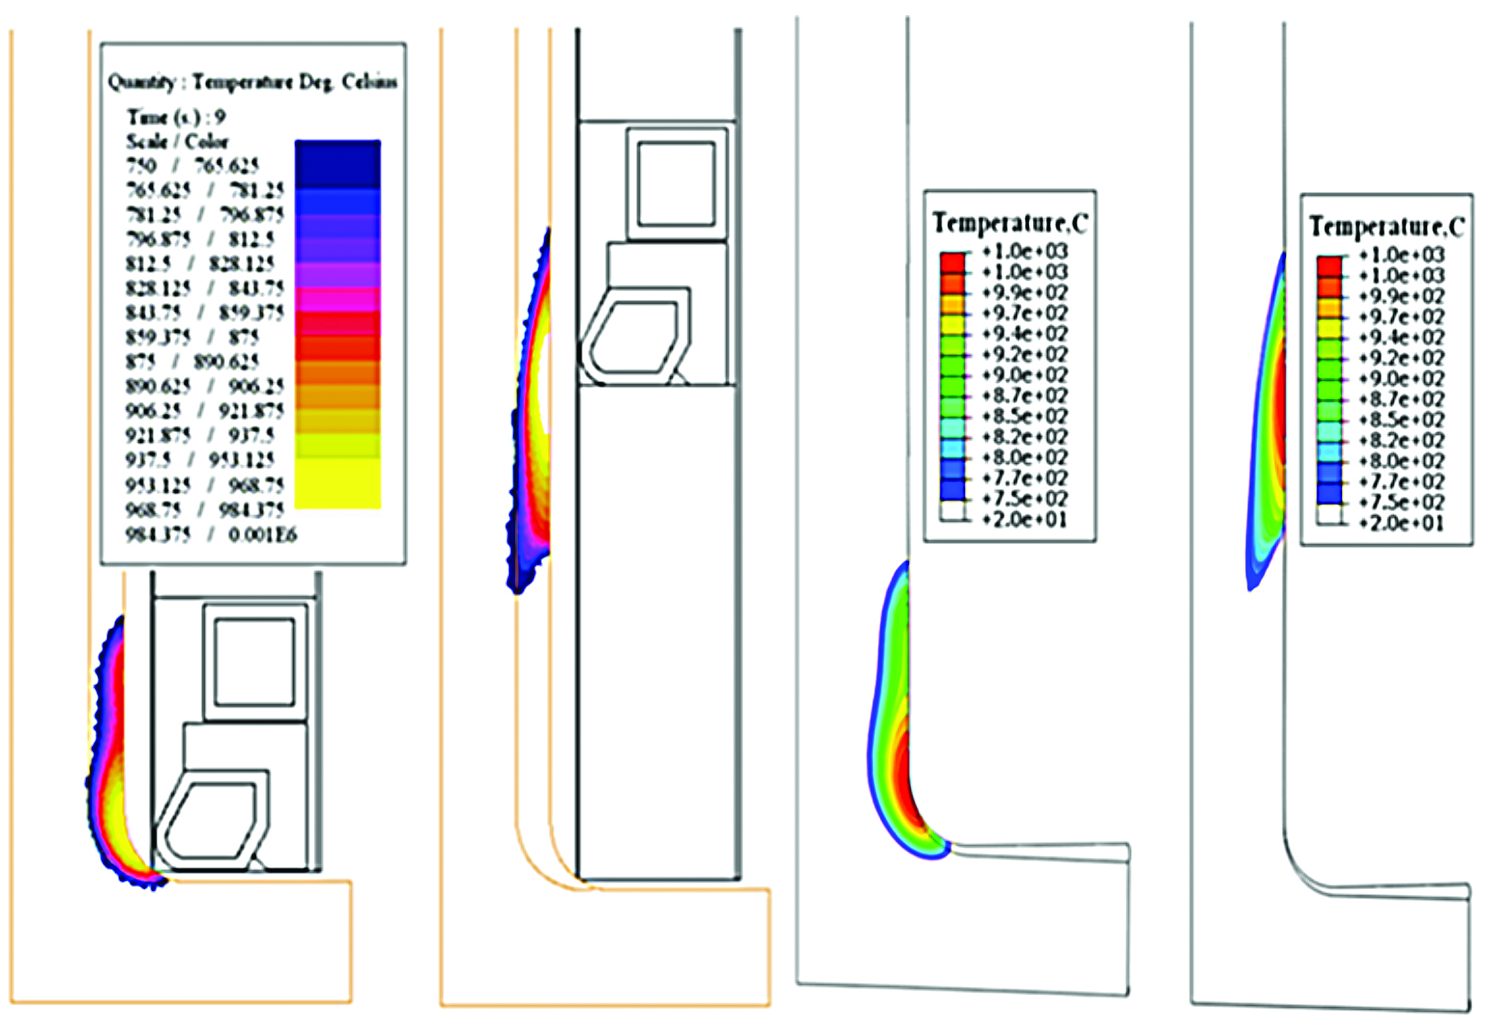
Different finite element meshes are used for the Flux2D and DANTE models due to different physics and accuracy requirements. Power densities in the axle shaft predicted by Flux2D are imported and mapped into DANTE. Temperature distributions predicted by Flux2D and DANTE at various times of the process are compared, as shown in Figure 4. The temperature profiles predicted from the two packages have reasonable agreement.
Induction Hardening Process Modeling
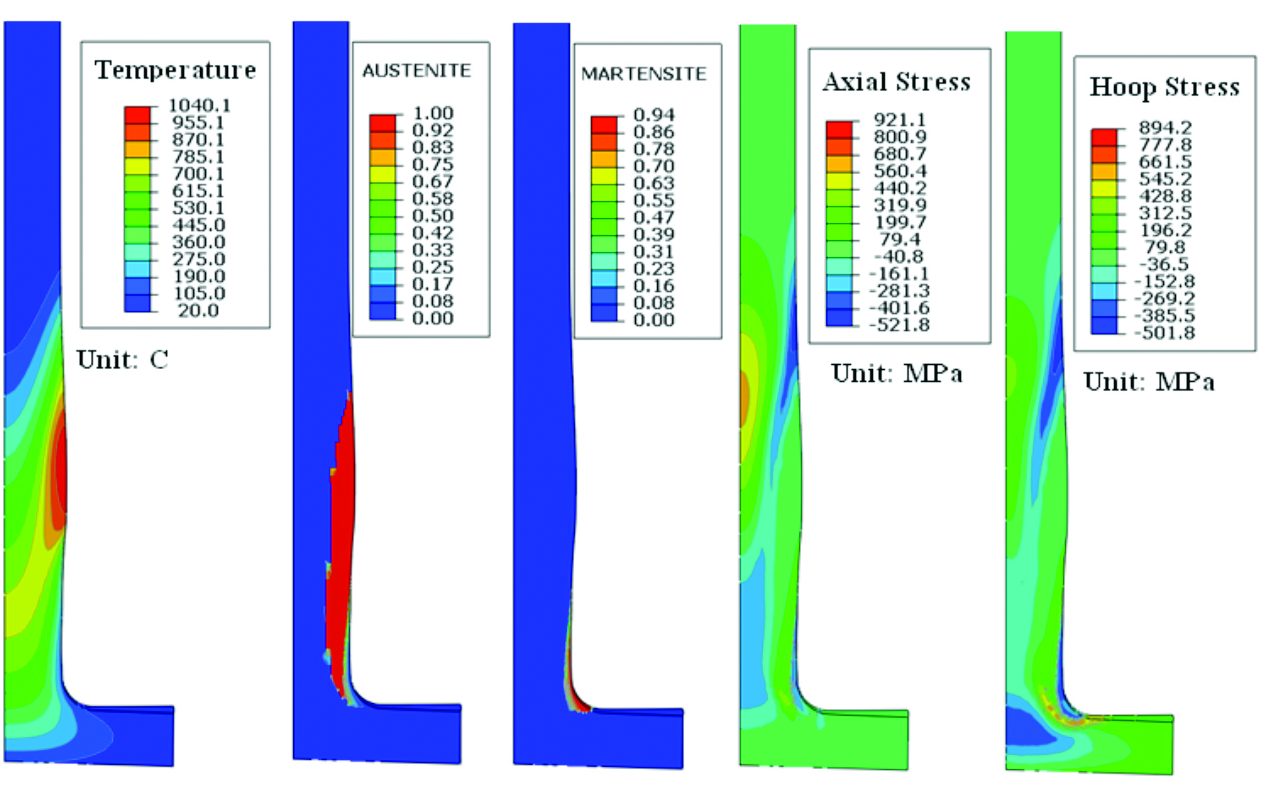
As described, the first step of the induction hardening process is a 9 s dwell, during which time the inductor is stationary and there is no spray quenching. Next, the inductor moves up with a speed of 15 mm/s for 1.5 s, then drops to 8 mm/s and spray quenching is initiated. Spraying then continues for the duration of the process. Power and temperature distributions are stable during scanning period over most of the shaft length. Figure 5 shows a snapshot of temperature, austenite, martensite, axial stress, and hoop stress at 16.5 s during induction hardening process using heat transfer boundary condition of 12 kW/m2·C. During spraying quenching, the austenite layer transforms to martensite. Figure 5 (e) is a snapshot of an in-process hoop stress distribution, which intuitively shows the effects of thermal gradient and phase transformation. The predicted nodal displacements in Figure 5 are magnified ten times to clearly show shape change. The same inductor power is applied to the spline region, and power is turned off after 130.15 s of total process time before the end of the spline section is austenitized.
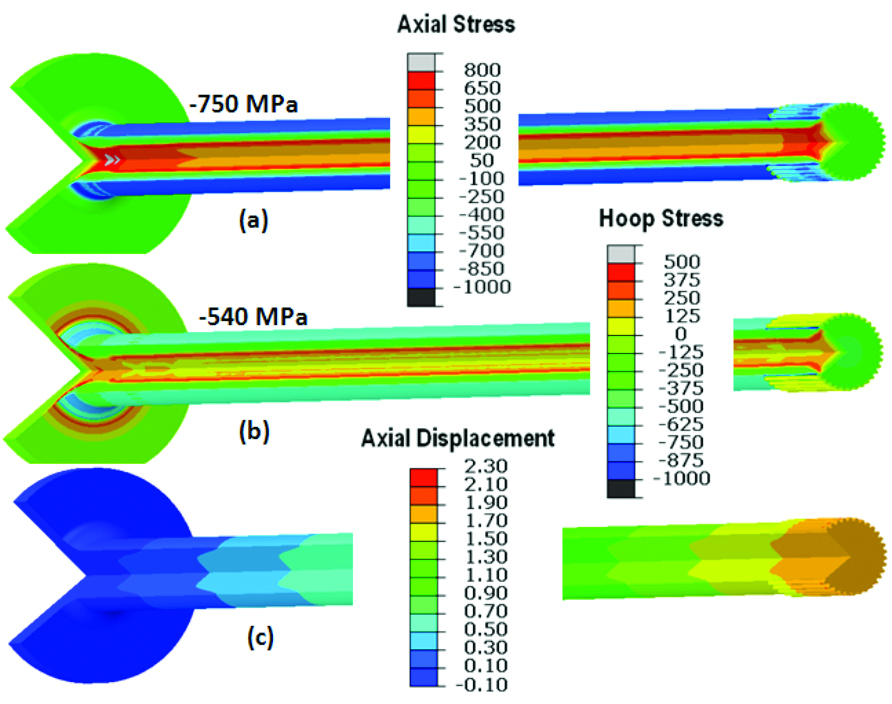
Cooling rate has a significant effect on residual stresses obtained from quench hardening, and a detailed study of the cooling rate effect is given in [13-14]. For a heat transfer coefficient of 12 kW/m2·C, the residual stresses and axial distortion after induction hardening are shown in Figure 6. The highest tensile stress in the axial direction is located at the centerline of the shaft above the flange. Predicted axial residual stress is 750 MPa compression on the shaft surface, and the predicted hoop residual stress is 540 MPa compression. The magnitude of axial residual stress is higher than that in the circumferential direction. The effect of these stresses on shear crack generation is discussed later. Predicted axial growth is about 1.7 mm, as shown in Figure 6 (c). Axial displacement in the shaft is not linearly distributed along the axis, because it is not stabilized during early scanning process of the shaft.
Low Temperature Tempering Process and Torsion Load Modeling
After induction hardening, the shaft is furnace tempered at 175˚ C for 1 h to improve the ductility and toughness of the hardened case. The change in residual stress from tempering is shown in Figure 7 and Figure 8 for both the axial and circumferential directions. The magnitude of stress reduction caused by tempering is approximately 15%. During tempering, brittle as-quenched martensite transforms to more ductile tempered martensite, sacrificing some hardness and strength. Microstresses concentrated on grain boundaries and interfaces between the matrix and the carbides are also effectively reduced.
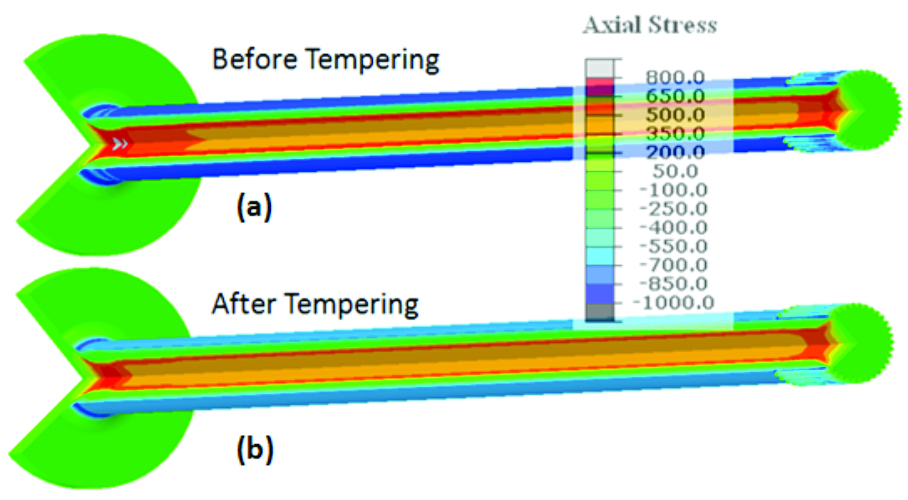
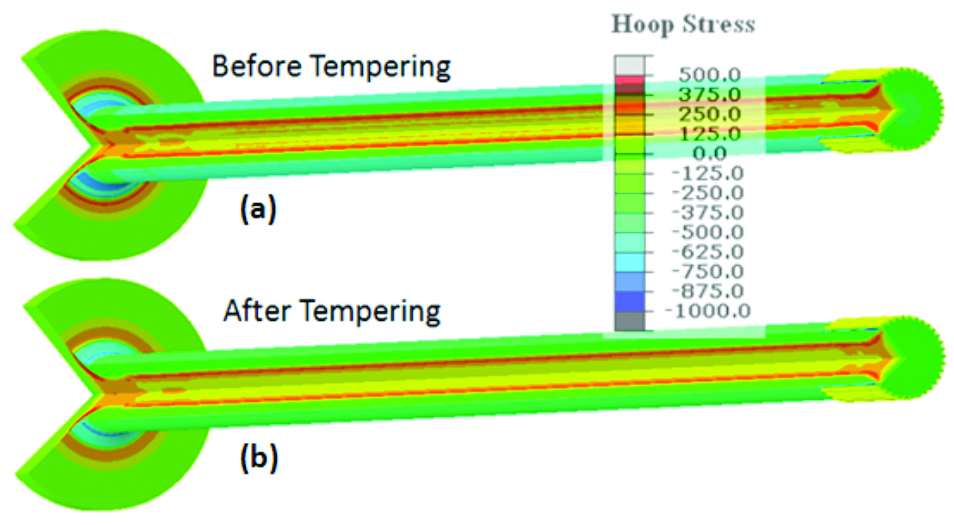
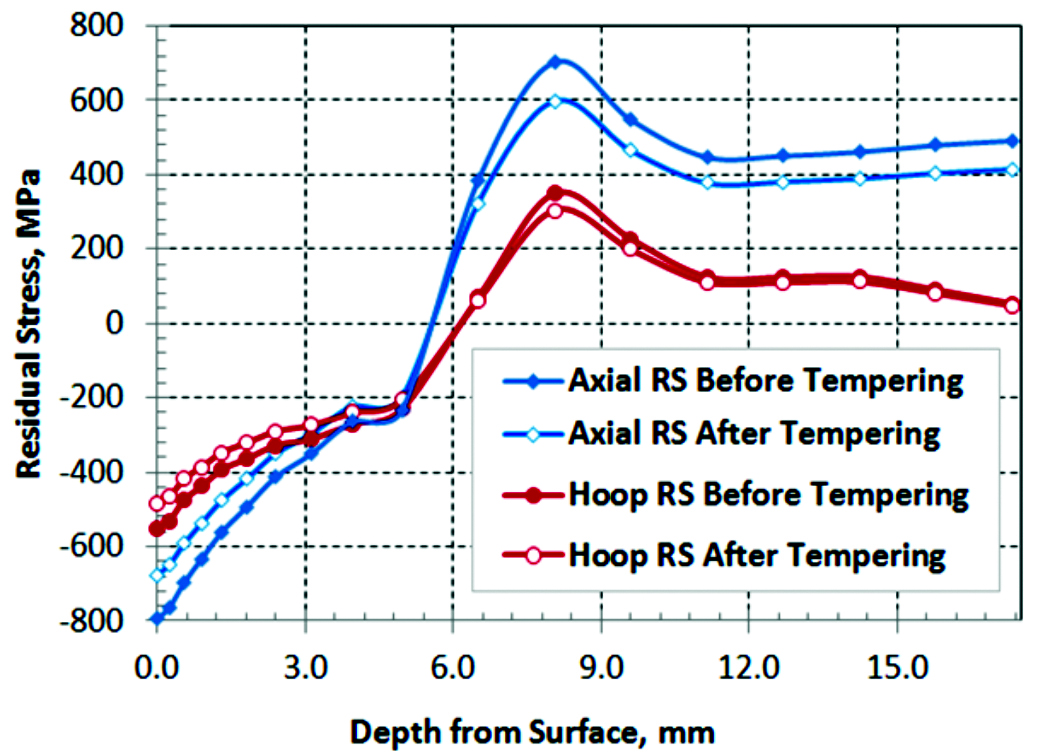
The magnitude of residual stress in the axial direction is higher than that in the circumferential direction, which is true for both the as-quenched and tempered conditions. Away from the flange and the shaft splines, the residual stress distribution along the shaft is relatively uniform. Selecting a straight line of points starting from the shaft surface, residual stresses before and after tempering are compared in Figure 9. The x-axis of Figure 9 represents the depth of the point from the shaft surface, and the y-axis represents the magnitude of residual stresses in both axial and circumferential directions. A positive stress value indicates tension, and a negative value indicates compression. After tempering, residual compression in the axial direction is reduced from 750 to 675 MPa. Residual compression in the circumferential direction is reduced from 550 to 485 MPa.
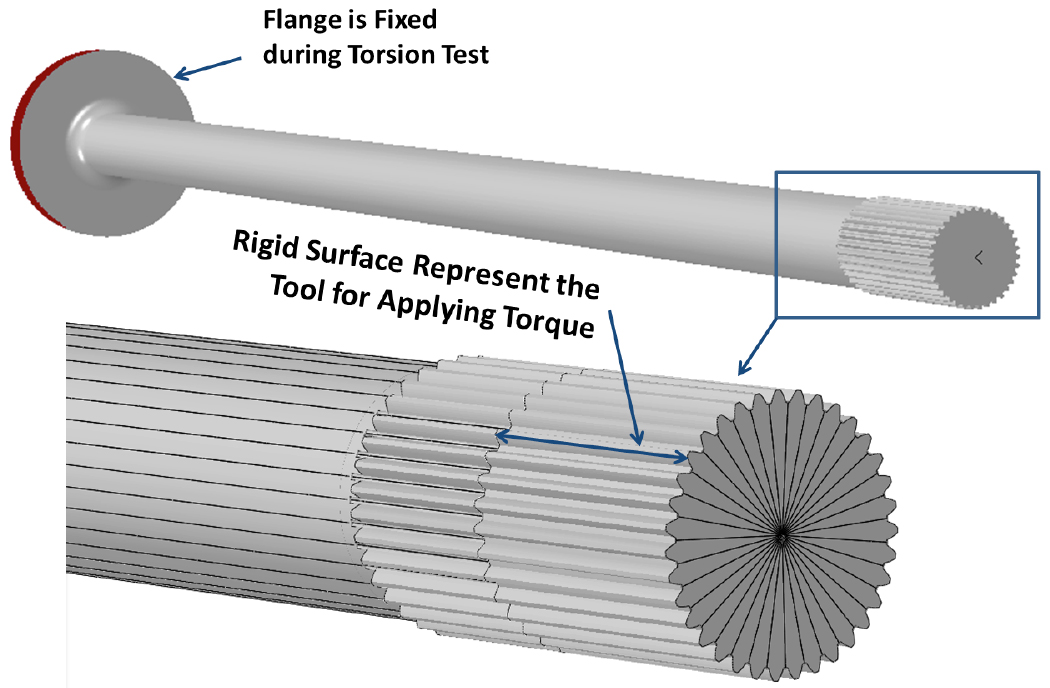
The stress state after the tempering process is imported to a loading model to analyze stresses in the axle shaft during overload and torsional fatigue tests. To mimic loading conditions and constraints from the torsion fixture, the OD of the flange is constrained in the model, as shown in Figure 10. A rigid surface is used to represent the tool applying a torsion load to the splines of the axle shaft. In this model, the rigid surface covers approximately one half of the spline in the axial direction of the axle shaft.
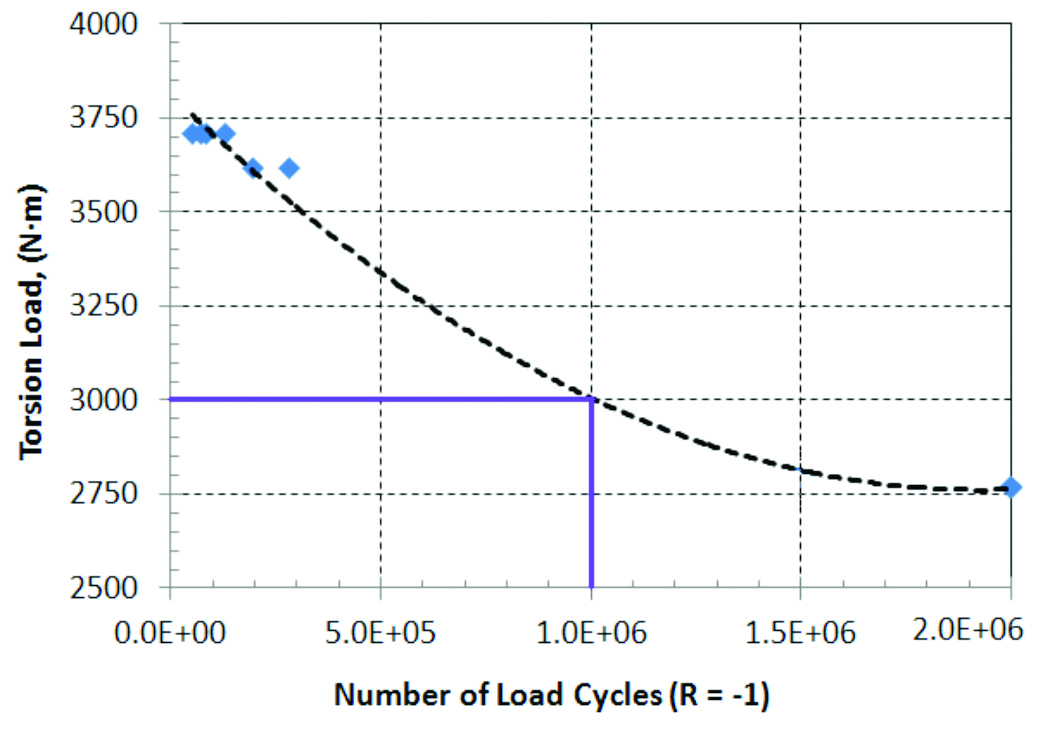
Reported torsional yield strength from overload tests by DANA is 6,090 N·m, and the reported high cycle fatigue limit (2 million cycles) is 2,768 N·m. During the fatigue test, a fully reversing load (R = -1) is applied, and several fatigue test points are shown in Figure 11. The dotted line is a fitted S-N curve of the fatigue test results, with 2,768 N·m as the endurance limit.
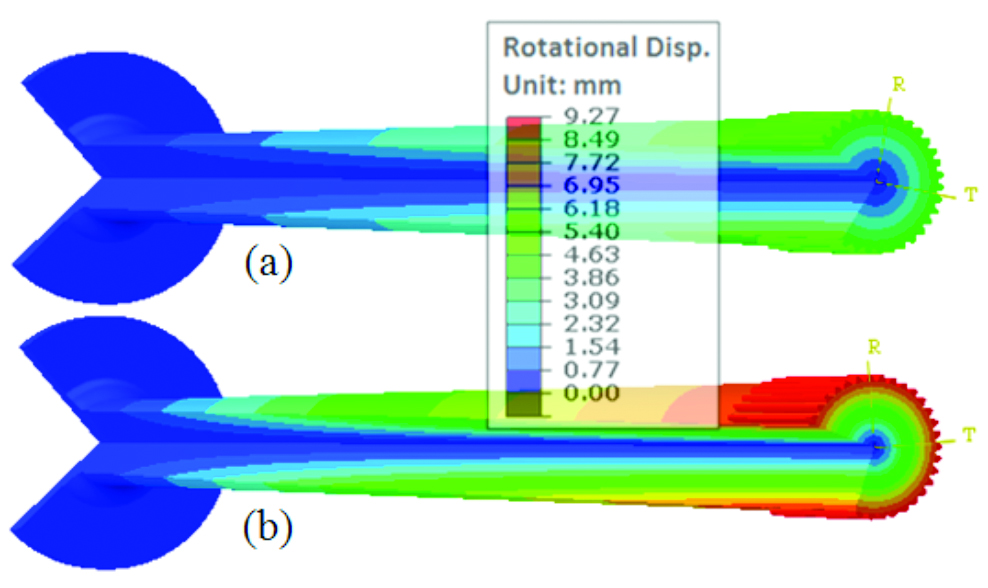
In this study, the loading model assumes the axle shaft remains in the elastic region, with a maximum applied torsion load of 6,000 N·m. The Young’s modulus in the model is 207 GPa and the Poisson ratio is 0.3. Two loading conditions are selected from modeling results. The 6,000 N·m torque load is slightly below the material yield strength, and 3,000 N·m represents a condition slightly above the fatigue limit. Rotational displacements under these torsional load conditions are shown in Figure 12. The maximum torsion displacement under 6,000 N·m torque is about 9.27 mm, and under 3,000 N·m torque is 4.64 mm. While in the elastic range, torsion displacement is related linearly to the applied torque, which is independent of the residual stresses.
Predicted shear stresses under the two specific loads are shown in Figure 13. Shear stress generated during torsion is independent of the incoming residual stress state. The magnitude of shear stress obtained from induction hardening is negligible, so it has no impact on shear stress generated during torsion testing. The magnitude of the shear stress does have a linear relationship to applied torque.
Figure 14 shows typical fracture surfaces for high-cycle fatigue and overload tests. During a high-cycle fatigue test conducted under a pure torsional load, the crack initiates on the shaft surface. The crack initially grows in the longitudinal direction for several millimeters, then propagates at an angle of 45 degrees. During the overload test, cracks initiate either on the shaft surface or spline surface. The fixture used to apply torsional load to the spline can affect the magnitude of concentrated stress in the spline. For example, if the fixture covers the spline in the axial direction, the crack most likely will not initiate on the spline surface.
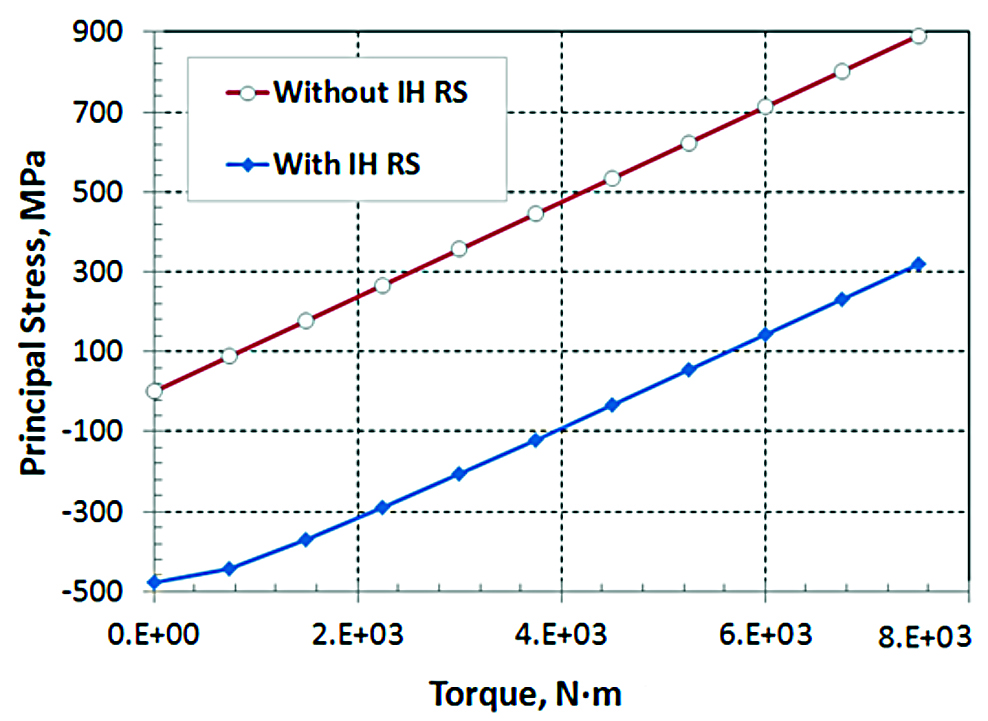
Compressive residual stresses obtained from induction hardening benefit high-cycle fatigue performance of the axle shaft. As shown in Figure 13, predicted shear stresses from the induction hardening models are negligible, and shear stresses under torsion load are the same whether residual stresses from the hardening process are or are not considered. Figure 15 shows the calculated maximum principal stresses under torsion load conditions of 3,000 and 6,000 N·m.
If incoming residual stresses are not considered, the maximum principal stress on the shaft surface is about 720 MPa under the torsional yield load of 6,000 N·m, as shown in Figure 15 (c). The stress magnitude is predicted to be 150 MPa on the surface when residual stresses are taken into account. For the high cycle fatigue test under pure torsion load, crack initiation and growth is directly related to the maximum principal stress instead of shear stress. Figure 15 (b) and (d) show that the maximum principal stress is located at the case/core interface instead of the shaft surface. With a 6,000 N·m torque load, the magnitude of the tensile stress under the surface is about 750 MPa when accounting for the incoming residual stress state.
During either overload testing or fatigue testing under pure torsion, shear stress is generated in the shaft. Selecting a reference point on the surface of the shaft, the direction of the generated shear stress in the longitudinal and circumferential directions is shown schematically in Figure 16. Without considering residual stresses from the hardening process, axial stress and hoop stress are both zero. Therefore, shear stress is the only stress contributing to cracking. The directions of principal stresses generated by the shear stress are ±45 degrees, and maximum principal stress in the +45 degree direction is the direct cause of the fracture. The factors become more complicated with the existence of residual stresses. Figure 16 represents the stress state of a surface point on the shaft, including residual stresses in both circumferential and axial directions, as well as the shear stresses from the torsion load. Compressive residual stresses reduce the magnitude of tensile principal stress as shown in Figure 15, which is why compressive residual stresses benefit high-cycle torsion fatigue performance. During overload testing, residual stresses are eliminated by plastic deformation, and compressive residual stresses are not expected to benefit the ultimate strength of the axle shaft.
Principal stresses generated in approximately a 45 degree angle are calculated, and results are plotted in terms of the torsion load. The curve with hollow round marks represents the principal stress without residual stresses from induction hardening; the magnitude of principal stress as a function of the torsion load is linear. With compressive residual stresses, the principal stress is about 475 MPa lower, as shown by the curve with diamond marks in Figure 17, and the relationship between principal stress and the torsion load is not linear, especially under lower torsion loads.
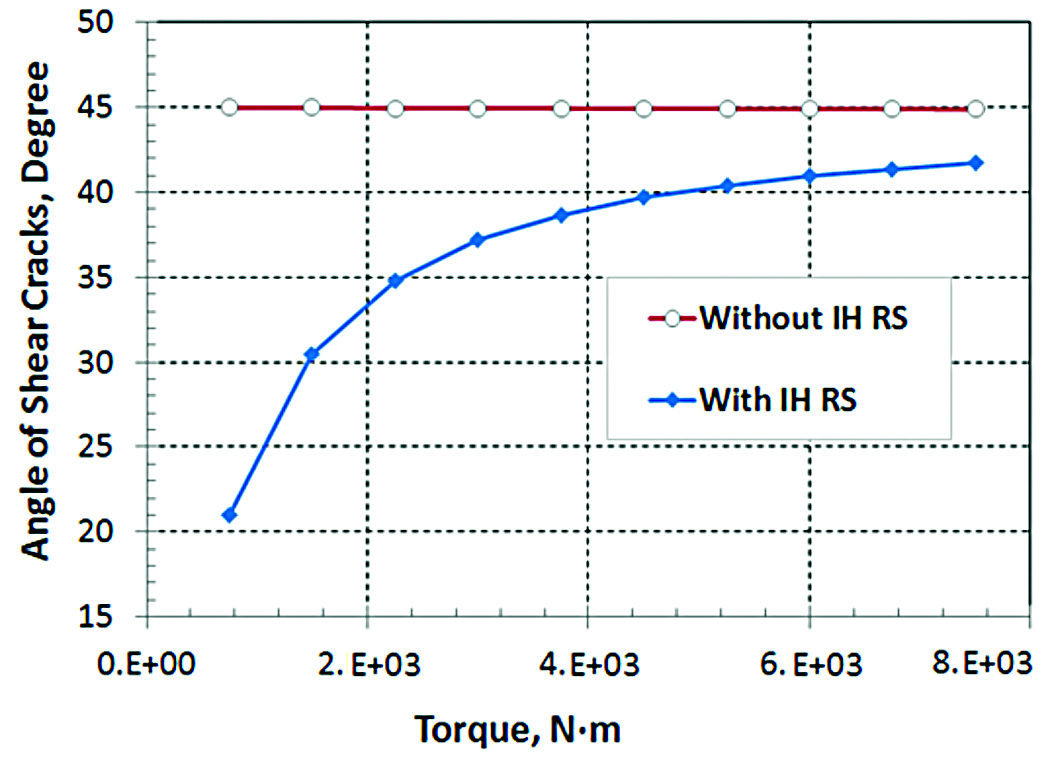
The reason for the nonlinear relationship between principal stress and torsion load is because of the change in direction of the principal stress. Figure 18 shows a plot of direction of principal stress vs. torsion load. It shows the effect of the residual stress can be significant on the facture angle.
Conclusions
The electromagnetic modelling using Flux2D and thermal-stress modelling using DANTE are successfully coupled to simulate the inducting hardening process of an axle shaft. The power mapping process from Flux and DANTE is validated by directly comparing the temperature profiles predicted by the two packages. The residual stresses predicted from the induction hardening model are imported to a low-temperature tempering model, and the magnitude of the stress decrease is approximately 15%. The residual stresses from the tempering model are imported to a loading model to estimate the stresses for high cycle torsion fatigue and overload testes. The loading models have shown clearly how the residual stresses from the induction hardening benefit the fatigue performance.
References
- G. Goldstein, G.,V. Nemkov, V.,and J. Jackowski, J. (2009) Virtual Prototyping of Induction Heat Treating. , 25th ASM HTSeat Treating Society ConferenceConf., 2009.
- D. Ivanov, D., Markegard, L., Asperheim, J., and Kristoffersen, H.et al., “Simulation of Stress and Strain for Induction-Hardening Applications”, Journal J. Matls. Engrg. and Perf., published online, July 18, 2013.
- B. Ferguson, B., and W. Dowling, W., “Predictive Model and Methodology for Heat Treatment Distortion”, NCMS Report #0383RE97, 1997.
- V. Warke, R. Sisson, and M. Makhlouf, FEA Model for Predicting the Response of Powder Metallurgy Steel Components to Heat Treatment, Mater. Sci. Eng., A, 518(1–2), p 7–15, 2009.
- Z. Li and B. Ferguson, Computer Modeling and Validations of Steel Gear Heat Treatment Processes using Commercial Software DANTE, J. Shanghai Jiaotong Univ. (Sci.), 16(2), p152-156, 2011.
- B. Ferguson, A. Freborg, and A. Li, Residual Stress and Heat Treatment – Process Design for Bending Fatigue Strength Improvement of Carburized Aerospace Gears, J. of HTM. , Härterei-technische Mitteilun, 62(6), 2007, p 279-284, 2007.
- Z. Li, Z., Ferguson, B., and Goldstein, G., Nemkov, V., Jackowski, J., and Fett, G.et al., “Modeling Stress and Distortion of Full-float Truck Axle during Induction Hardening Process”, 27th ASM HTS eat Treating Society Conference., 2013.
- D. Bammann, D., et al., “Development of a Carburizing and Quenching Simulation Tool: A Material Model for Carburizing Steels Undergoing Phase Transformations”, Proceedings Proc. of the 2nd Intl.ernational Conf.erence on Quenching and the Control of Distortion, November (1996), pp. 367-375, Nov. 1996.
- B. Ferguson, B.,A. Freborg, A., andG. Petrus, G., “Software Simulates Quenching”, Advanced Materials and Processes, H31-H36, Aug.ust (2000).
- V. Nemkov, V., G. Goldstein, G., and J. Jackowski, J. (2011). Stress and Distortion Evolution During Induction Case Hardening of Tube. , 26th ASM HTSeat Treating Society Conf.erence, 2011.
- Z. Li, Z., B. Ferguson, B., and A. Freborg, A., “Data Needs for Modeling Heat Treatment of Steel Parts”, Proc.eedings of Materials Matl. Science Sci. & Technology Tech. ConferenceConf., 2004, pp. 219-226, 2004.
- R. Goldstein, R.,V. Nemkov, V., and R. Madeira, R., (2007). Optimizing Axle-Scan Hardening Inductors. , Industrial Heating, December Dec. 2007.
- B. Ferguson, B.L.,A. Freborg, A.M.,and Z. Li, Z., “Probe Design to CharactrizeCharacterize Heat Transfer during Quenching Process”, Proceedings Proc. of 6th International Quenching and Control of Distortion ConferenceConf., Chicago, Illinois, September 9-13, 2012, pp. 792-801, Sept. 2012.
- A. Banka, A., Franklin, J., Li, Z., Ferguson, B.L., and Aronov, M.et al., “Applying CFD to Characterize Gear Response during Intensive Quenching Process”, Proceedings Proc. of the 24th ASM HTS eat Treating Society ConferenceConf., September 17-19, 2007, pp. 147-155, 2007.


 general practice for CQI-9 and AMS2750E")


