


In the last article, we described a method of calculating the Grossman H-Value [1]. In the article before last, we described a method of using the Lamont charts [2] to predict hardness based on the Jominy test, and an assumed Grossman H-Value. In this column, we are going to look at different methods of property prediction and see how they compare. In the first method, we are going to use the classical Grossman H-Value and the Lamont charts. In the second method, we are going to use the Swerea Smart Quench Integra [3]. We are going to use JMatPro [4] for the calculation of necessary data. We will then compare the results.
Quenchant
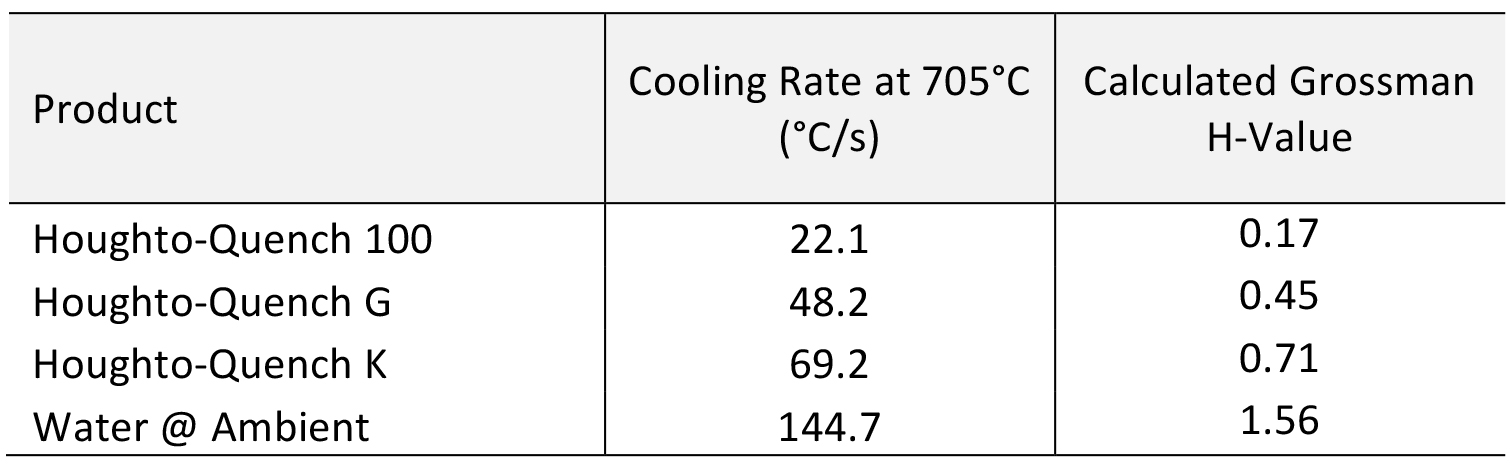
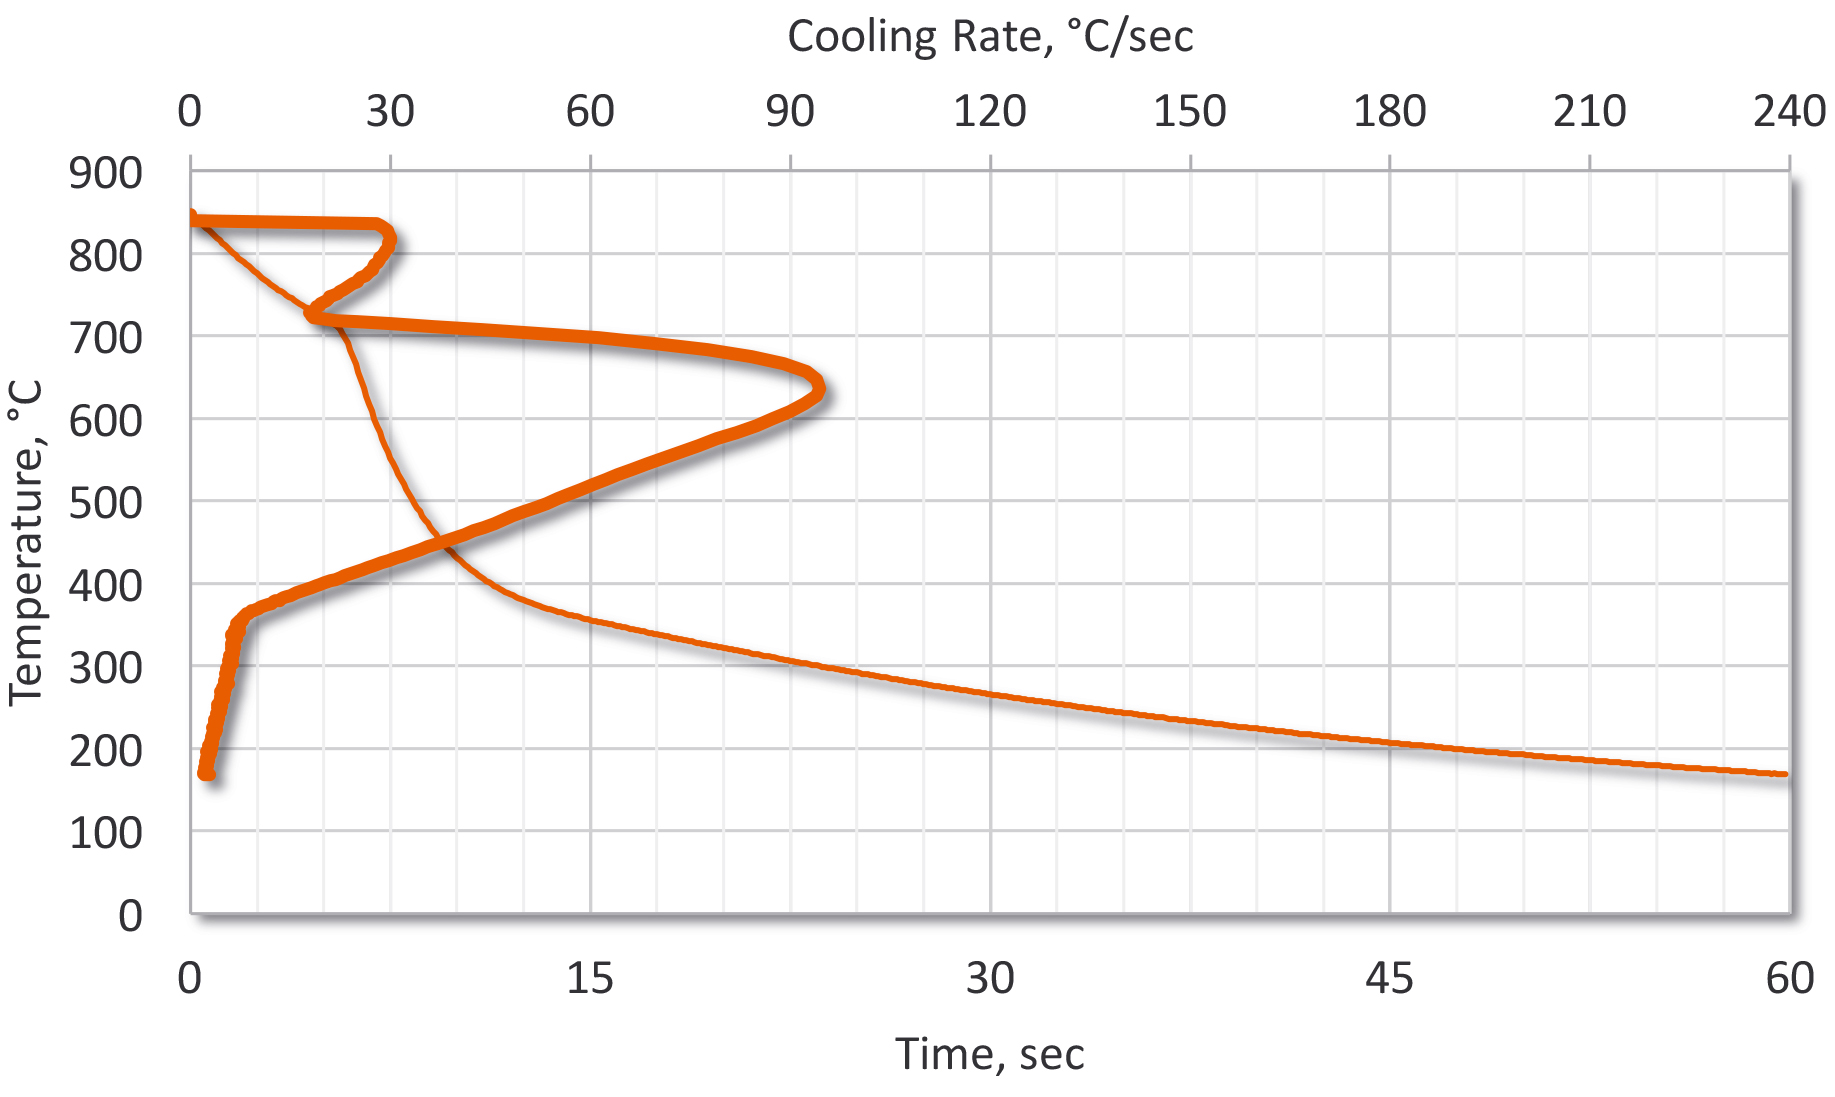
For the quenchant, we will use a medium speed general purpose quenchant (Figure 1). This quenchant has a cooling rate of 48.2°C/s at 705°C. Please note that Table 1 is different from the table in the previous article. This is due to a unit conversion error I made in the last article. I apologize for the mistake.
Material
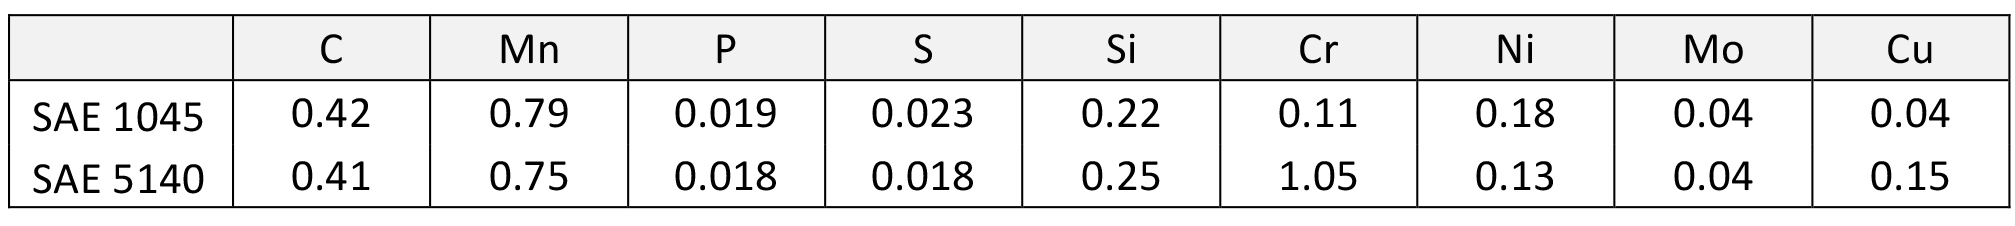
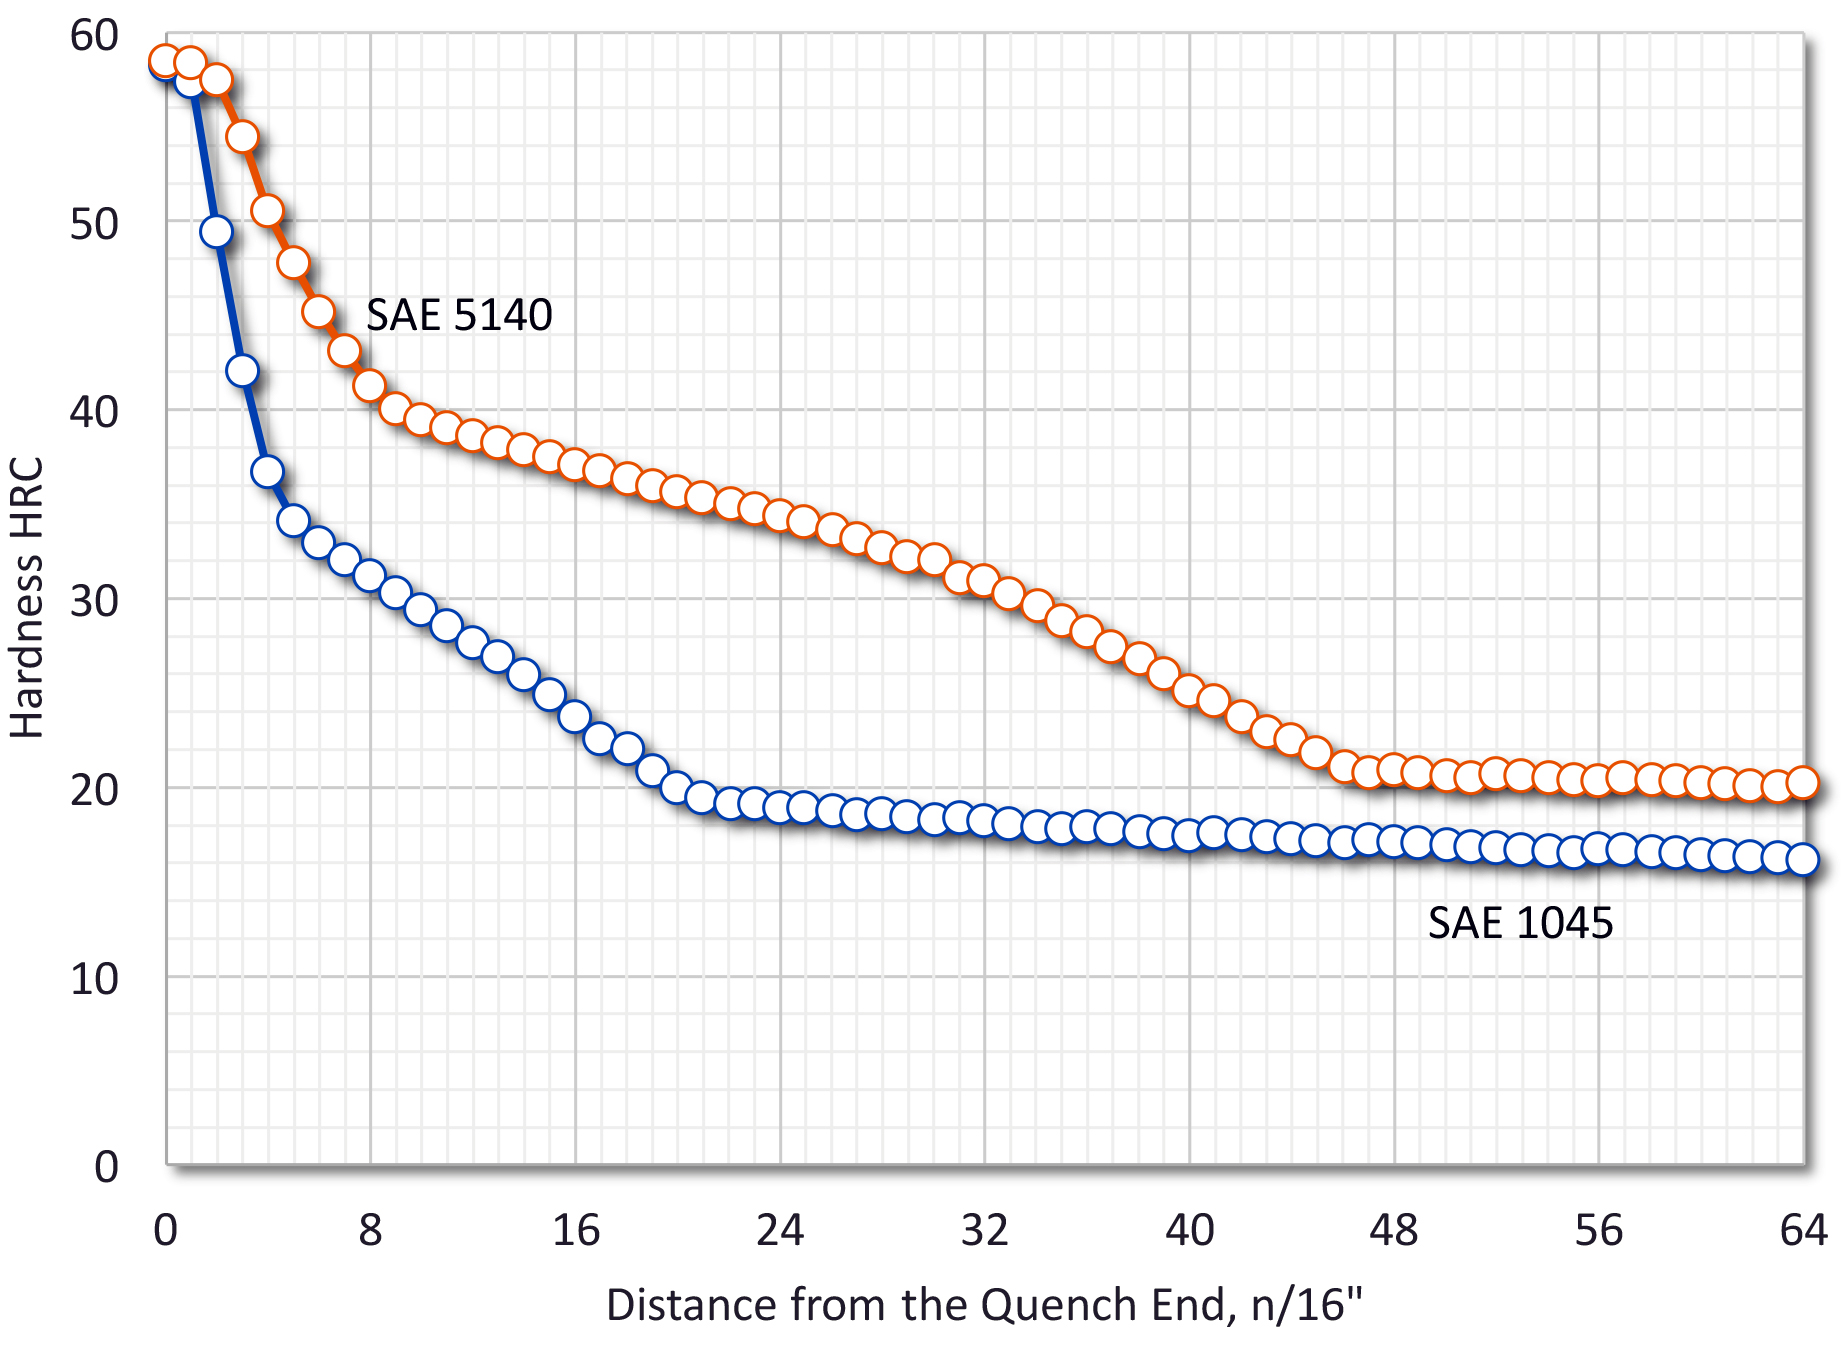
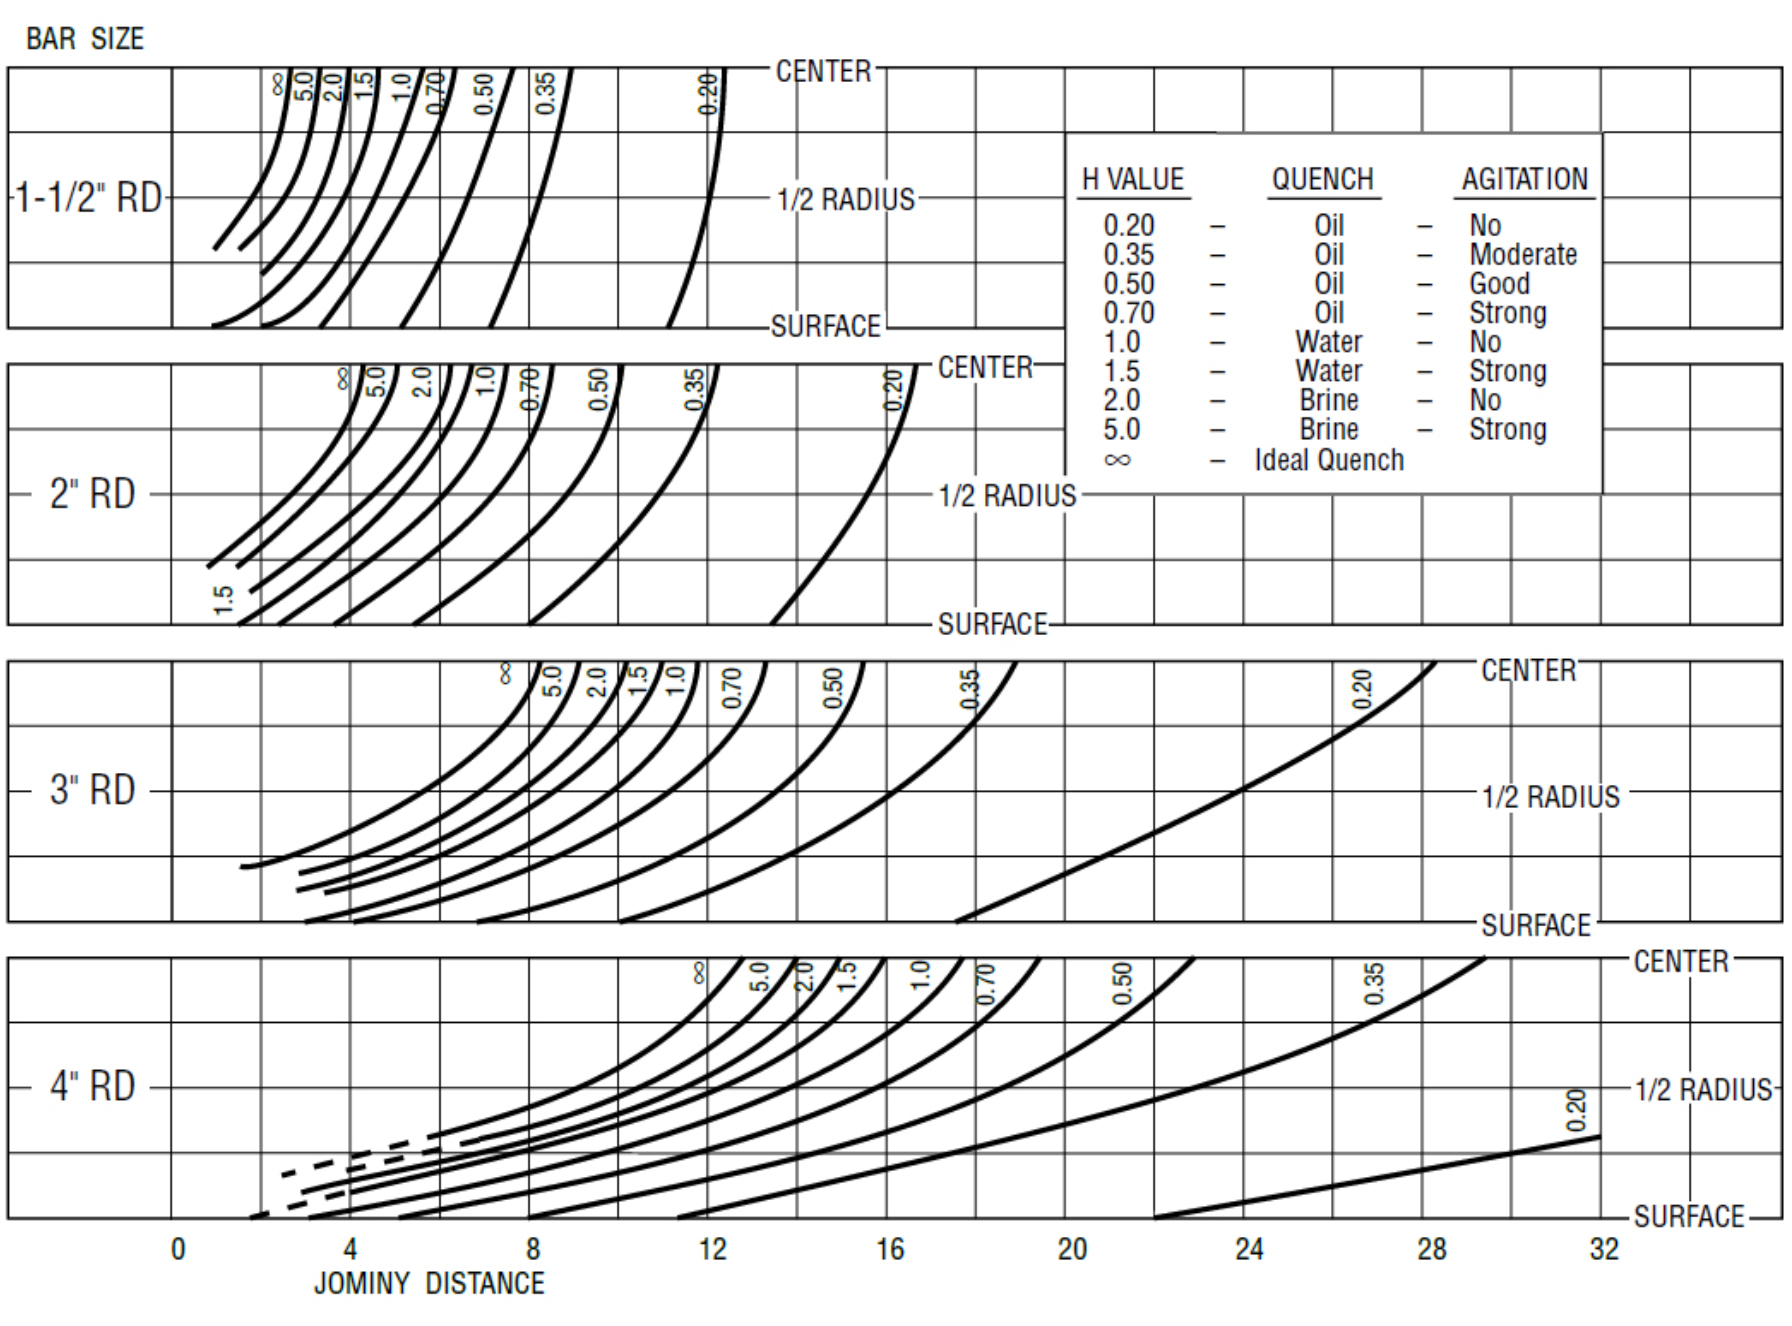
For this article, we will use two alloys: SAE 1045 and SAE 5140 (Table 2). These alloys were chosen because they are commonly used for a wide variety of heat-treated parts, and the data is readily available. Since there is a range of hardenability for each of the alloys, we will use a Jominy End Quench curve that is in the middle of the range for each alloy (Figure 2). A bar diameter of 1.5” and 3” will be used. The Lamont [2] charts (Figure 3) are used from [6].
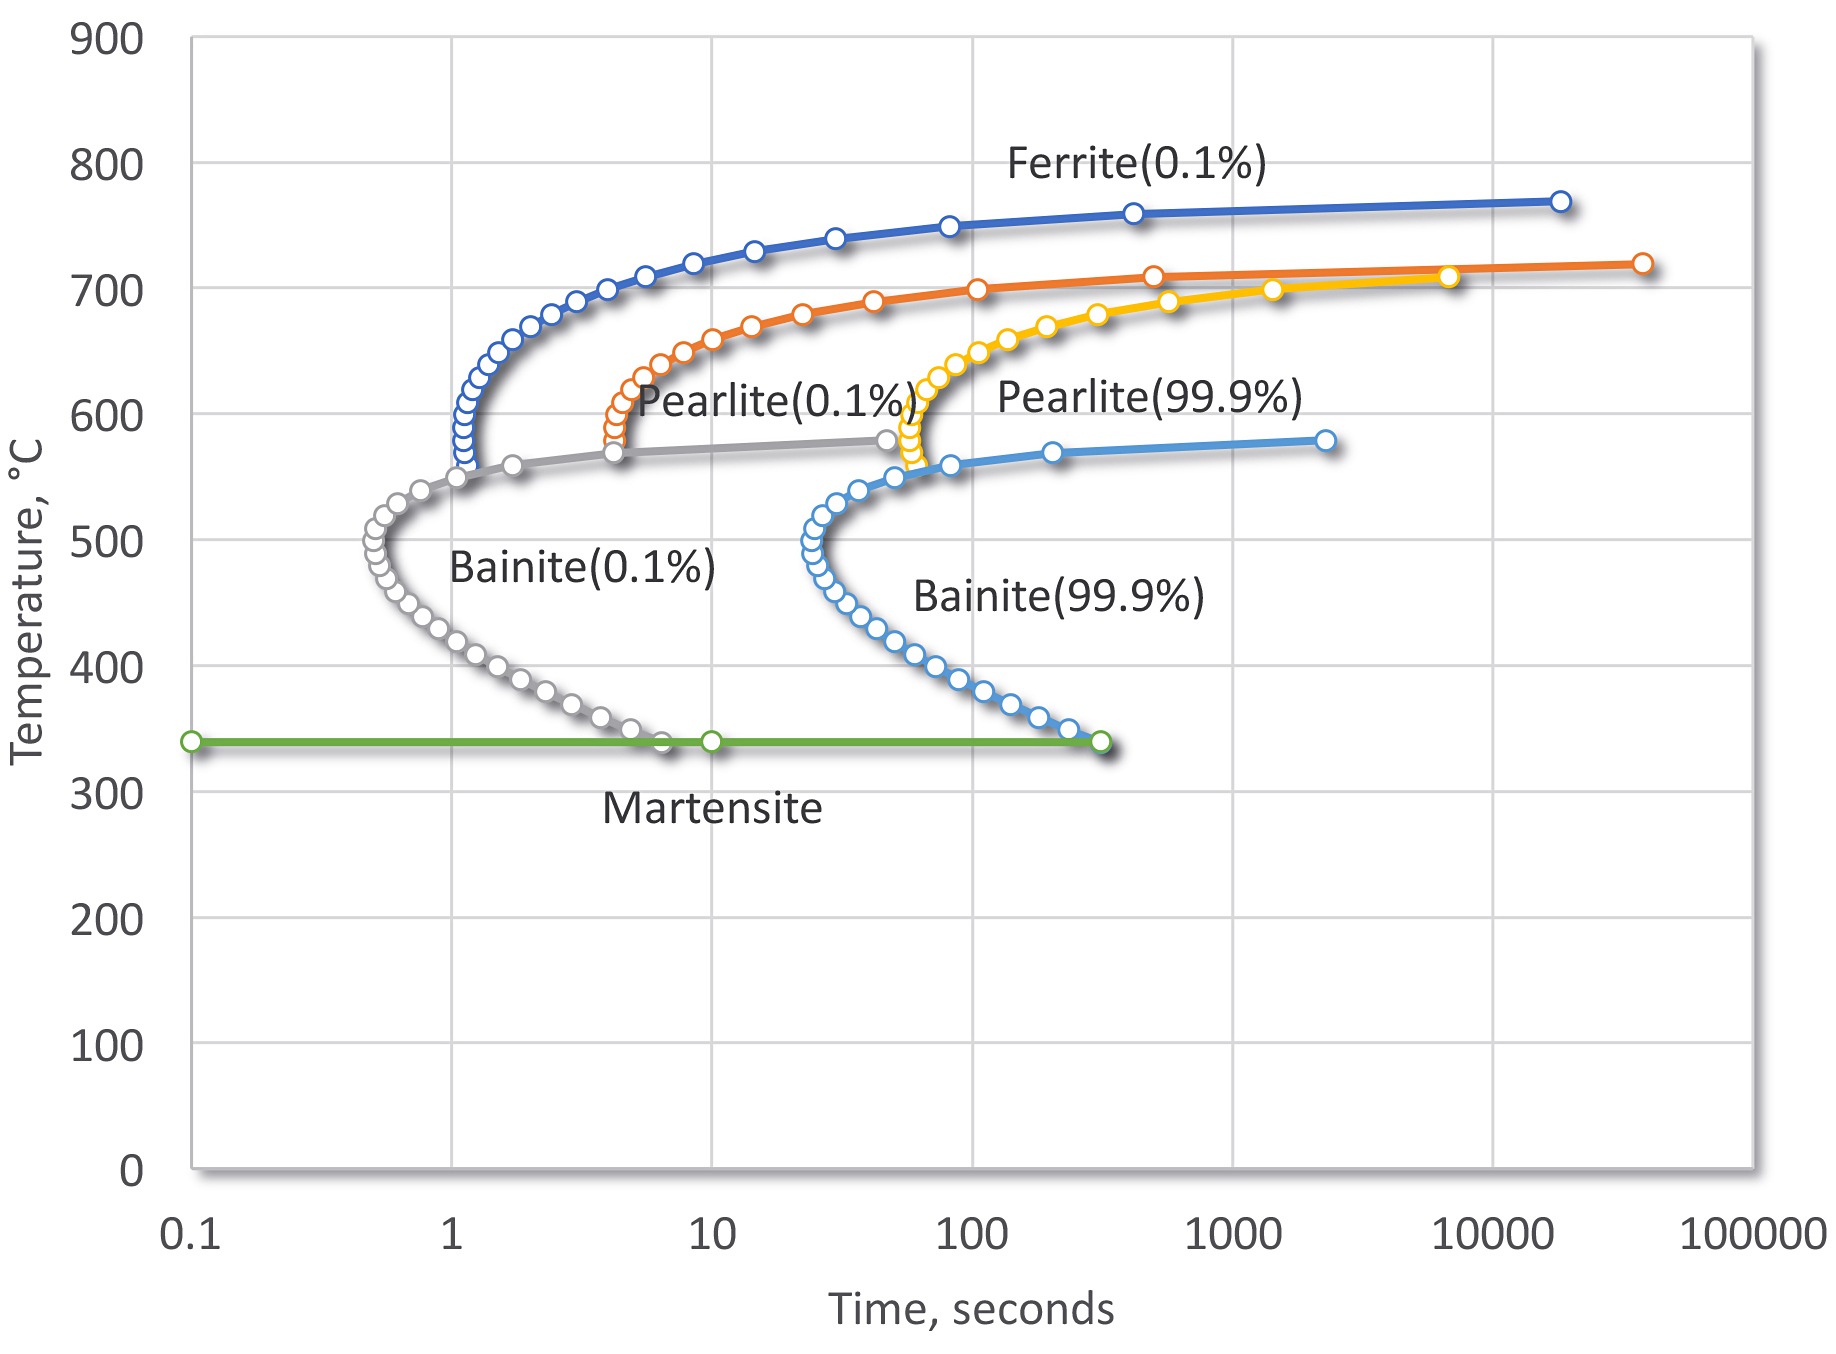
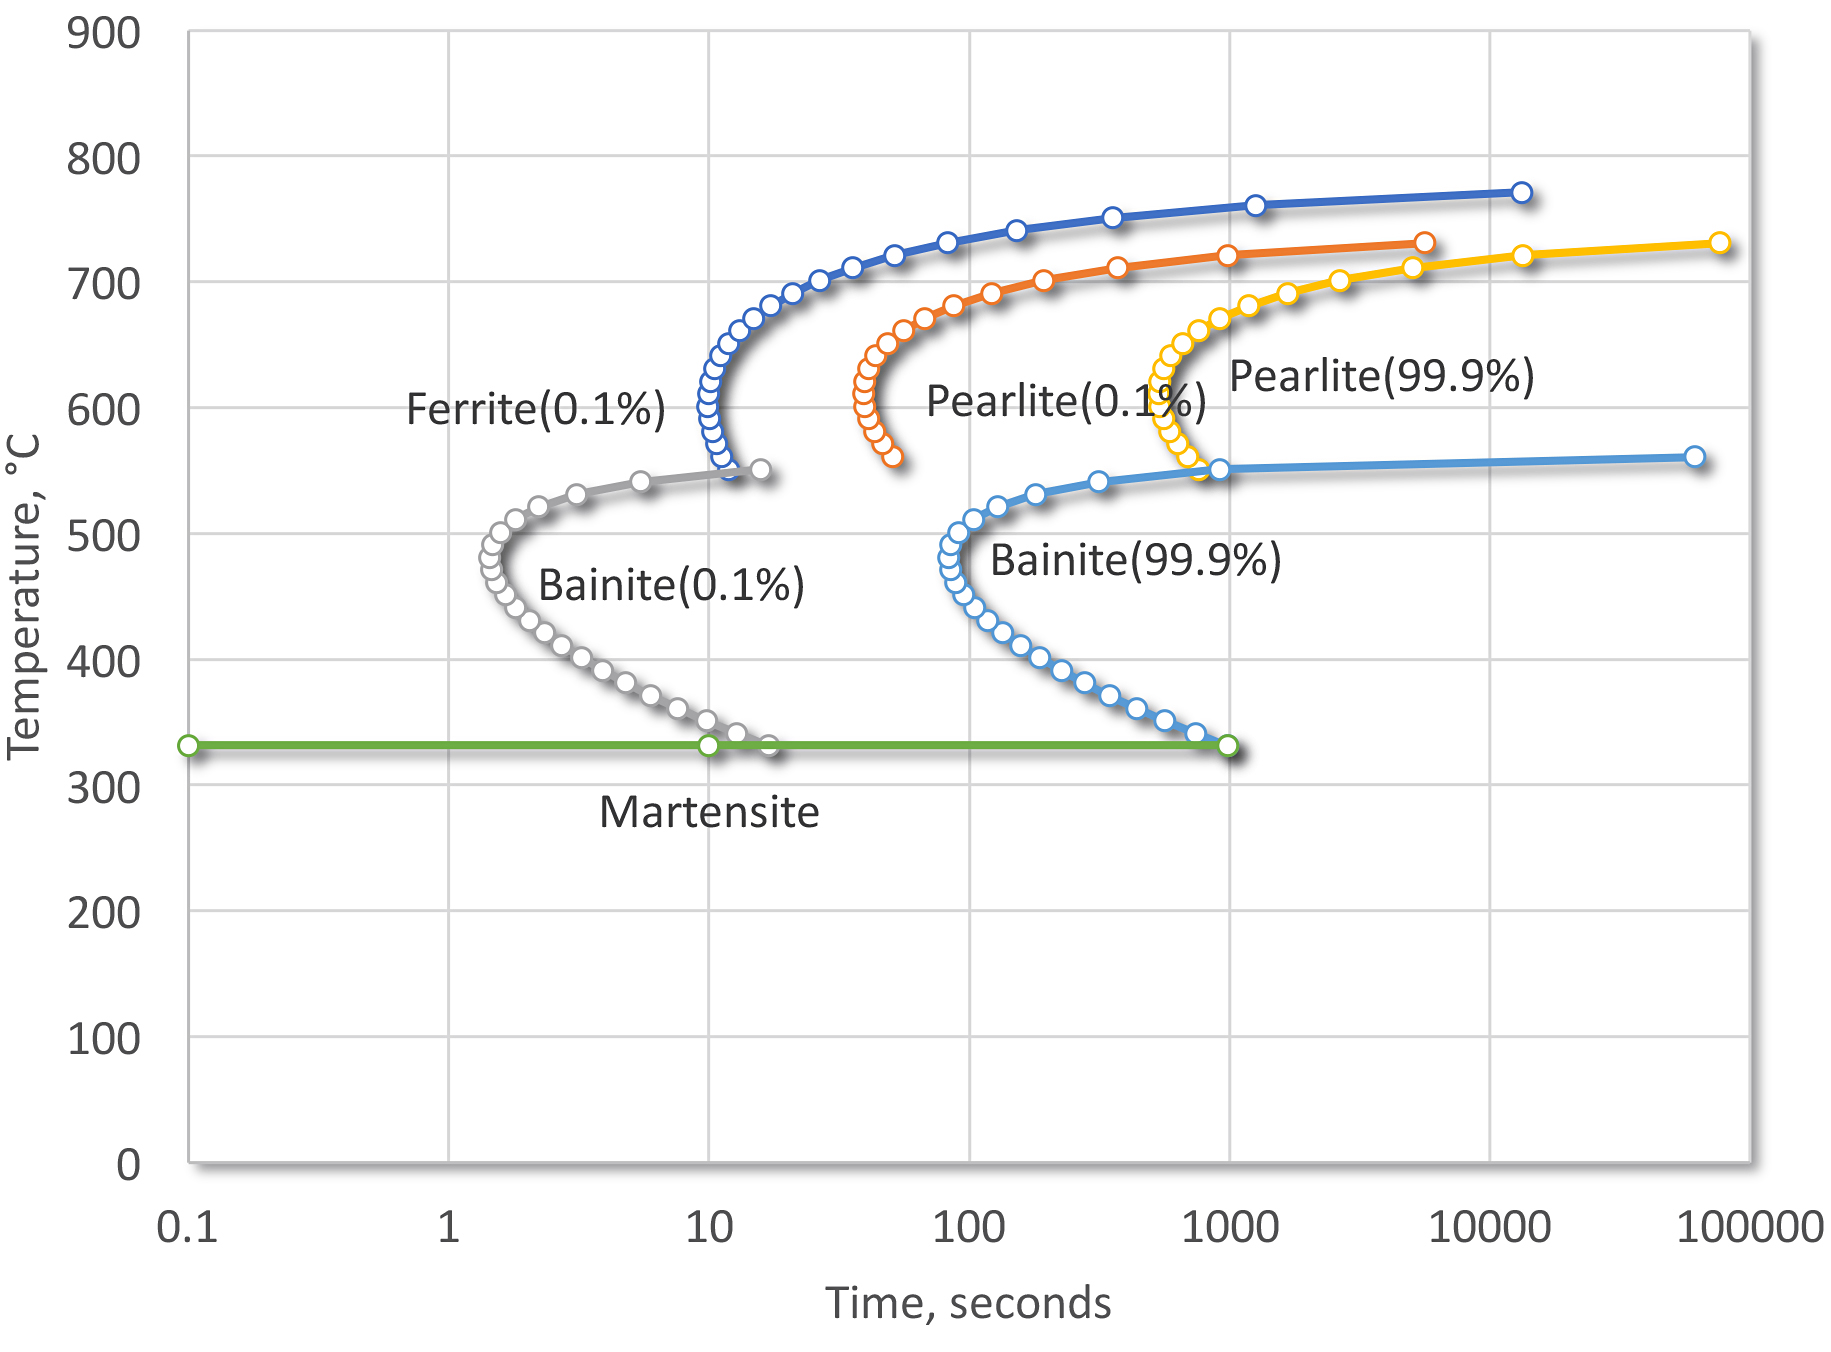
For reference, the Time-Temperature-Transformation curves of SAE 1045 (Figure 4) and SAE 5140 (Figure 5) have been included for reference.
Calculations
Now that we have all the necessary data needed, we can start the calculations.
Grossman H-Value
From the calculated Grossman H-Value of Houghto-Quench G (0.45 in-1), we can determine the hardness as a function of depth for the 1.5” and 3.0” round bars. Looking at the Lamont chart (Figure 3), the Jominy distances for various depths can be determined (Table 3).
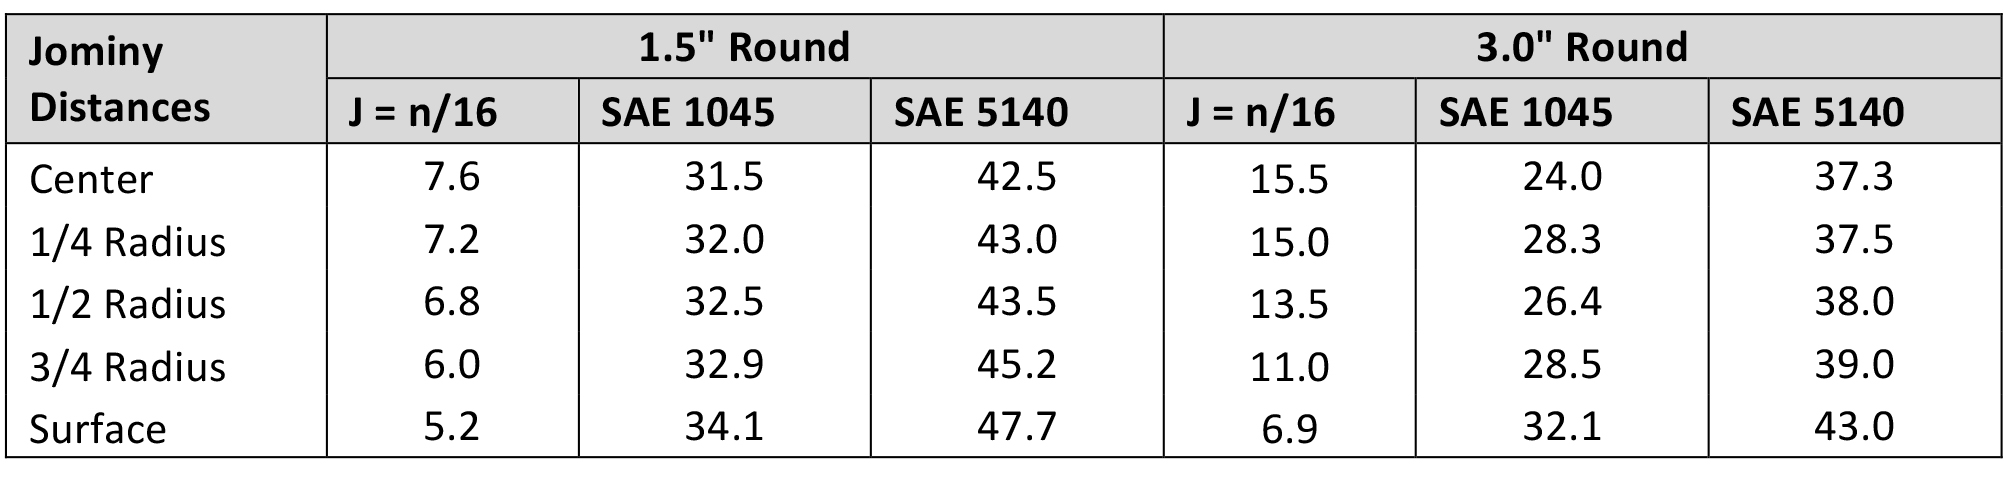
Once the Jominy distances are determined, then it is a simple matter of interpolation to determine the hardness for the desired alloy at the specific Jominy distances. As can be expected, the SAE 1045 and the SAE 5140 1.5” round showed a relatively flat as-quenched hardness profile. From the hardness, it can be expected that the microstructure of the SAE 1045 is predominately ferrite and pearlite, while the SAE 5140 has a microstructure of predominately martensite and bainite.
Ivf SmartQuench Integra
For the Smart Quench Integra [3] to properly calculate hardness and microstructure of a given alloy, it is first necessary to input the cooling curve of the desired quenchant. The curve in Figure 1 is the curve that was measured and input into Smart Quench Integra. It is then necessary to calculate the heat transfer coefficients as a function of surface temperature of the probe. The calculation of the surface coefficients is via the inverse-method [7] [8].
Once the heat transfer coefficients have been determined, it is necessary to categorize the steel of interest. Thermophysical properties, chemistry and Time-Temperature-Transformation data is input into a new file.
This can be directly interpolated from published TTT curves [9], or data from JMatPro calculations [10] can be used. For this article, the calculations from JMatPro were used.
Results
From the data, we can see that using the H-Value yields hardness above the SQ Integra data for low hardenability steels, and below the predicted values for high hardenability steels (Table 4). However, the data is close, usually within 3.5 HRC (except for the 1.5” SAE 1045 at the center, where the hardness difference is 6.6 HRC).
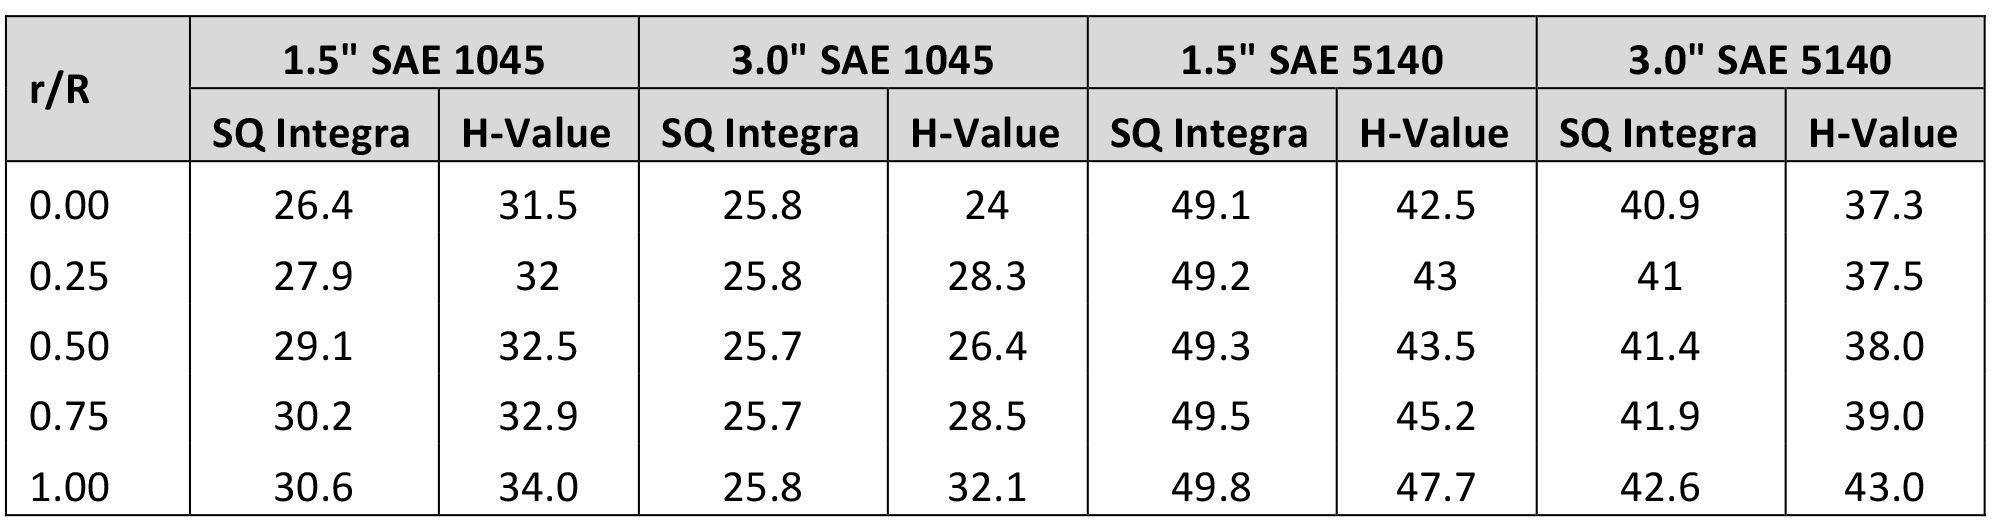
The differences in the 1.5” SAE 5140 bar could be associated with the hardnesses estimated from the TTT curve and input to SQ Integra. For a simple method of calculating hardness, the old-school method of the H-Value provides a quick estimation of the expected hardness for a simple geometry.
If someone wants to duplicate the testing with a real bar of material, and measure the data, I would love to see the results. Contact me if you are interested in verifying these theoretical predictions.
In conclusion, we have shown a simple method of estimating the predicted hardness on several different diameters of material at different hardenability.
Results show reasonable correlation to each other. Even though the method was developed by Grossman in 1940, and extended by Lamont in 1943, its validity is still appropriate for use today.
Should you have any questions regarding this or any other article, please contact the author or editor.
References
- M. A. Grossman and M. Asimov, “Hardenability and Quenching,” Iron Age, vol. 145, no. 17, pp. 25-29, 1940.
- J. L. Lamont, “How to Estimate Hardening Depth in Bars,” Iron Age, no. 10, pp. 64-70, 1943.
- Swerea IVF AB, SQIntegra Product Brochure, Monldal, 2012.
- Sente Software, “JMatPro,” 11 November 2018. [Online]. Available: https://www.sentesoftware.co.uk/.
- ASTM International, Standard Test Method for Determination of Cooling Characteristics of Quench Oils by Cooling Curve Analysis, ASTM D 6200, Conshocken: ASTM, 2012.
- Timken Company, Timken Practical Guide for Metallurgists, 14th ed., Canton, OH: Timken Company, 2015.
- I. Felde and T. Reti, “Evaluation of Cooling Characteristics of Quenchants by Using Inverse Heat Conduction Methods and Property Prediction,” Materials Science Forum, vol. 659, pp. 153-158, 2010.
- E. Troell, H. Kristofferson, J. Bodin, S. Segerberg and I. Felde, “New Tool for Calculation of Heat Transfer Coefficients, Microstructure and Hardness from Cooling Curve,” in IFHTSE 5th International Conference on Quenching and Control of Distortion, Berlin, Germany, 2007.
- American Society for Metals, Atlas of Isothermal Transformation and Cooling Transformation Diagrams, Metals Park, OH: ASM International, 1977.
- N. Saunders, Z. Guo, X. Li, A. P. Miodownik and J. P. Schille, “The Calculation of TTT and CCT Diagrams for General Steels,” Guildford, UK, 2004.


 general practice for CQI-9 and AMS2750E")


