


In the last article, I described how the Jominy end quench test could be used to predict hardness for a series of different round bars, based on the Lamont [1] charts. To calculate the hardness, you needed the Grossman H-value [2]. In this article, the Grossman H-value will be described, and the method of calculating the H-value from cooling curves will be discussed. Limitations of the use of the Grossman H-value will also be provided.
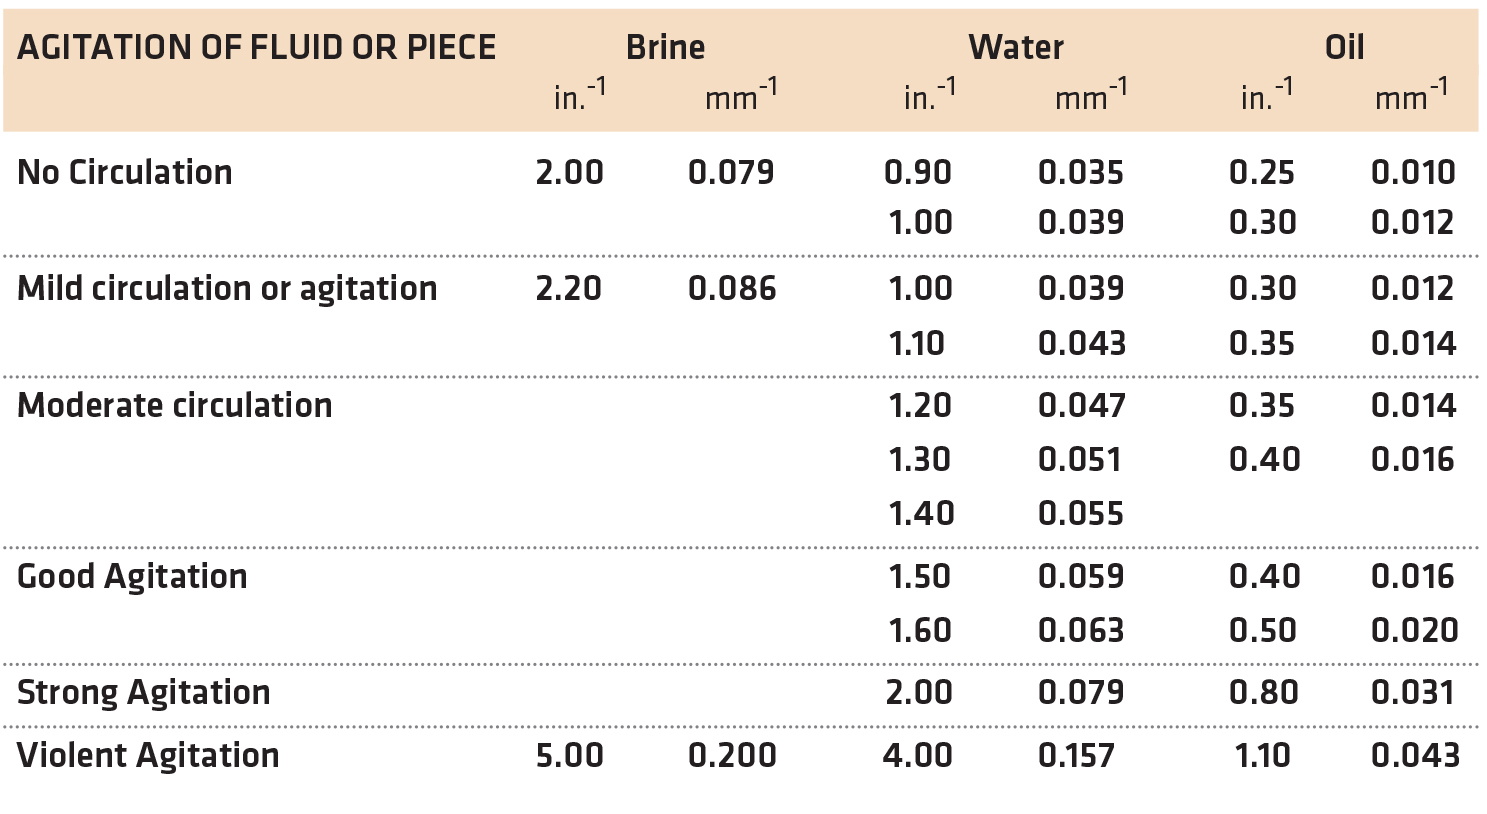
Historically, the Grossman H-value was determined experimentally by quenching a series of round bars. After quenching, the bars are sectioned, polished, and etched. The 50 percent martensite region is determined. This is readily achieved because the transition in etching between dark and light etching corresponds to 50 percent martensite. Table 1 shows the historical values of H-value used.
Classically, the Grossman H-value has been defined as:

Where h is the heat transfer coefficient at the surface of the part (usually defined at 705°C), k is the thermal conductivity of the steel. Since the thermal conductivity of steels does not change appreciably over temperature, or from one alloy grade to another, the Grossman H-value is approximately proportional to the heat transfer coefficient.
Although this method has been used in the industry for many years, it is not without problems. The biggest issue with the application of the Grossman H-value is the difficulty in quantifying agitation rates. The terms describing the agitation are not quantifiable and can result in errors. There is really no understanding of what is meant by “mild” or “violent” agitation. Since most oils are tested without agitation, this results in a narrow range of possible oil values. Also, when the original testing was done, the oils used in the original paper were straight oils, devoid of speed improvers. Modern oils achieve much higher quench rates (nearly double) than those tested in the original paper. Further, the different methods of quenching, such as spray quenching, have no equivalent to the Grossman H-value. This method is only focused on the ability of the quenchant to harden steel and gives no indication regarding distortion. However, use of the Grossman H-value provides a method of determining the hardness of a steel alloy based on the quenchant used.
Calculation of H-value
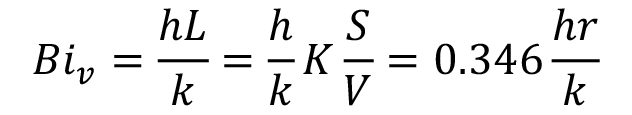
Previously, there has not been a way of determining the severity of quench (H) from cooling curve data. Recently, a correlation of the Grossman H-value to cooling curve data was presented [4]. In this method, the average heat transfer coefficient at 705°C was correlated to the Grossman H-value. This method is based on the methodology of Kobasko [5][6]. In this method, the dimensionless Biot number is used:

Where h is the heat transfer coefficient, k is the thermal conductivity, and L is the characteristic length. In this instance, the measuring device is the ISO 9950 [7] or ASTM D6200 [8]. In each case, this is a 12.5 mm diameter probe composed on Inconel 600. For an infinite cylinder (L > 7D), the characteristic length, L = 0.346r (r is the radius of the probe or 12.5 mm for the ISO 9950 probe). The equation above can be rewritten as:
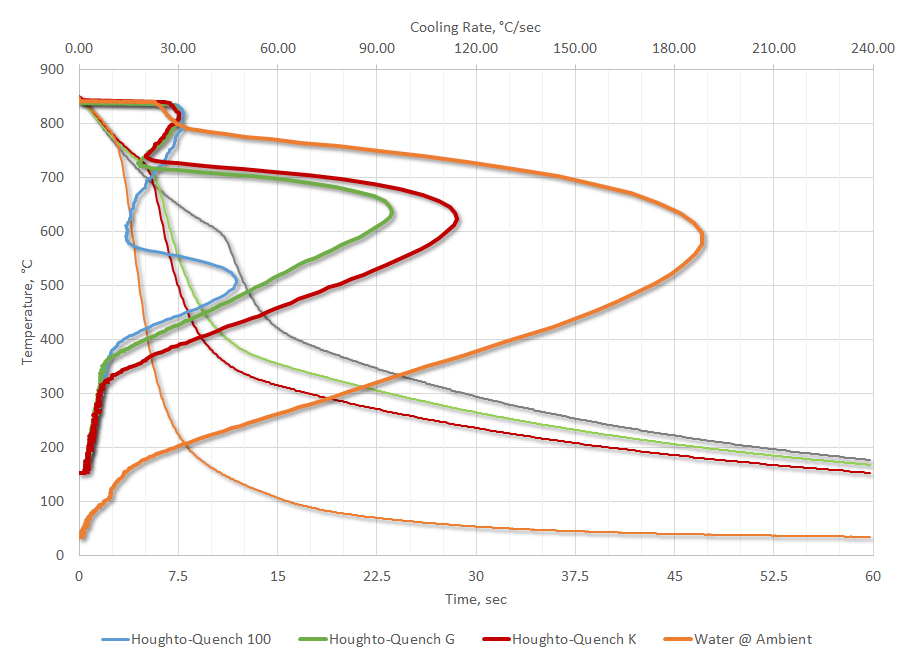
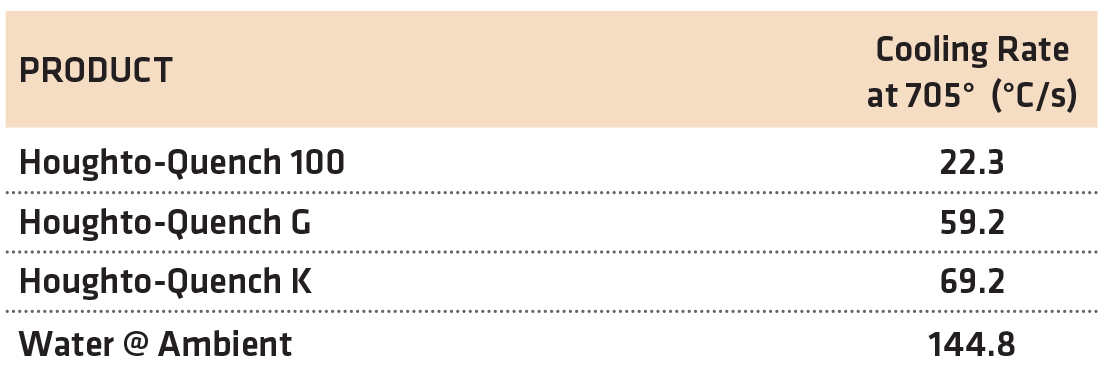
The thermal conductivity of Inconel 600 can be determined from the literature, so that the only remaining variable to determine is the heat transfer coefficient. We also must determine the cooling rate at 705°C. The cooling rate at 705°C is determined from the cooling curve from your supplier, using an ASTM D6200 Inconel 600 probe. Four examples will be used (Figure 1). The cooling rates at 705°C are shown in Table 2.
The intensity of the thermal gradient in the probe is determined:

Where mα is the intensity of thermal gradient in the probe; α is the thermal diffusivity of Inconel 600 (or 5.6 x 10⁻⁶ m2/s); and K is the Kondratjev form factor K. For a cylinder, K is

Where R is the diameter of the probe. For the ISO 9950 probe, K = 6.75 x 10⁻⁶ m2.
Next, the intensity of the thermal gradient in the fluid is calculated:

Where T is the temperature the heat transfer coefficient is desired (in this case 705°C); T ∞ is the quenchant temperature an infinite distance from the probe (the bulk average temperature of the fluid — in our case 60°C); and CR705 is the cooling rate at 705°C from the cooling curve.
The Kondratjev number, Kn, is the ratio of the intensity gradients:

The Kondratjev number, Kn, is also a function of the generalized Biot number, Biv:
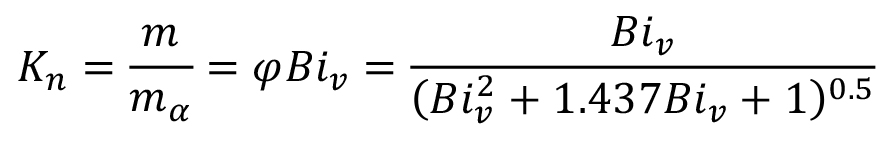
This relationship is shown in Figure 2.
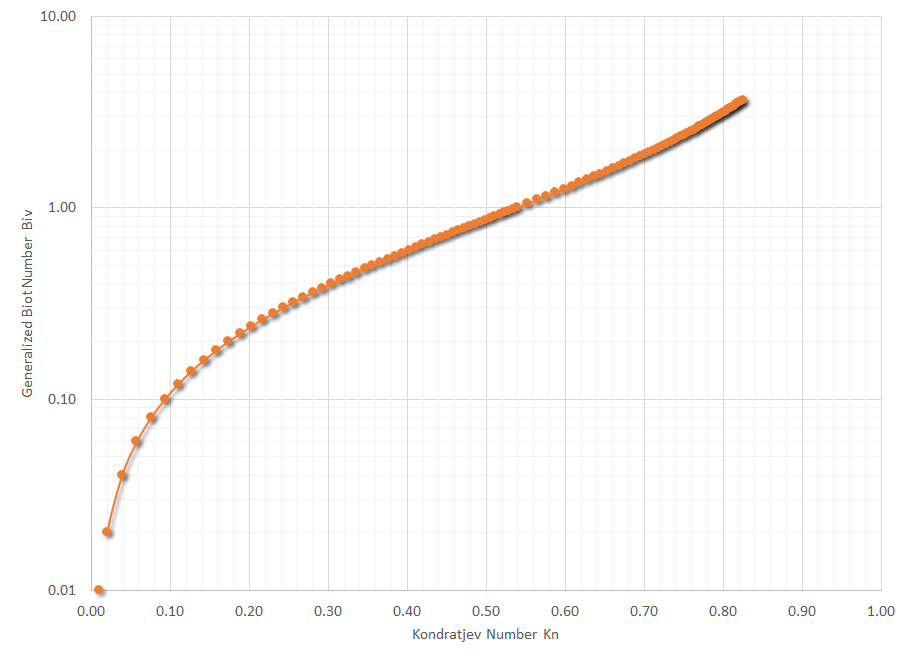
From the ratio of intensity gradients, the Kondratjev number, Kn, is calculated. Using Figure 2, the generalized Biot number is determined. From there, the heat transfer coefficient at 705°C is determined:

The value of the heat transfer coefficient, h, is substituted in the equation below.

Example: Assume that the cooling rate at the center of a standard ASTM D6200 Inconel probe (12.5 mm diameter by 60 mm long) when quenched into Houghto-Quench K is 69.2°C/s. The bath temperature is 60°C. The thermal diffusivity of Inconel 600 is equal to 5.6 x 10⁻⁶ m2/s. The thermal conductivity of Inconel 600 is equal to 25.4 W/mK. Calculate the heat transfer coefficient h, and the Grossman H value.
First calculate m:

Next calculate mα:

Calculate Kn:

In Figure 2, determine the generalized Biot number, Biv from Kn. From the graph, Biv = 0.143.
Determine the heat transfer coefficient, h:
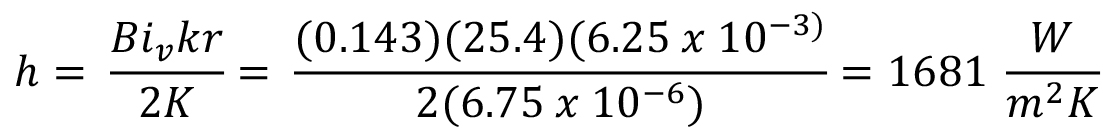
The Grossman H-value can now be determined:

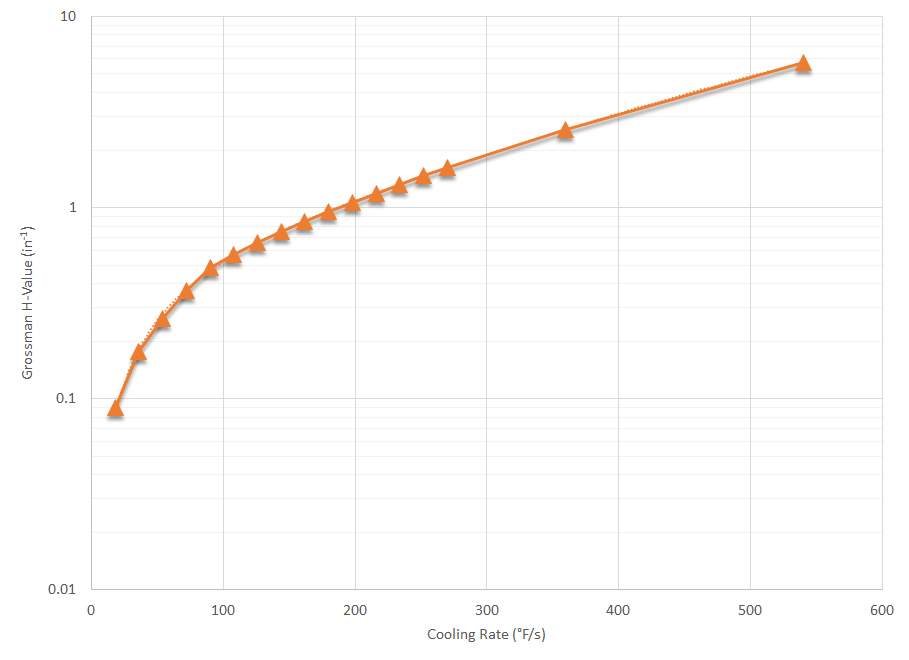
To make things easier, I have calculated the effect of cooling rate at 705°C on H-value for a wide range of cooling rates. This is shown in Figure 3. From this graph, the determination of the H-value from the cooling curve has been reduced significantly. An advantage of this method is that the H-value can be determined from the cooling curve. If cooling curves are determined with different agitation rates, the H-value can be directly determined.
Conclusions
In this short article, a description of the method to determine the Grossman H-value from cooling curves has been illustrated. This offers the reader the ability to examine and predict the effect of different quenchants on the resultant hardness for simplified geometries.
References
- J. L. Lamont, “How to Estimate Hardening Depth in Bars,” Iron Age, no. 10, pp. 64-70, 1943.
- M. A. Grossman and M. Asimov, “Hardenability and Quenching,” Iron Age, vol. 145, no. 17, pp. 25-29, 1940.
- B. Liscic, H. M. Tensi, L. C. Canale and G. E. Totten, Eds., Quenching Theory and Technology, Boca Raton, FL: CRC Press, 2010.
- D. S. MacKenzie, “Selection of Oil Quenchants for Heat Treating Processes,” in 23rd IFHTSE Heat Treatment and Surface Engineering Congress, April 18-21, Savannah, GA, 2016.
- N. Kobasko, “Optimized Quenched Layer for Receiving Optimal Residual Stress Distribution and Super-strength Material,” in 3rd WSEAS International Conference on Applied and Theoretical Mechanics, Barcelona, Spain, December 14-16, 2007.
- R. Otero, “Calculation of Kobasko’s Simplified Heat Transfer Coefficients from Cooling Curve Data Obtained with Small Probes,” J. ASTM, vol. 4, no. 2, pp. 30-36, 2012.
- International Organization for Standardization, “Industrial quenching oils — Determination of cooling characteristics — Nickel-alloy probe test method,” Geneva, 1995.
- ASTM International, Standard Test Method for Determination of Cooling Characteristics of Quench Oils by Cooling Curve Analysis, ASTM D 6200, Conshocken: ASTM, 2012.


 general practice for CQI-9 and AMS2750E")


